Massage Equipment Market Size and Share
Market Overview
| Study Period | 2021 - 2031 |
|---|---|
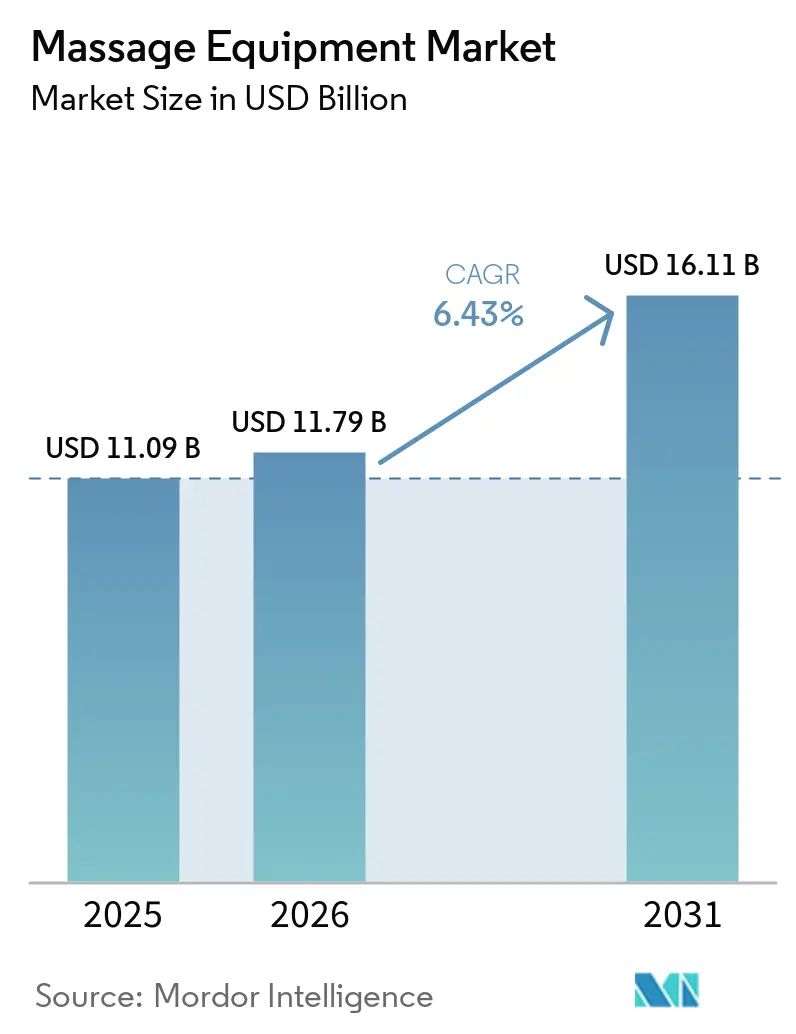
| Market Size (2026) | USD 11.79 Billion |
| Market Size (2031) | USD 16.11 Billion |
| Growth Rate (2026 - 2031) | 6.43% CAGR |
| Fastest Growing Market | Asia-Pacific |
| Largest Market | North America |
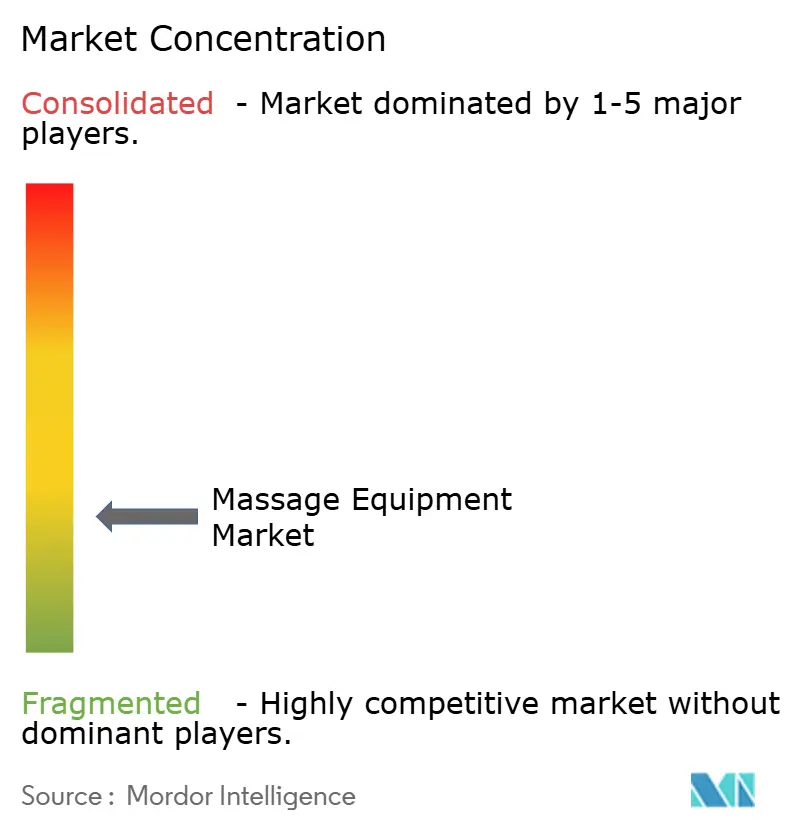
| Market Concentration | Low |
Major Players *Disclaimer: Major Players sorted in no particular order Image © Mordor Intelligence. Reuse requires attribution under CC BY 4.0. | |
Massage Equipment Market Analysis by Mordor Intelligence
The massage equipment market size was valued at USD 11.09 billion in 2025 and is estimated to grow from USD 11.79 billion in 2026 to USD 16.11 billion by 2031, at a CAGR of 6.43% during the forecast period (2026-2031). The massage equipment market is advancing on the back of broader wellness spending, as the global wellness economy reached USD 6.8 trillion in 2024 and is forecast to reach USD 9.8 trillion by 2029, according to the Global Wellness Institute[1]Source: Global Wellness Institute, “The Global Wellness Economy Hits a Record USD 6.8 Trillion and Is Forecast to Reach USD 9.8 Trillion by 2029,” Global Wellness Institute, globalwellnessinstitute.org. Demand is also being supported by older populations, longer desk-based work routines, and a broader shift toward home-based recovery tools for muscle tension, circulation support, and stress relief. Commercial demand stabilizes the massage equipment market by enabling spas, wellness resorts, physiotherapy clinics, and corporate wellness spaces to buy higher-value units and replace them on planned cycles. The global spa economy reached USD 157.4 billion in 2024 and is projected to continue expanding through 2029, supporting replacement demand and new installations across professional settings. The massage equipment market is also creating new growth opportunities through compact formats, online fulfillment for large products, and smart features that make premium products more useful in smaller homes and more appealing to repeat buyers.
Key Report Takeaways
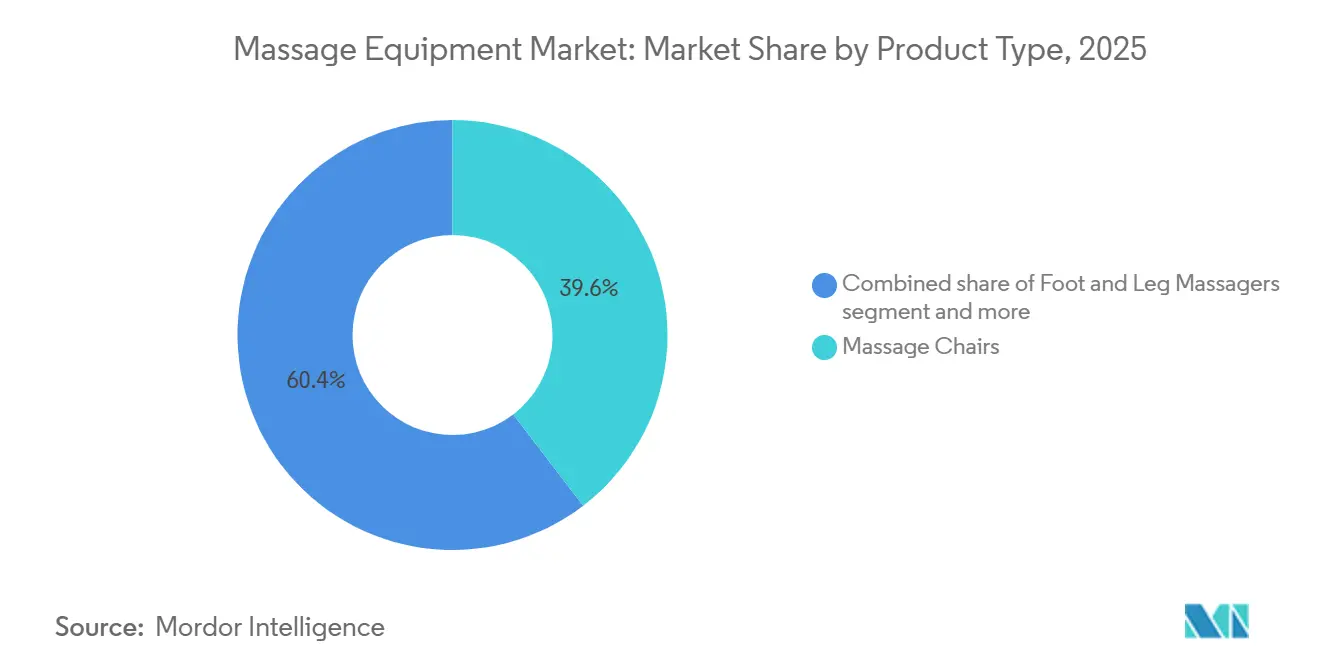
- By product type, massage chairs accounted for 39.55% of the massage equipment market share in 2025, while foot and leg massagers are projected to grow at a 7.67% CAGR through 2031.
- By operation type, electric equipment accounted for 78.74% of the massage equipment market size in 2025, and this segment is forecast to expand at 6.75% CAGR through 2031.
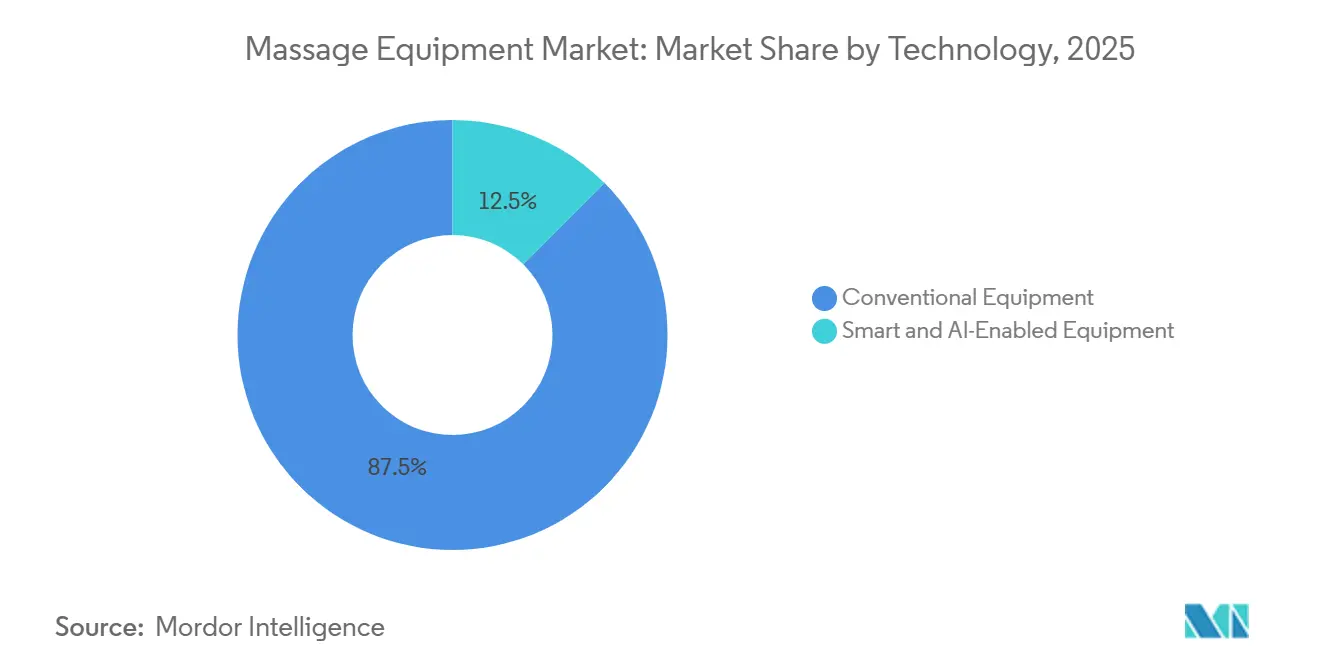
- By technology, conventional equipment accounted for 87.49% of the market share in 2025, while smart and AI-enabled equipment is expected to record the highest CAGR of 9.19% through 2031.
- By end user, commercial buyers accounted for 83.54% of the market in 2025, while residential demand is projected to grow faster at a 7.83% CAGR through 2031.
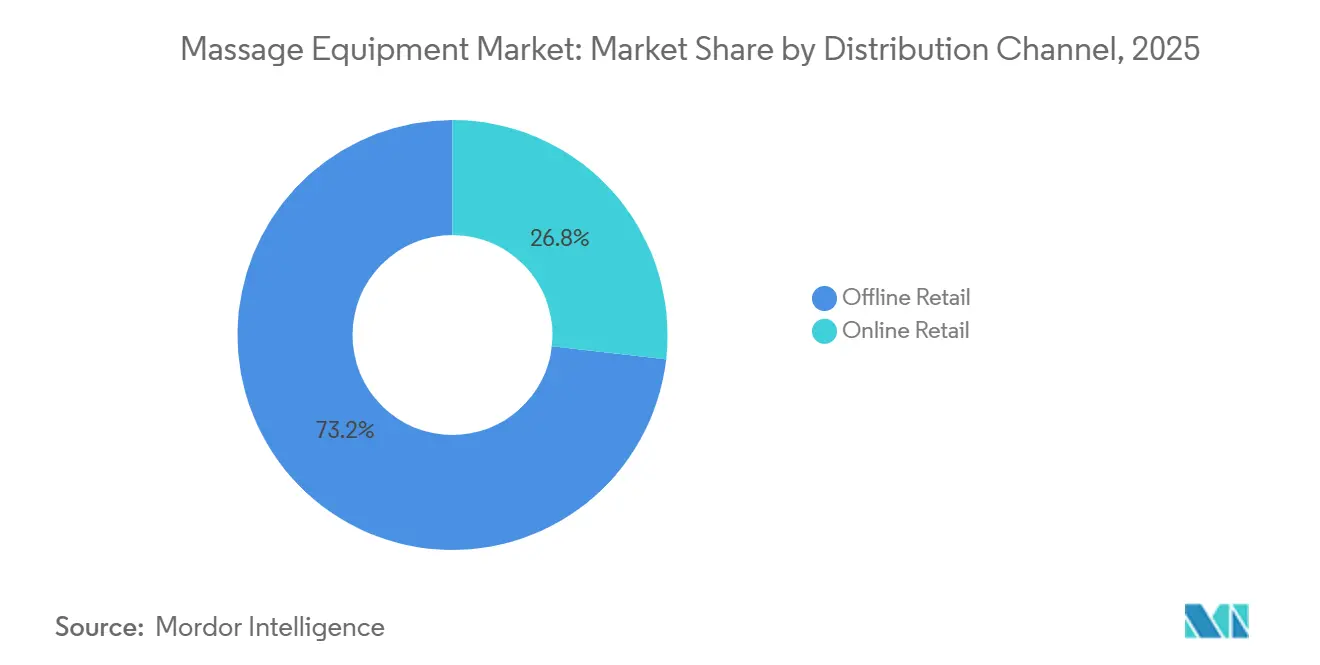
- By distribution channel, offline retail held a 73.25% share in 2025, while online retail is expected to grow at a 8.64% CAGR through 2031.
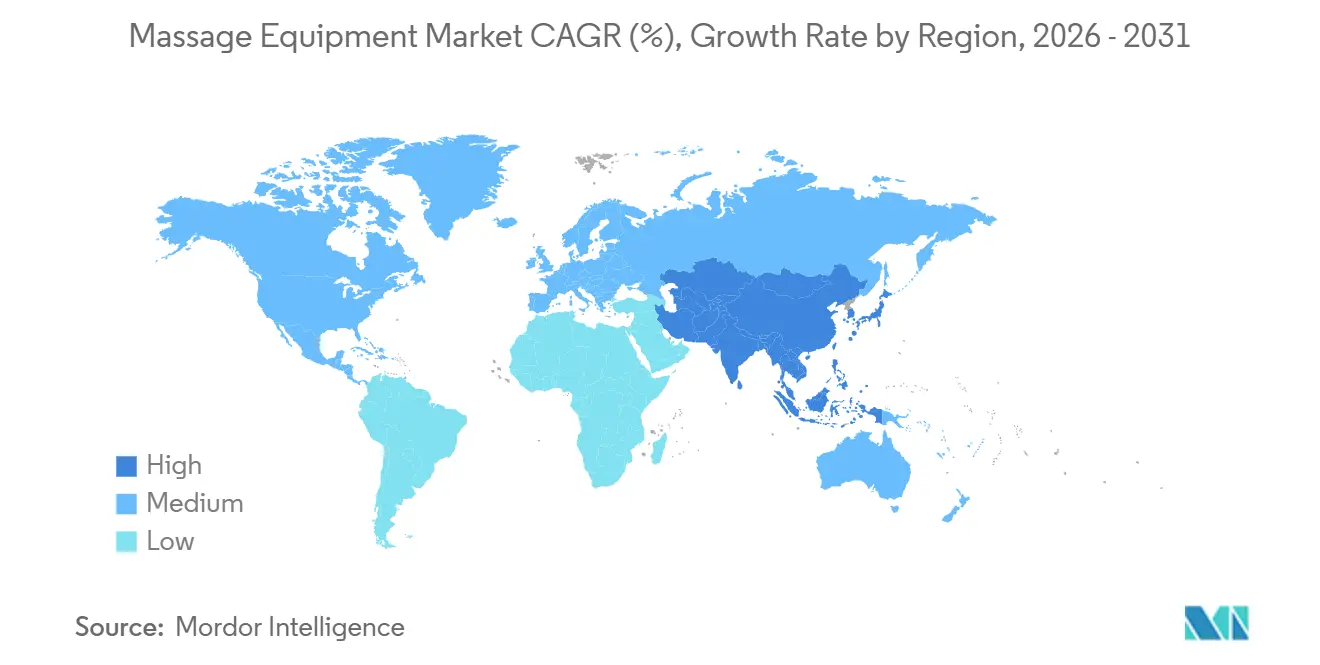
- By geography, North America held 36.93% of the massage equipment market share in 2025, while Asia-Pacific is expected to expand at 7.56% CAGR through 2031.
Note: Market size and forecast figures in this report are generated using Mordor Intelligence’s proprietary estimation framework, updated with the latest available data and insights as of January 2026.
Global Massage Equipment Market Trends and Insights
Drivers Impact Analysis*
| Driver | (~) % Impact on CAGR Forecast | Geographic Relevance | Impact Timeline |
|---|---|---|---|
| Rising Demand for Home-Based Pain Relief and Recovery Devices | +1.6% | Global, with core gains in North America and Western Europe | Short term (≤ 2 years) |
| Expansion of Commercial Wellness, Spa, and Physiotherapy Installations | +1.2% | Global, particularly strong in Asia-Pacific and MEA | Medium term (2-4 years) |
| Product Innovation in Smart, Connected, and AI-Enabled Massage Devices | +1.4% | North America, Asia-Pacific, especially Japan, South Korea, and China | Medium term (2-4 years) |
| Higher Penetration of Portable and Space-Saving Formats in Urban Households | +0.8% | Asia-Pacific core, with spillover to Europe and North America | Short term (≤ 2 years) |
| Subscription and Corporate Wellness Procurement Models Improving Repeat Demand | +0.6% | North America and Europe | Medium term (2-4 years) |
| Under-Served Mid-Premium Price Band in Emerging Urban Markets | +0.7% | Asia-Pacific, South America, and MEA | Long term (≥ 4 years) |
| Source: Mordor Intelligence | |||
Rising demand for home-based pain relief and recovery devices
The massage equipment market is benefiting from a clear shift in how consumers address recurring pain, fatigue, and recovery needs at home. Longer hours at desks, frequent screen use, and reduced physical movement have increased neck, shoulder, and lower back discomfort across office workers, older adults, and younger consumers with sedentary routines. The broader wellness backdrop supports this shift, with the personal care and beauty segment of the wellness economy maintaining steady growth between 2019 and 2024. That pattern suggests consumers were already spending more on self-managed health and recovery before the current forecast period began. The massage equipment market is therefore drawing demand not only from comfort-led purchases, but also from buyers who now see these products as a practical substitute for repeated therapy visits, especially when models include compression, kneading, stretching, or targeted pressure functions. This shift is also visible in the regulatory pipeline, as the US FDA granted 510(k) clearance for a hand massager in November 2025 under 21 CFR 890.5650, showing that device makers are moving further into products with stronger therapeutic positioning[2]Source: U.S. Food and Drug Administration, “510(k) Clearance K251622, Hand Massager (SM004D),” U.S. Food and Drug Administration, accessdata.fda.gov.
Expansion of commercial wellness, spa, and physiotherapy installations
Commercial buyers remain one of the strongest supports for the massage equipment market because they purchase higher-ticket systems and often refresh equipment on a structured cycle. Spa expansion continues to matter here, as the global spa sector reached USD 157.4 billion in 2024 and is projected to keep growing at a steady pace through 2029, according to the Global Wellness Institute. That growth increases equipment demand across wellness resorts, hotel treatment zones, destination spas, and premium fitness clubs, where massage chairs and recovery systems are part of the service offer rather than optional add-ons. Physiotherapy clinics also expand their commercial base by using air-compression devices, vibration units, and recovery chairs in post-treatment routines and supervised therapy settings. The massage equipment market gains another layer of support when businesses introduce relaxation rooms or employee wellness spaces, as these programs drive repeat orders and strengthen demand beyond residential replacement cycles. Commercial adoption also tends to raise the quality threshold in the category, because buyers in these channels pay closer attention to durability, maintenance support, and safety standards before placing large orders.
Product innovation in smart, connected, and AI-enabled massage devices
Product development is changing the pace and shape of competition in the massage equipment market. Smart features are no longer limited to very high-end chairs, and manufacturers are using personalization, app control, body scanning, and stored user settings to make devices feel more tailored and more useful over time. Panasonic’s RealPro CasaLine EP-MA110, launched in Japan in late 2025, shows how this trend is developing in practical ways, combining AI-controlled pressure precision with a narrow 68 cm form factor designed for standard apartment door widths[3]Source: Panasonic Newsroom Japan, “Massage Chair ‘RealPro CasaLine’ (EP-MA110) Launch Announcement,” Panasonic Newsroom Japan, news.panasonic.com. That example matters because innovation in the massage equipment market now includes both digital capability and physical design adaptation, especially in dense urban markets where a large chair must still fit into small homes. As more products collect preference data and automate pressure, intensity, and program choices, competition is shifting away from simple hardware comparisons and toward a more complete user experience. This is why the massage equipment market is seeing stronger momentum in smart products than in conventional units, even though conventional equipment still holds the larger installed base.
Subscription and corporate wellness procurement models improving repeat demand
The massage equipment market is also being helped by a slow change in how products are paid for and placed. Rental and subscription models that were already familiar in parts of East Asia are widening the addressable base by turning a high one-time purchase into a lower monthly commitment. That change matters in offices, clinics, and shared wellness spaces, where buyers often prefer predictable service contracts, scheduled maintenance, and easier equipment upgrades. Corporate wellness programs add another layer of demand, as massage chairs, compact recovery systems, and ergonomic seating with massage functions can now be placed in break rooms, recovery areas, or as part of remote-work support plans. The massage equipment market benefits from this model because it reduces purchase friction, spreads costs over time, and supports recurring revenue rather than relying solely on large, uneven product sales. It also helps brands reach users who may start with employer-supported access or a short-term rental and later move to personal ownership, thereby widening the long-term buyer pool without forcing aggressive discounting.
Restraints Impact Analysis*
| Restraint | (~) % Impact on CAGR Forecast | Geographic Relevance | Impact Timeline |
|---|---|---|---|
| Limited Affordability in Price-Sensitive Markets | -1.0% | South Asia, Southeast Asia, Latin America, and Sub-Saharan Africa | Long term (≥ 4 years) |
| Competition from Professional Massage Services | -0.8% | Southeast Asia, South America, and Western Europe | Short term (≤ 2 years) |
| Safety, Durability, and Warranty Concerns for Motorized Devices | -0.5% | Global | Medium term (2-4 years) |
| Limited In-Home Space and Product Footprint Constraints | -0.4% | Urban Asia-Pacific and Western Europe | Medium term (2-4 years) |
| Source: Mordor Intelligence | |||
Limited affordability in price-sensitive markets
Affordability remains a clear restraint for the massage equipment market in many fast-growing countries, where awareness is rising faster than household spending power. Mid-premium massage chairs and even better-quality foot or back devices can still sit outside the comfort range of many middle-income buyers in South Asia, Southeast Asia, and parts of Latin America. The gap is evident in wellness spending patterns: Asia recorded per-capita wellness spending of USD 471 in 2024, compared with USD 6,029 in North America, according to the Global Wellness Institute. That difference helps explain why the massage equipment market can post healthy unit growth in emerging cities while still facing slower household penetration than mature markets. Manufacturers are responding with entry-level models, installment financing, and rental offers, but those strategies can limit margins and reduce the room for premium innovation. In markets where a professional massage session is still low-cost and easy to access, many consumers continue to compare the payback period of buying equipment against years of occasional service use, which keeps conversion rates lower than headline interest levels might suggest.
Competition from professional massage services
The massage equipment market also faces strong competition from professional massage services, especially in countries where therapeutic massage is part of everyday wellness culture. In places such as Thailand, Japan, South Korea, China, and parts of Europe, consumers often value the human side of treatment, including technique changes, direct feedback, and post-session advice. That makes it harder for residential equipment to fully replace professional care, particularly in the mid-tier range, where devices still have limits in precision and adaptability. At the same time, this pressure is not uniform across regions, because labor shortages and higher service costs in North America and Western Europe are making at-home recovery tools more attractive than before. The massage equipment market, therefore, faces a mixed effect, with professional services acting as a substitute in some countries while rising service prices create an opening in others. This dynamic keeps manufacturers focused on use cases where convenience, frequent access, and lower long-term costs matter more than the personalized treatment a therapist provides.
*Our forecasts treat driver/restraint impacts as directional, not additive. The impact forecasts reflect baseline growth, mix effects, and variable interactions.
Segment Analysis
By Product Type: Massage Chairs Anchor Value While Foot and Leg Massagers Expand Faster
Massage chairs accounted for 39.55% of the segment's revenue in 2025, keeping them at the center of the massage equipment market. Their position is supported by high average selling prices, broader feature sets, and strong relevance in both commercial installations and premium households. Full-body systems also remain the clearest expression of category upgrading, as brands use them to showcase body-scanning, programmable memory, compression zones, and multi-position recline. In the massage equipment market, chairs often define the price ceiling and shape consumer expectations for what a premium product should deliver. That keeps them important even when unit volumes grow faster in smaller device categories.
Back massagers and neck and shoulder products remain important because they attract first-time buyers and consumers who want a lower-cost, easier-to-store option. Head massagers continue to serve a smaller niche, especially in stress-relief and office-wellness settings, where portability and shorter use cycles matter more than full-body coverage. Foot and leg massagers are projected to grow at a 7.67% CAGR through 2031, driven by their compact design, lower entry prices, and appeal to older users or buyers managing circulation discomfort. The US FDA clearance for an air compression leg massager in January 2025 supports the view that this product type is moving closer to therapy-adjacent positioning in parts of the market. That makes foot and leg devices one of the most practical growth points in the massage equipment industry because they combine easier ownership with a clearer everyday use case.


By Operation Type: Electric Equipment Remains the Core Revenue Base
Electric equipment accounted for 78.74% of the market value in 2025 and therefore served as the broad operating standard for the massage equipment market. Buyers continue to prefer electric systems because they offer programmable routines, stronger output, variable intensity, and feature combinations that manual products cannot easily match. This segment also benefits from the growing importance of app links, stored user profiles, and connected wellness functions, especially in premium chairs and advanced targeted devices. In practical terms, electrical products set the performance benchmark across most of the massage equipment market. Their growth rate of 6.75% through 2031 also shows that they are not a mature side of the category, but the main engine of its future expansion.
Manual and non-electric products still accounted for 21.26% of the segment value in 2025, indicating they remain relevant rather than disappearing. They fit use cases where simplicity, portability, silent operation, and lower price matter more than automation. These products can also work well in markets where households hesitate to commit to more expensive motorized devices or where concerns about product reliability affect confidence. Even so, the gap between electric and manual solutions is likely to stay wide because user expectations in the massage equipment market continue to move toward convenience, customization, and stronger therapeutic feel. This means manual formats will remain present, but mostly as entry points, travel products, or specific-use tools rather than the center of future revenue growth.
By Technology: Smart and AI-Enabled Products Gain Speed Against a Larger Conventional Base
Conventional equipment accounted for 87.49% of the technology value in 2025, thereby remaining the dominant installed base in the massage equipment market. That leadership reflects years of wider distribution, lower average prices, and stronger familiarity across both residential and commercial channels. Many buyers still choose conventional products because they are easier to understand, easier to service, and more affordable at similar build quality levels. The massage equipment market, therefore, continues to rely on conventional devices for the majority of its current revenue. This installed base will remain important because replacement demand and first-time purchases in price-sensitive areas still favor simpler products.
Smart and AI-enabled equipment, however, is projected to grow at a 9.19% CAGR through 2031, making it the fastest-growing technology layer in the massage equipment market. The pull comes from personalization features such as body scanning, automated program selection, tension mapping, app control, and saved usage profiles that improve convenience and create a more premium feel. Panasonic’s 2025 launch in Japan highlighted how brands are pairing intelligence with compact design to make advanced products easier to place in urban homes rather than treating innovation as only a software issue. Over time, this will likely widen the gap between brands that can combine hardware quality with useful personalization and those that still compete mainly on mechanical features. That shift matters across the massage equipment industry because it raises switching costs and gives manufacturers more chances to build repeat engagement after the initial sale.
By End User: Commercial Buyers Lead While Residential Demand Broadens
Commercial end users accounted for 83.54% of the value in 2025, which made them the largest demand base in the massage equipment market. Spas, physiotherapy clinics, hotels, wellness resorts, fitness centers, and corporate wellness spaces favor larger systems with greater durability and deeper feature sets. Those buyers also tend to accept higher prices when the equipment improves service quality, supports positioning, or increases perceived customer value. That pattern helps keep average selling prices firm across the massage equipment market, even as residential buyers remain more price-sensitive. It also means supplier relationships, service support, and replacement cycles matter as much as product branding in this segment.
Residential buyers held 16.46% of the value in 2025, but this segment is forecast to grow at a 7.83% CAGR through 2031, faster than the commercial side. Work-from-home routines, growing comfort with home wellness spending, and more compact product formats are helping this shift. The line between segments is also becoming less fixed, as some employers now support home-office wellness spending, which can move residential-grade products into institutional budgets. That trend gives the massage equipment market a broader route into households without relying solely on direct discretionary purchases. It also supports more dual-use product design, where a device needs to feel suitable for home ownership but reliable enough for light shared or supervised use.
By Distribution Channel: Offline Retail Stays Larger While Online Retail Gains Ground
Offline retail held 73.25% of channel value in 2025, so physical shopping remained the main route into the massage equipment market. This pattern is strongest in massage chairs, where in-person testing still shapes conversion because buyers want to feel the pressure, movement, seat fit, and recline before making a large purchase. Experience centers, electronics stores, and specialty wellness outlets continue to matter because they reduce hesitation and give sales staff a chance to explain premium features. Offline presence also helps brands manage delivery planning, installation, and after-sales service more effectively. For large products, that still gives physical retail an advantage in the massage equipment market.
Online retail accounted for 26.75% of value in 2025, yet it is forecast to grow at a 8.64% CAGR through 2031, making it the fastest-growing channel. Better white-glove logistics, home assembly services, richer product videos, and stronger review systems are making consumers more willing to buy even expensive products online. Portable massagers, seat cushions, and targeted recovery devices already fit digital commerce well, and that digital familiarity is gradually helping larger products too. The massage equipment market is therefore seeing channel expansion rather than simple channel replacement, because online sales open incremental demand without removing the need for physical trial in premium categories. Over time, brands with strong digital merchandising and reliable service coordination are likely to gain share fastest in mid-priced and compact formats.
Geography Analysis
North America accounted for 36.93% of the global market value in 2025, maintaining its position as the center of the massage equipment market by revenue. The United States drives most of that position because it combines higher household spending power with strong acceptance of premium chairs, recovery systems, and app-linked wellness devices. Regional wellness spending also remains far ahead of other parts of the world, with North America recording USD 6,029 per person in 2024. That supports both residential demand and commercial installations across spas, physiotherapy clinics, sports recovery settings, and workplace wellness rooms. Canada adds depth through an expanding network of rehabilitation and sports therapy, while Mexico is gradually building demand in urban retail channels through more affordable, portable products.
Europe remains a major region in the massage equipment market, but its demand profile differs from that of North America, as clinical, spa, and professional use carry greater weight. Germany, the United Kingdom, France, and the Netherlands stand out for commercial installations, product quality expectations, and demand for devices that can sit comfortably in wellness and therapy environments. Product credibility matters strongly in this region, which tends to favor durable systems, clear safety positioning, and brands with a dependable service record. That creates an advantage for manufacturers that can support their products well after the sale and adapt formats to smaller living spaces. The region does not usually match North America in premium household penetration, but it remains important for stable commercial orders and for mid- to upper-tier products with strong design and reliability.
Asia-Pacific is forecast to grow at 7.56% CAGR through 2031, and this makes it the most important expansion zone in the massage equipment market over the forecast period. China, Japan, and South Korea bring scale, manufacturing strength, and established consumer awareness, while India, Indonesia, Thailand, Vietnam, and Singapore add rising urban demand. Panasonic’s late 2025 launch of the EP-MA110 in Japan showed how closely product strategy in the region responds to home space limits, since the chair was designed around standard apartment access and compact placement. South America and MEA remain smaller in current value, but countries such as Brazil, Saudi Arabia, the United Arab Emirates, and South Africa are important to the massage equipment market because growing wellness infrastructure and digital retail access can gradually turn awareness into broader household ownership.

Competitive Landscape
The massage equipment market remains fragmented, with competition shaped more by product range, channel mix, and brand positioning than by one company’s pricing power. Panasonic and OSIM remain prominent in premium categories, while OGAWA, Human Touch, Beurer, Casada, Medisana, and other established brands compete across a mix of full-body and targeted devices. At the same time, digitally oriented players such as RENPHO and Breo have shown that strong online execution can build meaningful positions in portable and lower-footprint formats. Therabody and Hyperice also influence the massage equipment market by pulling recovery-focused consumers toward performance and targeted muscle relief rather than traditional chair-based ownership. This widespread of specialists, premium brands, and digital-first players keeps the competitive field active across price bands and product types.
Strategy in the massage equipment market is becoming more varied as companies try to balance feature depth, physical footprint, and distribution reach. Panasonic’s December 2025 launch of the RealPro CasaLine EP-MA110 is a good example, since it paired AI-controlled pressure with a 68 cm width and a one-tatami-unit footprint aimed directly at Japanese home constraints. That kind of move shows that leading brands are not treating innovation only as a list of smart features, but also as a way to solve installation barriers that limit ownership. Digital-first competitors are taking a different path by using e-commerce, lightweight shipping, and targeted marketing to win buyers who prefer compact products and faster replacement cycles. In that sense, the massage equipment market is dividing into multiple competitive tracks, with premium full-body systems on one side and scalable digital products on the other.
Another important pattern is the growing link between commercial credibility and consumer sales in the massage equipment market. Brands that secure placement in spas, hotels, clinics, and wellness centers gain visibility, stronger product trust, and more chances to move into residential demand later. Regulatory progress can also shape competition, as the US FDA clearances for leg and hand massagers in 2025 show that manufacturers are pushing some product types closer to therapy-oriented use cases. This does not change the fragmented nature of the category, but it does give an edge to companies that can handle design, compliance, fulfillment, and service in a more organized way. As the massage equipment market grows, the strongest players are likely to be those that match clear use cases with dependable delivery, strong after-sales support, and a product range that fits both professional and home settings.
Massage Equipment Industry Leaders
Panasonic Holdings Corporation
OSIM International Pte. Ltd.
OGAWA Group / OGAWA World Berhad
Johnson Health Tech Co., Ltd.
HoMedics USA LLC
- *Disclaimer: Major Players sorted in no particular order

Recent Industry Developments
- March 2026: OSIM Malaysia introduced the uErgoh, described as the world's first ergonomic office chair with built-in massage technology, integrating V-Hand® rollers, Back-Stepping Ashiatsu massage, and PPG-based Body Tension Scoring connected via the OSIM Well-Being App.
- March 2026: HoMedics launched the Bridge Vibroacoustic Massage Cushion in the United Kingdom via Argos and Amazon at GBP 179.99 (approximately USD 228), adding vibroacoustic therapy, a modality previously confined to professional wellness settings, to its home portfolio. The launch extends the brand's footprint in the UK market and reflects a deliberate expansion into technology-adjacent home wellness formats.
- 2025: Panasonic launched the RealPro CasaLine EP-MA110 massage chair in Japan, designed for 68 cm width compatibility with standard apartment door frames and featuring AI-controlled precision pressure, nanoe™ X sterilization technology, and a 1-tatami-unit footprint, directly addressing the urban space constraint that has historically limited chair penetration in Japanese households.
- July 2025: Fujiiryoki launched the Cyber Relax Elite massage chair in the US market, featuring a 4D dual-robot massage system, SL-Track, 86 airbags, quad-heat zones, zero-gravity recline, and Bluetooth audio. The product established a new benchmark for ultra-premium home wellness equipment and reflected ongoing investment in the US as a flagship innovation market.


Global Massage Equipment Market Report Scope
Massage equipment refers to devices and tools designed to provide therapeutic massage, relaxation, muscle recovery, and pain relief through manual or automated mechanisms. The massage equipment market is segmented by product type, operation type, technology, end user, distribution channel, and geography. By product type, the market includes massage chairs and sofas, back massagers, neck and shoulder massagers, foot and leg massagers, head massagers, and other massage equipment. Based on operation type, the market is categorized into electric massage equipment and non-electric/manual massage equipment. By technology, the market is segmented into conventional equipment and smart/AI-enabled equipment. Based on end user, the market covers residential and commercial users. By distribution channel, the market is divided into online and offline retail. Geographically, the report covers North America, Europe, Asia-Pacific, South America, and the Middle East and Africa, with market sizes and forecasts for each region. For each segment, market sizing and forecasts have been conducted on a value basis (USD).
| Massage Chairs and Sofas |
| Back Massagers |
| Neck and Shoulder Massagers |
| Foot and Leg Massagers |
| Head Massagers |
| Others |
| Electric Massage Equipment |
| Non-electric/Manual Massage Equipment |
| Conventional Equipment |
| Smart/AI-enabled Equipment |
| Residential |
| Commercial |
| Online Retail |
| Offline Retail |
| North America | United States |
| Canada | |
| Mexico | |
| Rest of North America | |
| Europe | Germany |
| United Kingdom | |
| Italy | |
| France | |
| Spain | |
| Netherlands | |
| Poland | |
| Belgium | |
| Sweden | |
| Rest of Europe | |
| Asia-Pacific | China |
| India | |
| Japan | |
| South Korea | |
| Australia | |
| Indonesia | |
| Thailand | |
| Singapore | |
| Rest of Asia-Pacific | |
| South America | Brazil |
| Argentina | |
| Colombia | |
| Chile | |
| Peru | |
| Rest of South America | |
| Middle East and Africa | South Africa |
| Saudi Arabia | |
| United Arab Emirates | |
| Turkey | |
| Nigeria | |
| Egypt | |
| Morocco | |
| Rest of Middle East and Africa |
| By Product Type | Massage Chairs and Sofas | |
| Back Massagers | ||
| Neck and Shoulder Massagers | ||
| Foot and Leg Massagers | ||
| Head Massagers | ||
| Others | ||
| By Operation Type | Electric Massage Equipment | |
| Non-electric/Manual Massage Equipment | ||
| By Technology | Conventional Equipment | |
| Smart/AI-enabled Equipment | ||
| By End User | Residential | |
| Commercial | ||
| By Distribution Channel | Online Retail | |
| Offline Retail | ||
| By Geography | North America | United States |
| Canada | ||
| Mexico | ||
| Rest of North America | ||
| Europe | Germany | |
| United Kingdom | ||
| Italy | ||
| France | ||
| Spain | ||
| Netherlands | ||
| Poland | ||
| Belgium | ||
| Sweden | ||
| Rest of Europe | ||
| Asia-Pacific | China | |
| India | ||
| Japan | ||
| South Korea | ||
| Australia | ||
| Indonesia | ||
| Thailand | ||
| Singapore | ||
| Rest of Asia-Pacific | ||
| South America | Brazil | |
| Argentina | ||
| Colombia | ||
| Chile | ||
| Peru | ||
| Rest of South America | ||
| Middle East and Africa | South Africa | |
| Saudi Arabia | ||
| United Arab Emirates | ||
| Turkey | ||
| Nigeria | ||
| Egypt | ||
| Morocco | ||
| Rest of Middle East and Africa | ||


Key Questions Answered in the Report
What is the expected value of the massage equipment market by 2031?
The massage equipment market is forecast to reach USD 16.11 billion by 2031, rising from USD 11.79 billion in 2026 at a 6.43% CAGR over 2026 to 2031.
Which product category leads revenue in massage equipment?
Massage chairs led the category in 2025 with 39.55% of segment value, mainly because they carry higher average selling prices and stronger demand in commercial settings.
Which part of massage equipment is growing the fastest by technology?
Smart and AI-enabled equipment is expected to record the fastest growth, with a 9.19% CAGR through 2031, as personalization and connected features become more important.
Why is North America the largest regional contributor?
North America held 36.93% of global value in 2025 because of higher wellness spending, stronger commercial infrastructure, and better acceptance of premium recovery products.
Why is Asia-Pacific the fastest-growing region for massage equipment?
Asia-Pacific is projected to grow at 7.56% CAGR through 2031 due to aging populations, rising urban incomes, and a stronger cultural connection to massage and recovery practices.
Page last updated on:


