
Market Overview
| Study Period | 2021 - 2031 |
|---|---|
| Forecast Data Period | 2026 - 2031 |
| Base Year Market Size (2025) | USD 4.52 Billion |
| Market Size (2026) | USD 4.71 Billion |
| Market Size (2031) | USD 5.76 Billion |
| Growth Rate (2026 - 2031) | 4.12 % |
| Market Concentration | Medium |
Major Players *Disclaimer: Major Players sorted in no particular order Image © Mordor Intelligence. Reuse requires attribution under CC BY 4.0. | |

North America Home Fitness Equipment Market Analysis by Mordor Intelligence
The North America home fitness equipment market size was valued at USD 4.52 billion in 2025 and estimated to grow from USD 4.71 billion in 2026 to reach USD 5.76 billion by 2031, at a CAGR of 4.12% during the forecast period (2026-2031). While this growth rate appears steady, it masks a shift: Pandemic-driven demand spikes have normalized, but a core group of at-home exercisers now stabilizes consumption. The market is transitioning from traditional cardio equipment to connected platforms that monetize subscriptions alongside hardware. Peloton's Q3 fiscal 2025 results highlight this shift: Connected Fitness Products revenue dropped 27% year-over-year to USD 205.5 million, while subscription revenue remained strong at USD 418.5 million with a 67% gross margin, emphasizing the importance of retention economics over unit sales. In Q2 fiscal 2025, about 40% of Peloton's new subscribers came from the secondary market, as cost-conscious buyers opted for pre-owned equipment to access premium ecosystems. In 2024, treadmills held a 29.64% market share due to their versatility, but stationary cycles are expected to grow faster at 5.85% through 2030, driven by demand for compact, app-enabled bikes offering immersive content at lower price points. Smart and connected equipment, which accounted for 34.18% of the market in 2024, is forecast to grow at 6.18% annually, fueled by AI coaching features like iFIT's AI Coach beta, which curates workouts from over 10,000 sessions, and Tonal 2's Drop Sets algorithm, which adjusts resistance dynamically to enhance muscle growth. Online retail stores are projected to grow at 6.12%, outpacing offline retail's 4.42%, due to direct-to-consumer financing innovations. iFIT's December 2024 partnership with Flex allows customers to use Health Savings Accounts or Flexible Spending Accounts to purchase NordicTrack and ProForm equipment, unlocking USD 140 billion in tax-advantaged funds. Similarly, Tonal partnered with Truemed in November 2024, combining HSA/FSA eligibility with a USD 1,000 Black Friday discount to lower the entry price of its USD 4,295 system.
Key Report Takeaways
- By product type, treadmills led with a 29.12% revenue share in 2025, whereas stationary cycles are forecast to expand at a 5.62% CAGR through 2031.
- By category, conventional equipment held 65.10% of the North America home fitness equipment market share in 2025, while smart systems are set to grow at a 5.95% CAGR to 2031.
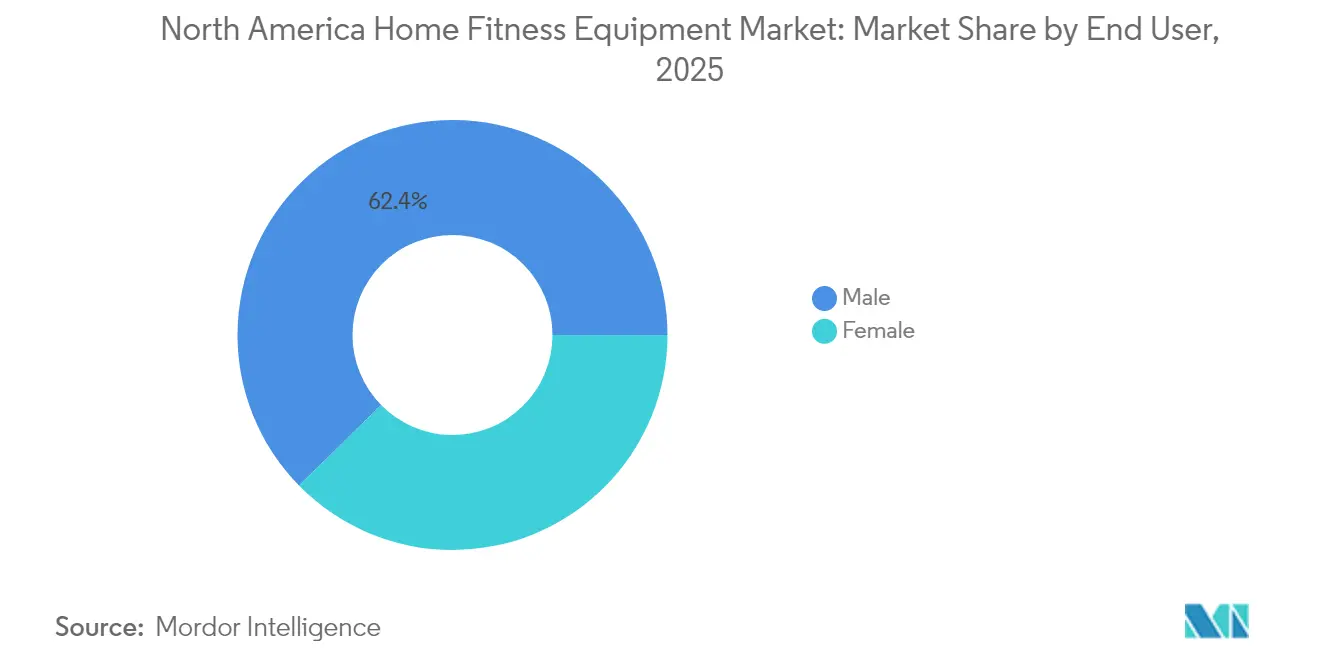
- By end user, male purchasers accounted for 62.35% of the North America home fitness equipment market size in 2025, but female demand is advancing at a 5.63% CAGR through 2031.
- By distribution channel, offline retail stores captured 56.80% of 2025 sales, yet online channels are projected to achieve a 5.88% CAGR to 2031.
- By geography, the United States represented 76.10% of 2025 demand, while Canada is projected to grow at a 6.21% CAGR during the outlook period.
Note: Market size and forecast figures in this report are generated using Mordor Intelligence’s proprietary estimation framework, updated with the latest available data and insights as of 2026.
North America Home Fitness Equipment Market Trends and Insights
Drivers Impact Analysis*
| Driver | (~) % Impact on CAGR Forecast | Geographic Relevance | Impact Timeline |
|---|---|---|---|
| Rising prevalence of lifestyle-related diseases | +0.8% | North America (United States (U.S.) and Canada core; Mexico emerging) | Long term (≥ 4 years) |
| Surge in adoption of connected/smart equipment | +1.2% | U.S. dominant; Canada and urban Mexico secondary | Medium term (2-4 years) |
| Convenience-first mindset post-COVID lockdowns | +0.6% | North America-wide, with higher persistence in the suburban U.S. | Short term (≤ 2 years) |
| Insurance reimbursement pilots for home fitness gear | +0.5% | U.S. (employer-sponsored and Medicare Advantage plans); limited Canada uptake | Medium term (2-4 years) |
| Multifamily property amenities race (on-site gyms) | +0.4% | U.S. metro areas (New York, Los Angeles, Dallas, Atlanta); select Canadian cities | Long term (≥ 4 years) |
| Government campaigns promoting active lifestyles | +0.3% | U.S. federal (CDC) and state programs; provincial initiatives in Canada | Long term (≥ 4 years) |
| Source: Mordor Intelligence | |||
Rising prevalence of lifestyle-related diseases
Chronic diseases are shifting fitness equipment from a luxury to a cornerstone of preventive health. From August 2021 to August 2023, the Centers for Disease Control and Prevention reported that 15.8% of U.S. adults had diabetes, 11.3% diagnosed and 4.5% undiagnosed[1]Source: Centers for Disease Control and Prevention, “Physical Activity Facts,” cdc.gov. Additionally, 28.7% had two or more cardiovascular risk factors, with diabetes prevalence soaring to 24.2% among obese adults. Physical inactivity, a contributor to 1 in 10 premature deaths, racks up USD 117 billion in annual healthcare costs. This has led payers and employers to experiment with reimbursement programs that subsidize home fitness equipment. The CDC's Active People, Healthy Nation initiative aims to boost physical activity in 27 million Americans by 2027. Yet, only 1 in 4 adults currently meet the combined aerobic and muscle-strengthening guidelines, and fewer than 30% hit the muscle-strengthening benchmarks alone. This disparity is driving a surge in demand for strength-focused workouts. Peloton highlighted this trend, noting over 2 million members engaged in strength workouts in Q2 fiscal 2025. Strength sessions now account for 75% of their cycling workout counts. Furthermore, Peloton's Strength+ app garnered over 220,000 monthly active users just weeks after its December 2024 debut. As urban dwellers seek muscle-strengthening solutions, adjustable dumbbells and compact resistance systems are reaping the benefits.
Surge in adoption of connected/smart equipment
For equipment priced above USD 1,000, connectivity has shifted from a luxury feature to a fundamental expectation. In its 2026 fitness trends survey, the American College of Sports Medicine ranked wearable technology first, mobile exercise apps fourth, and data-driven technology eighth[2]Source: American College of Sports Medicine, “Worldwide Survey of Fitness Trends for 2026,” acsm.org . Adult wearable ownership ranges between 36% to 44%, and fitness app users are projected to exceed 345 million in 2024. Manufacturers are integrating artificial intelligence with connectivity to offer personalized coaching at scale. In September 2024, iFIT introduced over 40 smart models, including the X24 Treadmill with a 40% incline and the X24 Bike with incline and decline capabilities. All models run on a revamped iFIT OS and a beta AI Coach, which curates workouts from over 10,000 sessions, communicates via text, and auto-schedules routines on connected machines. In March 2025, Tonal 2 raised the digital weight limit to 250 pounds and introduced ‘Drop Sets,’ an algorithm designed to accelerate muscle growth by reducing resistance mid-set, along with 'Smart View,' a real-time movement analysis tool offering form correction cues. These AI-driven features generate unique training datasets. Tonal members have collectively lifted 200 billion pounds over 5 billion reps and 35 million sessions, with the platform capturing 50 data points per second per repetition to refine weight-mapping algorithms. Strategically, while hardware margins are improving, evidenced by Peloton's Connected Fitness Products gross margin rising from negative in fiscal 2023 to 14.3% in Q3 fiscal 2025, the focus remains on subscription revenue, which delivers gross margins of 67% to 69%.
Convenience-first mindset post-COVID lockdowns
Suburban households, having invested in dedicated workout spaces, have solidified their pandemic-era fitness habits into lasting preferences. Surveys from the ACSM highlight a sustained shift towards hybrid fitness models, merging in-person and virtual sessions. This trend is underscored by Peloton's Q3 fiscal 2025 report, showcasing 2.88 million Paid Connected Fitness Subscriptions. While this marks a slight dip from 2.98 million at the close of fiscal 2024, it's buoyed by a steady 1.4% average monthly churn rate. Peloton's treadmill segment is also reaping the benefits of this fitness evolution, boasting a 42% year-over-year revenue surge in Q4 fiscal 2024. Management insights reveal the treadmill market's potential, being roughly double that of stationary bikes, with the premium Tread+ exceeding initial demand forecasts. Echelon is tapping into this trend, unveiling its gamified racing platform in June 2024. This platform introduces real-time competition, auto-adjusting resistance based on terrain for bikes and rowers, with future support for Stride treadmills and Android compatibility. Multifamily developers are taking note, embedding fitness amenities into their projects. A 2024 survey by the National Multifamily Housing Council and Grace Hill, encompassing 172,703 renters, revealed that nearly 75% prioritize fitness centers, about 20% deem them essential for renting, and of those valuing these centers, nearly 75% desire on-site instructor-led classes.
Insurance reimbursement pilots for home fitness gear
Tax-advantaged health accounts are quietly subsidizing premium equipment, slashing effective prices by as much as 30% and broadening markets beyond just affluent early adopters. Independence Blue Cross chips in USD 150 annually for fitness equipment, Anthem ups the ante with USD 400 per year, and the State of New Hampshire designates USD 200 annually for qualifying gear. In December 2024, iFIT teamed up with Flex, allowing NordicTrack and ProForm customers to tap into HSA or FSA funds for equipment. A licensed medical provider can issue a Letter of Medical Necessity after a quick two-minute eligibility check. Following suit in November 2024, Tonal collaborated with Truemed, combining HSA/FSA eligibility with promotional discounts to bring down the net cost of their USD 4,295 system. These initiatives are positioning strength training and cardio equipment as preventive-care tools, eligible for pre-tax reimbursement. This approach aligns well with Medicare Advantage plans that are testing fitness benefits for seniors. The strategy offers a dual advantage: manufacturers can tap into price-sensitive customers, and payers might see savings if regular equipment use curbs chronic disease progression and related claims.
Restraints Impact Analysis*
| Restraint | (~) % Impact on CAGR Forecast | Geographic Relevance | Impact Timeline |
|---|---|---|---|
| High upfront cost of premium smart equipment | -0.9% | U.S. and Canada; urban Mexico for the luxury segment | Medium term (2-4 years) |
| Re-opening and membership rebound of commercial gyms | -0.6% | U.S. metro areas, Canadian cities, and limited Mexico impact | Short term (≤ 2 years) |
| Expanding second-hand equipment marketplace | -0.5% | U.S. dominant; emerging in Canada | Medium term (2-4 years) |
| Tariff-driven steel and electronics price volatility | -0.7% | North America-wide (U.S. manufacturing and imports; Canada via supply-chain pass-through) | Short term (≤ 2 years) |
| Source: Mordor Intelligence | |||
High upfront cost of premium smart equipment
Price remains the primary barrier to mass-market penetration of connected systems. Tonal 2 retails at USD 4,295, and Peloton's Tread and Row command similar price points, placing them beyond reach for median-income households absent financing or reimbursement. Peloton's fiscal 2025 results reveal the trade-offs: the company shifted product mix toward higher-margin Tread/Tread+ and refurbished Bike units to improve hardware gross margin from negative in fiscal 2023 to 14.3% in Q3 fiscal 2025, but Connected Fitness Products revenue fell 27% year-over-year to USD 205.5 million as unit volumes contracted. To address affordability, Peloton introduced a USD 95 (USD) / CAD 125 (Canada) used-equipment activation fee in 2024, enabling secondary-market buyers to access the subscription platform; these activations represented roughly 40% of gross subscriber additions in Q2 fiscal 2025. NordicTrack countered with 0% APR financing for 12 or 39 months via TD Bank, and iFIT's partnership with Flex allows customers to finance purchases using pre-tax HSA/FSA funds, effectively reducing the net cost by up to 30%. Despite these innovations, the premium segment's growth is capped by the reality that conventional treadmills and stationary bikes priced below USD 1,000 still command 65.82% of the category in 2024, underscoring that affordability trumps connectivity for the majority of buyers.
Re-opening and membership rebound of commercial gyms
Urban renters and younger demographics, who prioritize social interaction and a variety of equipment, are increasingly returning to in-person fitness, pulling back from home workouts. While gym membership data for 2024-2025 is still emerging, Peloton's data offers insights: the company saw a 1.4% average monthly subscriber churn in Q2 fiscal 2025. Furthermore, Peloton's shift towards partnerships with hospitality giants, like Hyatt's 800-plus properties and Hilton's 2,400 Connected Rooms, underscores a trend: to keep users engaged, fitness equipment needs to be integrated into commercial spaces where people naturally congregate. Reflecting this trend, multifamily properties are proactively installing on-site fitness centers. Data shows that about 90% of apartment communities built in the last decade now boast fitness amenities. Moreover, nearly 75% of renters who appreciate these centers express a desire for instructor-led classes. This preference leans towards compact, tech-savvy equipment rather than traditional bulky machines, as highlighted by the National Maritime Heritage Complex. The takeaway for home-equipment manufacturers is clear: they are not just up against commercial gyms but also the rising trend of fitness amenities in residential buildings, hotels, and corporate campuses. These spaces offer the allure of convenience without the need for consumers to dedicate home space or financial investment.
*Our forecasts treat driver/restraint impacts as directional, not additive. The impact forecasts reflect baseline growth, mix effects, and variable interactions.
Segment Analysis
By Product Type: Treadmills Lead, Cycles Accelerate
iFIT will launch its NordicTrack Ultra 1 luxury treadmill in March 2025. Featuring white oak and metal V-shaped uprights, eight strategically placed fans for full-body cooling, and a Stability Engine design for quiet operation, this treadmill reflects the shift from utilitarian cardio tools to statement furniture for living spaces. In 2025, treadmills held a 29.12% market share, highlighting their versatility for walk-jog-run routines and appeal to multi-generational households. Peloton noted that the treadmill market is about twice the size of the stationary-bike market. In Q4 fiscal 2024, Peloton's Tread revenue grew 42% year-over-year, driven by higher-than-expected demand for the premium Tread+. However, stationary cycles are projected to grow fastest at 5.62% through 2031, due to compact designs, affordability, and engaging content ecosystems. Echelon's Worlds, a gamified racing platform launched in June 2024, offers real-time competition with auto-adjusting resistance tied to terrain, appealing to budget-conscious consumers seeking engagement without the USD 4,000-plus price tag.
Strength training equipment, including adjustable dumbbells in North America and resistance systems, is gaining traction as routines shift toward muscle strengthening. In Q2 fiscal 2025, over 2 million Peloton members completed strength workouts, with strength sessions reaching 75% of cycling counts. Peloton's Strength+ app, launched in December 2024, quickly attracted over 220,000 monthly active users. In March 2025, Tonal 2 raised the digital weight limit to 250 pounds and introduced Drop Sets, an algorithm claiming to double muscle hypertrophy speed, and Smart View for real-time movement analysis. Rowing machines cater to a niche but loyal audience, with Hydrow and Echelon offering water-resistance and gamified experiences. Elliptical machines and other types, like stair climbers and multi-function trainers, face challenges as consumers prioritize space efficiency and connected experiences. The Consumer Product Safety Commission ensures safety standards for home fitness equipment, but incidents like Peloton's Tread+ recall due to injury reports underscore the reputational and financial risks of design flaws.




By Category: Smart Equipment Gains, Conventional Holds Mass Market
In 2025, conventional equipment held a 65.10% market share, highlighting its price sensitivity and mechanical simplicity. Budget-friendly treadmills, stationary bikes, and free weights under USD 1,000 cater to median-income households and avoid recurring subscription fees, reducing churn risks. Meanwhile, Smart/Connected Equipment, with a 34.90% share in 2025, is projected to grow at 5.95% annually through 2031, driven by features like AI coaching and personalized programming. In September 2024, iFIT launched over 40 smart models with a revamped iFIT OS. Its beta AI Coach curates workouts from a library of 10,000+ sessions, communicates via text, and auto-schedules routines on connected devices. Tonal 2 uses a proprietary dataset of 200 billion pounds lifted over 5 billion reps in 35 million sessions. With 50 data points captured per second per rep, its weight-mapping algorithms predict optimal resistance and provide real-time coaching feedback.
The strategic divide is clear: traditional manufacturers focus on cost and distribution, while connected players rely on recurring subscriptions with gross margins of 67%-69%, far exceeding hardware profits. Peloton’s hardware gross margin improved from negative in fiscal 2023 to 14.3% in Q3 fiscal 2025, driven by a shift to higher-margin Tread/Tread+ and refurbished units, along with lower warehousing and transport costs. However, secondary-market activations, which accounted for 40% of Peloton’s gross subscriber additions in Q2 fiscal 2025, risk cannibalizing new hardware sales, reducing unit volumes even as subscription revenues stabilize. Conventional equipment faces commoditization pressures as platforms like Facebook Marketplace and OfferUp enable peer-to-peer resales, eroding demand for new units.
By End User: Female Segment Accelerates
In 2025, male end-users held a 62.35% share, reflecting their historical preference for strength training and higher spending on premium equipment. Female end-users, representing 37.65%, are projected to grow at 5.63% annually through 2031, outpacing the male segment's 4.02%. This growth is driven by brands tailoring content and compact equipment to meet underserved female preferences. Peloton's Q2 fiscal 2025 data highlights this trend: over 2 million members completed strength sessions, with strength workouts now 75% of cycling counts, signaling increased adoption of resistance training by women. The CDC's Moving Matters campaign targets Black and Hispanic women aged 18 to 44 to address activity gaps linked to cardiovascular and metabolic diseases. Compact equipment like Tonal 2's wall-mounted design and NordicTrack Ultra 1's refined finishes appeal to female buyers seeking functional fitness tools that integrate seamlessly into living spaces.
Adjustable dumbbells and resistance bands are gaining popularity as versatile, space-efficient tools supporting progressive overload without requiring dedicated rooms. Multifamily developers are responding: a 2024 National Multifamily Housing Council survey found nearly 75% of fitness-valuing renters prefer instructor-led classes, and over 20% express interest in pickleball, indicating demand for diverse fitness options. A strategic opportunity lies in bundling compact strength equipment with app-based coaching for personalized programming. iFIT's Workout Creator allows members to build personal workout libraries, while Tonal's upcoming AI-driven TONi assistant will customize routines using its proprietary dataset. While male buyers still drive demand for high-weight-capacity systems and multi-station home gyms, the female segment's faster growth suggests brands prioritizing accessibility, aesthetics, and community-driven content will gain a competitive edge.
By Distribution Channel: Online Gains, Offline Adapts
In 2025, offline retail stores held a 56.80% market share, driven by big-box sporting goods chains, specialty fitness retailers, and mass merchants offering tactile product trials and immediate fulfillment. Peloton's partnership with Costco, spanning around 300 U.S. locations, made the Bike+ a leading third-party seller, showcasing how wholesale distribution can boost volume without affecting direct sales. However, while offline retail is projected to grow at 4.02% annually through 2031, online retail is expected to grow faster at 5.88%, driven by direct-to-consumer financing innovations and the elimination of showroom overheads. In December 2024, iFIT partnered with Flex, enabling customers to purchase NordicTrack and ProForm equipment using HSA or FSA pre-tax funds, tapping into USD 140 billion in tax-advantaged balances and offering up to 30% savings. Similarly, Tonal's November 2024 partnership with Truemed provides HSA/FSA eligibility for its USD 4,295 system, paired with promotional discounts to lower costs.
Peloton is reshaping its retail strategy by closing owned showrooms to reduce fixed costs. This restructuring, which cut 15% of its workforce (around 400 roles), aims to achieve over USD 200 million in annual expense reductions by fiscal 2025. Concurrently, Peloton is expanding third-party partnerships with Costco, Amazon (selling Tread and Row), and hospitality chains like Hyatt's 800-plus properties and Hilton's 2,400 Connected Rooms. In Q3 fiscal 2025, NordicTrack's microstore in Nashville outperformed the average North American retail location, indicating that compact, high-traffic formats may offer better economics than traditional showrooms. Online channels benefit from lower customer-acquisition costs, flexible pricing, and financing options at checkout. For example, NordicTrack offers 0% APR financing for 12 or 39 months via TD Bank, and promotional bundles, such as a USD 100 discount with a multi-year iFIT Pro Membership, increase average order values. Strategically, offline retail will remain relevant for trial-driven purchases and impulse buys, but online channels are set to capture most incremental growth as brands optimize digital conversion funnels and integrate financial services.
Geography Analysis
In 2025, the United States held a commanding 76.10% share of the North America home fitness equipment market. This dominance stems from high disposable incomes, expansive suburban housing that accommodates workout spaces, and a mature ecosystem of connected-fitness platforms. Peloton's fiscal 2024 revenue highlights this concentration, with North America contributing USD 2.487 billion (92% of total revenue) and the U.S. alone accounting for USD 2.389 billion (88%). Initiatives like the CDC's "Active People, Healthy Nation," aiming to engage 27 million more Americans by 2027, and employer-sponsored insurance reimbursement pilots (e.g., Independence Blue Cross's USD 150, Anthem's USD 400, and the State of New Hampshire's USD 200) are driving demand by positioning fitness equipment as preventive-care infrastructure eligible for subsidies. However, Section 301 tariffs, 25% on steel and aluminum in 2024, 50% on semiconductors and electronics in 2025, and 25% on permanent magnets in 2026, are pressuring hardware margins. Manufacturers face the choice of absorbing these costs or passing them on to consumers, with Peloton estimating a USD 5 million tariff impact in Q4 fiscal 2025, as noted by the U.S. Trade Representative.
Canada is projected to grow at an annual rate of 6.21% through 2031, making it the fastest-growing market in the region. This growth is driven by Peloton's CAD 125 activation fee for used equipment, which expands its reach beyond affluent early adopters, and Costco's wholesale distribution model, which lowers barriers to entry. Provincial health initiatives and the increasing prevalence of multifamily fitness amenities in cities like Toronto, Vancouver, and Montreal are sustaining demand. Additionally, Health Canada's stringent oversight ensures compliance with safety standards, further supporting market growth. In contrast, Mexico and the rest of North America remain in the early stages of market development, with limited data on specific dynamics. Speediance, a smart home-gym manufacturer, operates showrooms in Mexico City and Monterrey, pricing its flagship system at MXN 79,900 (approximately USD 4,000) to target affluent urban households.
In Mexico, strategic opportunities lie in compact, affordable equipment designed for smaller living spaces and supported by local installment financing. However, growth is constrained by tariff pass-through costs from U.S. manufacturing and a limited insurance reimbursement infrastructure. Regulatory frameworks, including the CPSC in the U.S., Health Canada, and Mexico's COFEPRIS, enforce baseline safety standards across the region. Nonetheless, voluntary recalls, such as Peloton's Tread+ recall, underscore the reputational and financial risks associated with design flaws. These challenges highlight the importance of maintaining rigorous safety and quality standards to mitigate potential setbacks in the market.
Regulatory Landscape
In North America, home fitness equipment is primarily governed by consumer product safety requirements and voluntary consensus standards. In the United States, the Consumer Product Safety Commission (CPSC) provides baseline enforcement, while manufacturers commonly design to ASTM standards such as ASTM F2276-23 (fitness equipment for ages 12+) and ASTM F2216-17a(2025) (selectorized strength equipment). For connected equipment, compliance also extends to wireless and electronic requirements, including FCC equipment authorization processes for devices with radio modules.
Trade and product-policy changes continue to affect landed costs and compliance planning. As of April 2026, certain exercise equipment classifications (including HTS 9506.91.00) were removed from Section 232 steel and aluminum derivative tariff coverage under Annex II updates, easing a prior cost pressure point for import-heavy categories. In Canada, Health Canada oversight under the Canada Consumer Product Safety Act (CCPSA) remains central, and its 2026-2028 Forward Regulatory Plan outlines proposed amendments to multiple CCPSA-linked regulations to modernize safety requirements. Health Canada also updated CCPSA General Prohibition guidance in 2026 to reference ASTM F2057-23 for stability requirements in consumer products, reinforcing the role of ASTM alignment in cross-border compliance.
Competitive Landscape
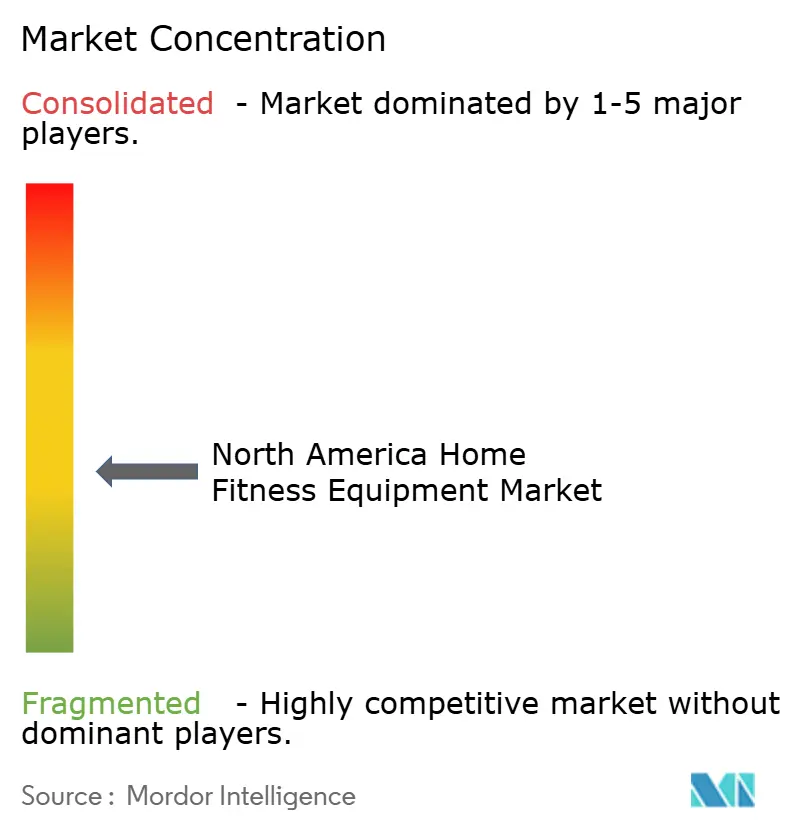
The North America home fitness equipment market is moderately fragmented, with brands like Peloton, iFIT (including NordicTrack and ProForm), Nautilus (known for Bowflex and Schwinn), and Tonal holding significant brand recognition but no single player dominating. As pandemic-driven demand normalized, competitive pressures increased, leading to restructuring among weaker players. Nautilus, for example, filed for bankruptcy in March 2024 and was acquired by Johnson Health Tech in April 2024 for USD 37.5 million. By May 2024, Johnson discontinued the Nautilus brand to focus on Bowflex and Schwinn. Meanwhile, stronger players are capitalizing on the shakeout. iFIT raised USD 200 million in January 2025 to accelerate product development, expand internationally, and explore mergers and acquisitions, signaling an opportunity to capture market share left by struggling competitors. Strategies in the market are diverging, with hardware-focused players competing on cost and distribution, while subscription-based platforms emphasize recurring revenue. Peloton, for instance, maintained steady subscription revenue of USD 418.5 million per quarter with gross margins of 67% to 69%, despite a 27% year-over-year decline in Connected Fitness Products revenue.
White-space opportunities in the market include commercial-grade equipment for multifamily properties, as nearly 75% of renters value fitness centers, and approximately 90% of new apartment communities include them. Hospitality partnerships, such as Peloton's collaborations with Hyatt and Hilton, also present growth potential. Additionally, HSA/FSA-eligible strength-training systems targeting chronic disease prevention offer another avenue for expansion. Emerging disruptors like Tonal are leveraging proprietary datasets, 200 billion pounds lifted, 5 billion reps, and 35 million sessions, to train AI algorithms that deliver personalized coaching at scale, creating a competitive advantage that hardware-only manufacturers cannot replicate.
Technology remains the primary battleground in the market. iFIT's AI Coach beta auto-schedules workouts from a library of over 10,000 sessions, while Tonal 2's Drop Sets algorithm claims to double the speed of muscle hypertrophy. Echelon's Worlds platform gamifies racing, offering real-time competition with terrain-linked resistance. The Consumer Product Safety Commission ensures baseline safety compliance, but voluntary recalls highlight the reputational risks manufacturers face. As the market evolves, players are increasingly relying on innovation and technology to differentiate themselves and capture market share.
North America Home Fitness Equipment Industry Leaders
Nautilus Inc.
Technogym SpA
Peloton Interactive, Inc.
Johnson Health Tech. Co. Ltd
ICON Health & Fitness INC.
- *Disclaimer: Major Players sorted in no particular order

Market Opportunities and Future Outlook
Monetization is shifting toward business models that pair hardware with recurring software and services, which creates room for growth around content libraries, coaching algorithms, financing, and reimbursement pathways. Demand for premium categories is also tied to the ability to purchase through HSA/FSA-enabled channels, supported by iFITs partnership with Flex (December 2024) for NordicTrack and ProForm and Tonals partnership with Truemed (November 2024), both of which broaden the addressable customer base by enabling pre-tax funding mechanics for eligible purchases.
Whitespace is also forming in AI-enabled, space-efficient strength systems and adjacent modalities. In July 2026, AEKE raised over USD 5.86 million via Kickstarter for its AEKE S1 Pro, signaling consumer interest in compact, AI-driven home gyms. Consolidation and category build-outs in connected modalities are also emerging, including Interactive Strength Inc. (TRNR) signing a definitive agreement in July 2026 to acquire STEPR and add connected stair climbing into its portfolio. At the same time, connected players are operating in a more complex compliance environment tied to consumer protection and digital practices, with the Health and Fitness Association noting that in 2025, more than 160 fitness-relevant bills were considered at the US state level and 21 were enacted, raising the bar for subscription, auto-renewal, and data practices.
Recent Industry Developments
- June 2026: Peloton acquired Skop, a Pilates-focused startup, to integrate its technology into the Peloton platform. The deal broadens Pelotons modality coverage beyond cycling and running into low-impact training that overlaps with rehabilitation and longevity use cases.
- April 2026: Peloton announced a global partnership with Spotify to integrate Peloton fitness content into Spotifys new fitness category for Premium subscribers. This extends Pelotons content distribution beyond owned apps and hardware, supporting reach and engagement even when hardware sales fluctuate.
- March 2026: Peloton announced the Peloton Commercial Series, bringing Precor industrial-grade engineering together with Peloton content for high-traffic gym environments. The move deepens Pelotons push into commercial channels that can complement home usage and diversify demand beyond direct-to-consumer equipment cycles.


Research Methodology Framework and Report Scope
Market Definition and Coverage
For this study, the North America home fitness equipment market covers consumer purchases of exercise equipment intended for use inside the home, captured as market value across the region.
Scope exclusions: Excluded from this scope are gym-only machines, wellness services, and recurring digital subscriptions that may be bundled with connected equipment.
Segmentation Overview
- Product Type
- Treadmills
- Elliptical Machines
- Stationary Cycles
- Rowing Machines
- Strength Training Equipment
- Other Product Types
- Category
- Conventional
- Smart/Connected Equipment
- End User
- Male
- Female
- Distribution Channel
- Offline Retail Stores
- Online Retail Stores
- Geography
- United States
- Canada
- Mexico
- Rest of North America
Data Sources, Market Sizing, and Validation
Desk Research
To start, we framed the demand pool using public data that signals how many households are likely to buy and replace home exercise equipment across North America. References included sources such as the US Census Bureau, Statistics Canada, the US Bureau of Economic Analysis, and the Bureau of Labor Statistics for income, spending, and household indicators.
We also checked sport and fitness participation and safety signals using sources such as CDC physical activity statistics, national health surveys, and peer reviewed studies that quantify at home workout behavior. Trade and supply signals were reviewed using sources such as USITC DataWeb and UN Comtrade, followed by company filings, investor presentations, and reputable press to map pricing ranges and product mix. Where needed, we used paid subscriptions for company financials and intelligence, patent lookups, and shipment level import export checks. These examples are not exhaustive, and other sources were used to collect data, validate assumptions, and clarify open questions.
Primary Interviews and Surveys
Next, we validated the model with interviews and short surveys with manufacturers, distributors, retailers, and specialist service partners that support installation and maintenance. We also spoke with category managers and channel leaders across the United States and Canada, with selective checks for Mexico, to confirm what is counted as home use, how promotions move average selling prices, and how online versus store sales splits are changing.
Distribution of primary research fieldwork respondents
| Company type | Respondent position |
|---|---|
| Top tier: 31% | CXOs: 14% |
| Mid tier: 52% | Functional/Unit leaders: 28% |
| Smaller Players: 17% | Managers: 58% |
Market-Sizing & Forecasting
Sizing starts from a top-down build where household counts and fitness participation signals are converted into a buyer pool, and then translated into annual equipment demand using replacement cycles and adoption rates by product class. That demand is then valued using observed average selling price bands from public pricing checks and channel inputs, with adjustments for promotion intensity and mix shifts over time.
To keep the numbers realistic, we corroborated totals with selective bottom-up approximations, including sampled SKU pricing paired with estimated unit volumes, channel checks on online versus offline share, and a sanity check using import trends for key equipment categories. Where company revenues include broader product lines, gaps were handled by applying home-use exposure shares informed by interviews and product catalogs, followed by a second pass to avoid double counting across bundled offerings.
For forecasting, we primarily used scenario analysis because the category depends on consumer discretionary spend and housing related behavior. The forward view was shaped using inputs such as real disposable income trends, price discounting patterns, freight cost direction that affects landed prices, replacement cycle normalization after peak years, and connected feature uptake that can lift average selling prices for certain products.
Data Validation & Update Cycle
Model outputs are checked against independent signals, including trade flows, consumer spending direction, and retailer assortment changes that are visible in public channels. If a variance looks too large, we re-check assumptions like adoption rates and price bands, then re-contact a few respondents to confirm what changed and when.
Before sign-off, the work is reviewed in multiple steps so calculation logic, units, and currency timing are consistent across the full time series. Reports are refreshed annually, and interim updates are made when major events materially affect demand or pricing. Right before delivery, we do a fresh pass so clients receive the latest updated view.
Mordor Intelligence's North America Home Fitness Equipment Market Estimate Compared With Other Published Estimates
Published numbers for this market can differ widely because the product basket and the value components are not always treated the same way, and the year used for currency and pricing can also shift results. In our checks, the biggest swings usually come from what gets counted as equipment versus adjacent offerings, followed by how pricing is averaged across premium and entry products.
Digital coaching subscriptions and paid workout content sit outside Mordor Intelligence's scope here, which removes a fast growing revenue stream that some publications fold into the same total. Differences also show up when one estimate uses aggressive post-pandemic adoption assumptions, or when average selling prices are projected without validating promotional intensity and mix changes across online and store channels.
Benchmark comparison
| Source | Market Size | Gaps in Research Methodology |
|---|---|---|
| Mordor Intelligence | USD 4.52 B (2025) | |
| Trade Publisher A | USD 5.10 B (2024) | Uses a different base year and appears to include connected ecosystem revenue add-ons, which can lift value even if equipment unit demand is similar. |
| Industry Portal B | USD 6.93 B (2024) | Covers a broader fitness equipment definition that likely includes non-home placements, which expands the addressable value beyond residential-only demand. |
Taken together, the spread is mainly explained by whether non-equipment revenue and non-home placements are included, and by base-year timing for prices and currency. By tying the total to clear household demand indicators, replacement behavior, and price-band checks that can be repeated, the final number stays easier to audit and update.


Key Questions Answered in the Report
How large is the North American home gym equipment market today?
The market stands at USD 4.71 billion in 2026 and is projected to reach USD 5.76 billion by 2031.
Which product category is growing the fastest?
Smart or connected equipment is forecast to expand at a 5.95% CAGR through 2031, outpacing conventional items.
What is driving female participation in home workouts?
Tailored strength content, compact, stylish equipment, and public health campaigns are pushing female demand up at a 5.63% CAGR.
How are tariffs affecting equipment prices?
Section 301 duties on steel, electronics, and magnets are squeezing hardware margins, with Peloton alone expecting a USD 5 million impact in Q4 FY 2025.
Can consumers use HSA or FSA funds to buy equipment?
Yes, recent partnerships with Flex and Truemed allow HSA/FSA payments on select NordicTrack and Tonal products, cutting effective prices by up to 30%.
Which country in North America will grow the fastest?
Canada is expected to lead regional growth at a 6.21% CAGR through 2031, aided by used-equipment activation programs and expanding retail partnerships.
Page last updated on:


 Your data is secure and never sold or shared.


