
Market Overview
| Study Period | 2021 - 2031 |
|---|---|
| Market Size (2026) | USD 11.84 Billion |
| Market Size (2031) | USD 17.06 Billion |
| Growth Rate (2026 - 2031) | 7.59 % |
| Fastest Growing Market | Asia Pacific |
| Largest Market | North America |
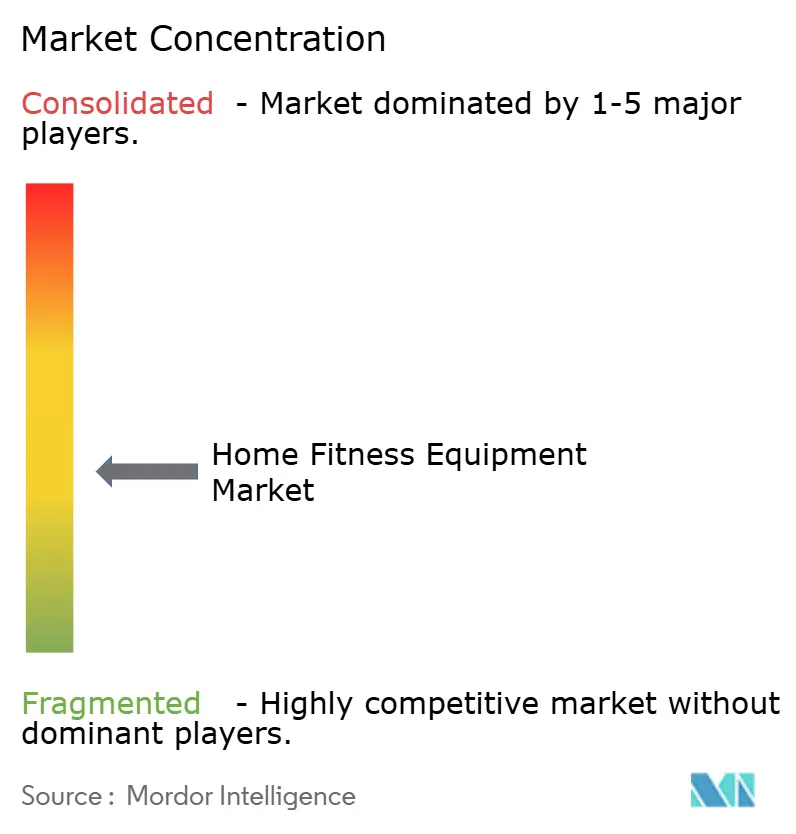
| Market Concentration | Medium |
Major Players
*Disclaimer: Major Players sorted in no particular order Image © Mordor Intelligence. Reuse requires attribution under CC BY 4.0. |
|
Home Fitness Equipment Market Analysis by Mordor Intelligence
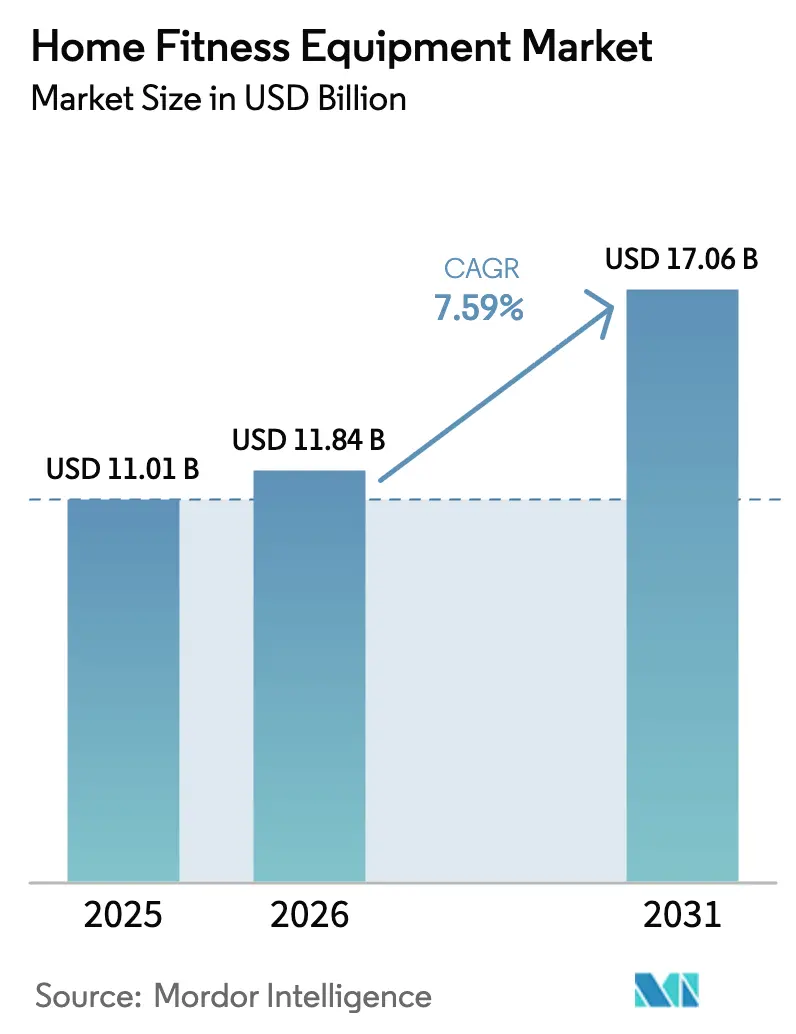
The home fitness equipment market size was valued at USD 11.01 billion in 2025 and estimated to grow from USD 11.84 billion in 2026 to reach USD 17.06 billion by 2031, at a CAGR of 7.59% during the forecast period (2026-2031). This trajectory reflects a structural recalibration in how consumers allocate wellness spending, driven less by pandemic-induced panic buying and more by sustained behavioral shifts toward hybrid fitness routines that blend home convenience with performance-grade equipment. The World Health Organization reported in 2024 that 2.5 billion adults globally were overweight, with physical inactivity rising in the recent years, creating a persistent demand tailwind for accessible home-based solutions. Rising obesity rates, longer working hours, and growing acceptance of hybrid exercise routines continue to create a durable demand baseline. The market also benefits from the introduction of compact, foldable machines that address space constraints in urban apartments and from governmental campaigns that frame physical activity as a public-health obligation. Intensifying competition is steering brands toward value-added services, subscription-free smart features, financing options, and modular designs that expand with a user’s fitness journey, rather than pure price wars.
Key Report Takeaways
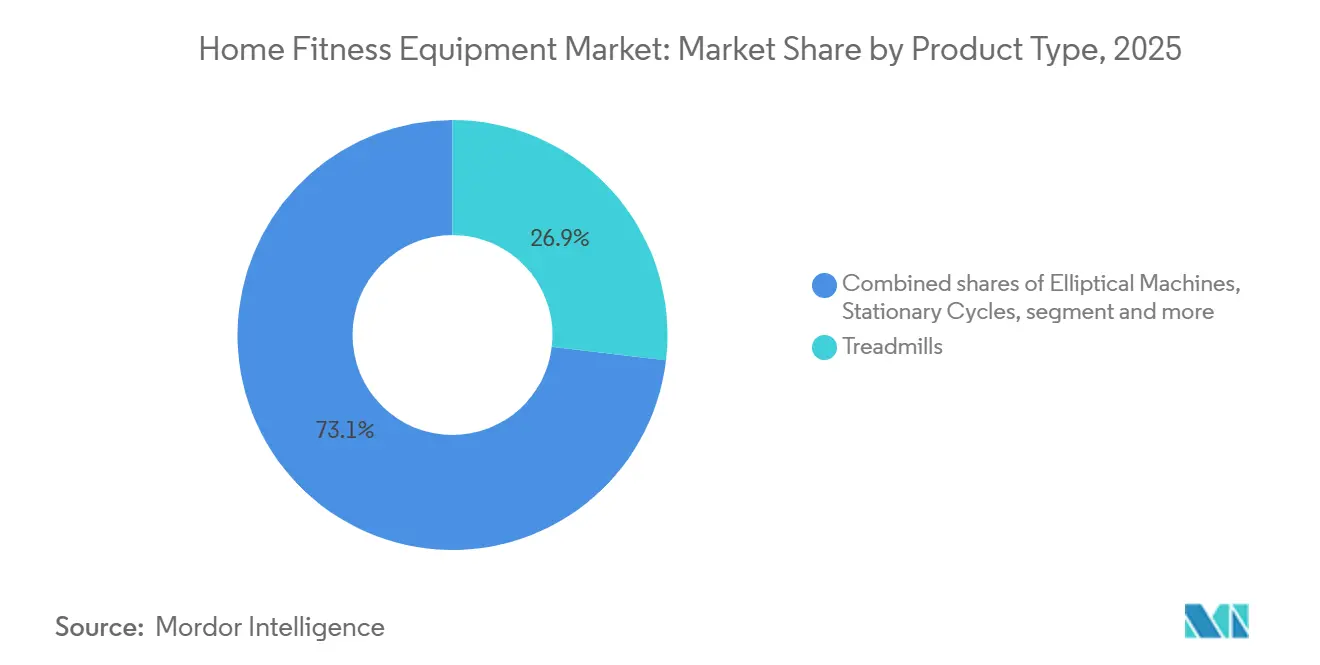
- By product type, treadmills led with 26.87% of the home fitness equipment market share in 2025, and stationary cycles posted the fastest growth at 7.85% CAGR through 2031.
- By category, conventional equipment held 68.18% of the home fitness equipment market size in 2025, while smart equipment posts the fastest growth at 9.61% CAGR through 2031.
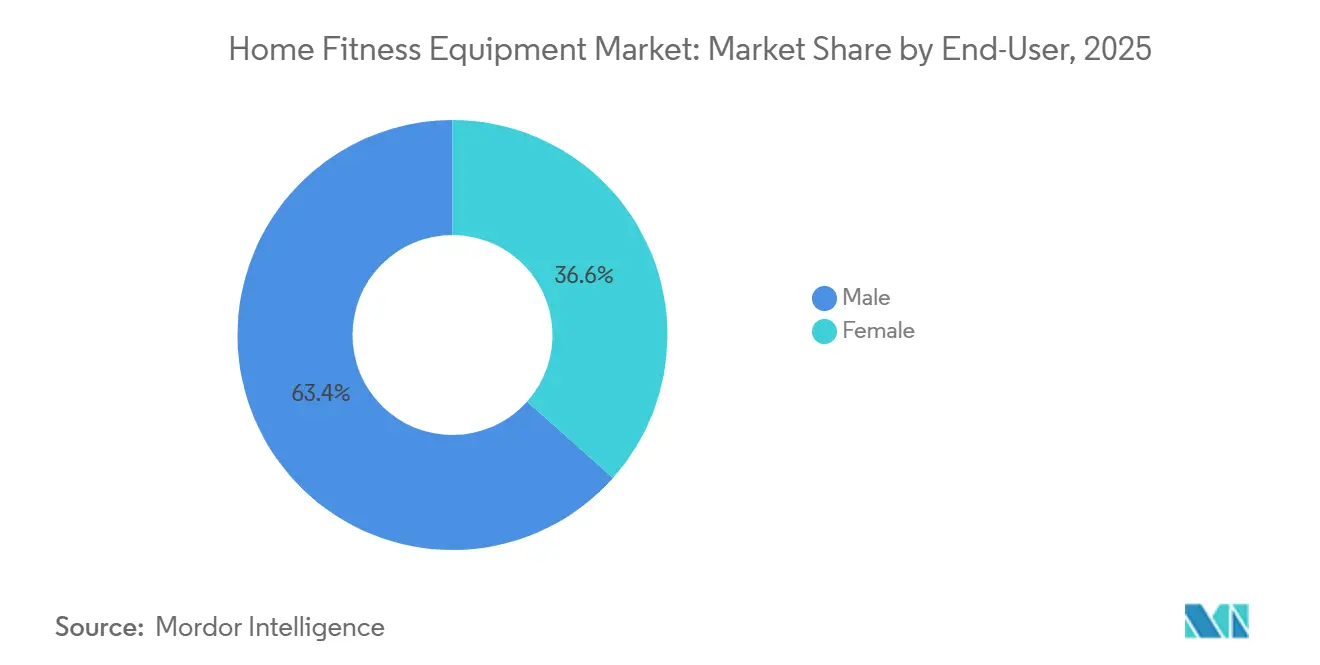
- By end-user, the male segment commanded 63.42% revenue in 2025, whereas the female cohort is forecast to pace ahead at an 8.55% CAGR.
- By distribution channel, offline retail stores captured 59.97% sales in 2025; online retail is projected to expand at a 9.37% CAGR to 2031.
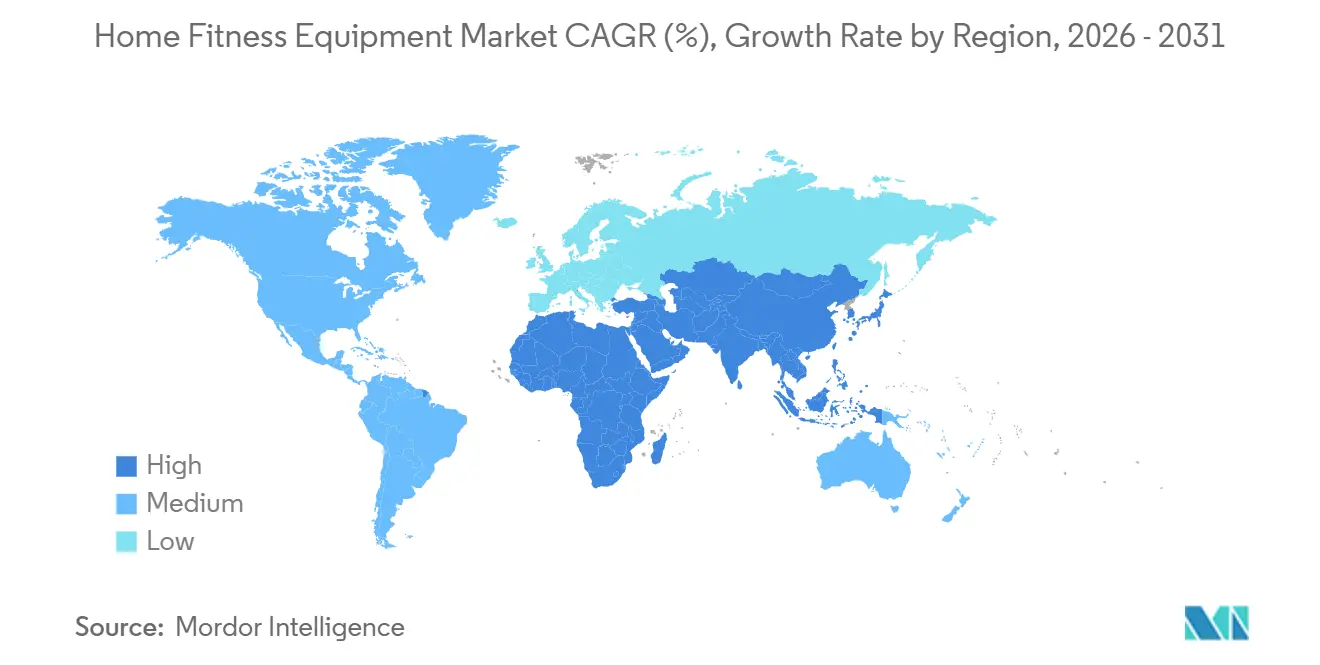
- By geography, North America accounted for a 41.69% share in 2025, yet Asia-Pacific is set to grow the quickest at 8.93% CAGR over the same period.
Note: Market size and forecast figures in this report are generated using Mordor Intelligence’s proprietary estimation framework, updated with the latest available data and insights as of January 2026.
Global Home Fitness Equipment Market Trends and Insights
Drivers Impact Analysis*
| Driver | (~) % Impact on CAGR Forecast | Geographic Relevance | Impact Timeline |
|---|---|---|---|
| Increasing Obesity Rates and Health Concerns | +1.2% | Global, with highest impact in North America and Europe | Long term (≥ 4 years) |
| Rising Popularity of At-Home Workouts | +1.8% | Global, with early adoption in developed markets | Medium term (2-4 years) |
| Growth of Smart and Connected Fitness Devices | +1.5% | North America and EU core, spill-over to APAC (Asia-Pacific) | Medium term (2-4 years) |
| Government Campaigns Promoting Active Lifestyles | +0.9% | Global, with regional policy variations | Long term (≥ 4 years) |
| Surge in Demand for Compact, Portable, and Space-Saving Equipment | +1.1% | APAC core, urban centers globally | Short term (≤ 2 years) |
| Influence of Fitness Influencers and Social Media | +0.8% | Global, with highest penetration in developed markets | Short term (≤ 2 years) |
| Source: Mordor Intelligence | |||
Increasing Obesity Rates and Health Concerns
The rising prevalence of obesity continues to drive sustained demand for accessible fitness solutions. According to Trust for America's Health, adult obesity in the United States has reached 41.9%, while youth obesity stands at 19.7% in 2023[1]Source: Trust for America's Health, "Better Policies For A Healthier America", tfah.org. Additionally, the White House's 2025 MAHA Report reveals that over 40% of American children are affected by chronic health conditions, primarily stemming from poor dietary habits and sedentary lifestyles. Notably, nearly 70% of children's caloric intake comes from ultra-processed foods, exacerbating the health crisis. This alarming trend has prompted increased consumer investment in home fitness equipment as a proactive approach to health management[2]Source: White House, "Make Our Children Healthy Again", whitehouse.gov. Demographics with higher obesity rates, such as Black and Latino populations, are particularly driving this demand. Furthermore, the economic burden of obesity-related healthcare costs is pushing both individuals and institutions to prioritize fitness solutions. Home fitness equipment offers a practical alternative to traditional gyms by addressing key barriers such as transportation challenges, time constraints, and social anxiety. As a result, it has become a preferred choice for health-conscious consumers seeking sustainable and long-term lifestyle changes.
Rising Popularity of At-Home Workouts
The at-home workout phenomenon has transitioned from pandemic necessity to entrenched preference, with consumer surveys indicating that respondents now prioritize wellness spending, and Gen Z classifies fitness as a "very high priority" compared to the general population. This behavioral stickiness is less about convenience and more about control: home exercisers avoid commute friction, class-schedule constraints, and the social comparison anxiety that deters novices from commercial gyms. Critically, this shift is not cannibalizing gym memberships; U.S. gym membership hit a record 72.9 million in 2024, but rather creating a hybrid model where consumers maintain both subscriptions and home equipment, using each for different workout modalities, according to the IHRSA. The medium-term impact reflects the maturation of digital fitness platforms that now offer live coaching, community features, and performance analytics previously exclusive to in-person training, effectively commoditizing the boutique studio experience.
Growth of Smart and Connected Fitness Devices
Internet of Things (IoT) technology is significantly enhancing home fitness equipment by transforming it from passive tools into intelligent training systems. These systems now deliver real-time feedback, personalized coaching, and comprehensive progress tracking, catering to the evolving needs of fitness enthusiasts. The U.S. Olympic and Paralympic Committee's emphasis on adaptive sports equipment and technology-driven training highlights the institutional recognition of connected fitness solutions as a means to boost athletic performance and improve accessibility for diverse user groups[3]Source: The U.S. Olympic & Paralympic Committee, "Grants And Equipment", usopc.org. Smart fitness equipment addresses critical consumer challenges, such as maintaining workout motivation, ensuring proper form, and tracking progress effectively. Additionally, it provides manufacturers with valuable usage data, enabling continuous product improvement and innovation. Smart equipment adoption is accelerating beyond early-adopter circles, driven by interoperability standards like Bluetooth FTMS (Fitness Machine Service) that allow third-party apps to control resistance and incline across brands, dissolving the walled-garden ecosystems that once locked users into single platforms.
Government Campaigns Promoting Active Lifestyles
Activity Guidelines recommend 150 minutes of moderate aerobic activity plus two days of strength training per week, a prescription that aligns precisely with the capabilities of home treadmills, stationary bikes, and resistance systems, effectively creating a de facto endorsement for equipment ownership. Internationally, China's "Healthy China 2030" blueprint mandates fitness infrastructure expansion and promotes home-based exercise as a solution to urban overcrowding, while India's Fit India Movement leverages celebrity ambassadors to normalize daily physical activity among its young population. Similarly, the World Health Organization's Global Action Plan on Physical Activity (2018-2030) aims to reduce physical inactivity by 10% by 2025 and 15% by 2030, influencing national policies to promote home fitness solutions as accessible and convenient alternatives to traditional exercise facilities[4]Source: World Health Organization, "More active people for a healthier world", who.int. These initiatives carry long-term impact because they embed fitness into national identity narratives, shifting cultural norms in ways that commercial marketing cannot replicate. However, the efficacy depends on sustained funding and coordination across fragmented agencies, which historically wane during budget cycles or political
Restraints Impact Analysis*
| Restraint | (~) % Impact on CAGR Forecast | Geographic Relevance | Impact Timeline |
|---|---|---|---|
| High Initial Cost Limits Adoption Among Price-Sensitive Consumers | -0.8% | APAC urban centers, European cities | Medium term (2-4 years) |
| Competition from Commercial Fitness Centers | -0.6% | Global, with highest impact in developed markets | Long term (≥ 4 years) |
| Evolving Equipment-Free Workout Trends | -0.5% | Global, with early adoption among younger demographics | Short term (≤ 2 years) |
| Risk of Injuries from Improper Equipment Use | -0.4% | Global, with regulatory focus in developed markets | Medium term (2-4 years) |
| Source: Mordor Intelligence | |||
Competition from Commercial Fitness Centers
Commercial gyms are mounting a counteroffensive through hybrid membership models that bundle in-person access with digital content, effectively neutralizing the convenience advantage that home equipment once monopolized. U.S. gym memberships reached 72.9 million in 2024, the highest on record, driven by budget chains like Planet Fitness, which operates over 2,600 locations, offering USD 10 monthly memberships that undercut the amortized cost of home equipment over a 2-year horizon, according to IHRSA. Boutique studios such as Equinox and SoulCycle are pivoting to "phygital" strategies, providing members with app-based workouts and loaner equipment for travel, blurring the line between home and facility-based fitness. The medium-term restraint intensifies as gyms invest in experiential amenities, cold plunges, infrared saunas, and recovery lounges that cannot be replicated at home, creating a differentiation moat that appeals to consumers seeking social interaction and variety. However, this competitive pressure is geographically uneven; in rural or suburban markets with limited gym density, home equipment remains the default option, suggesting that the restraint's impact will concentrate in urban cores where facility saturation is highest.
Evolving Equipment-Free Workout Trends
The proliferation of bodyweight-training apps, HIIT programs, and yoga platforms is eroding the perceived necessity of equipment ownership, particularly among younger demographics who prioritize mobility and minimalism over asset accumulation. Apps like Nike Training Club and Peloton Digital offer subscription-based workouts requiring zero equipment, with Peloton Digital priced at USD 12.99 monthly, a fraction of the USD 1,495 entry point for a Peloton Bike. The rise of calisthenics influencers on YouTube and TikTok, who showcase physique transformations achieved solely through push-ups, pull-ups, and planks, reinforces the narrative that expensive equipment is unnecessary for fitness goals. This trend exerts short-term pressure as economic uncertainty prompts consumers to defer large purchases in favor of low-commitment alternatives. Yet the restraint's durability is questionable; equipment-free workouts plateau in difficulty without progressive resistance, driving intermediate users back toward weights and machines once bodyweight exercises no longer yield gains. The impact is most acute in cost-sensitive markets across Asia-Pacific, South America, and Africa, where disposable income constraints make free alternatives disproportionately attractive.
*Our forecasts treat driver/restraint impacts as directional, not additive. The impact forecasts reflect baseline growth, mix effects, and variable interactions.
Segment Analysis
By Product Type: Stationary Cycles Accelerate on Affordability
Treadmills secured 26.87% market share in 2025, anchored by their versatility across walking, jogging, and running modalities that appeal to the broadest user base, yet Stationary Cycles are projected to expand at 7.85% CAGR through 2031, outpacing all other categories. This acceleration reflects the proliferation of sub-USD 1,000 connected bikes from brands like Echelon, Schwinn IC4, and Bowflex that replicate Peloton's core experience, live classes, leaderboards, metrics tracking, without the USD 1,495 price tag or mandatory subscription lock-in. Elliptical Machines and Rowing Machines cater to niche audiences seeking low-impact cardio or full-body engagement, with Hydrow's electromagnetic rowers and Concept2's Model D dominating the rowing segment through superior biomechanics and durability that justify premium pricing. Other product types, including yoga mats, foam rollers, and suspension trainers, serve as gateway purchases for budget-conscious beginners who later upgrade to motorized equipment once habit formation solidifies. The segment's growth disparity underscores a bifurcation: consumers either invest in multi-functional, space-efficient bikes that deliver cardio and entertainment, or they default to low-cost accessories that require minimal commitment, leaving mid-tier treadmills and ellipticals squeezed between these poles.
Stationary cycles' ascendance is further propelled by interoperability standards like Bluetooth FTMS, which allow riders to pair third-party bikes with apps such as Zwift, Peloton Digital, or Apple Fitness+, dissolving brand loyalty and commoditizing hardware. NordicTrack's integration of iFit into its S22i and S27i models, featuring auto-resistance that syncs with on-screen terrain, exemplifies how incumbents are defending share through proprietary ecosystems, yet the open-platform movement threatens to erode these moats. Treadmills, despite their market-share lead, face saturation in developed markets where replacement cycles stretch beyond 7 years due to mechanical durability, whereas bikes' shorter lifespan and lower weight facilitate more frequent upgrades. Rowing Machines remain a connoisseur's choice, with Concept2's Model D maintaining cult status among CrossFit athletes and collegiate programs, but the segment's growth is capped by the learning curve required to master proper rowing form, deterring casual users who gravitate toward intuitive treadmill or bike interfaces.



By Category: Smart Equipment Gains Despite Premium Pricing
Conventional equipment retained 68.18% share in 2025, reflecting the enduring appeal of mechanical reliability, zero subscription fees, and the ability to resell units on secondary markets without depreciation tied to obsolete software. Yet Smart/Connected Equipment is surging at 9.61% CAGR through 2031, a premium over the market's 7.59% baseline, driven by consumers who view fitness as a lifestyle identity rather than a utilitarian chore and are willing to pay for immersive experiences that blend exercise with entertainment. Conventional equipment's dominance persists in price-sensitive geographies, Asia-Pacific, South America, the Middle East and Africa, where consumers prioritize durability and simplicity over connectivity, viewing smart features as frivolous add-ons that complicate maintenance and inflate repair costs.
The smart-equipment surge is less about hardware innovation and more about software differentiation; AI-driven coaching, biometric integration, and social competition features create switching costs that lock users into ecosystems, transforming one-time equipment sales into recurring-revenue streams. Technogym's MyWellness platform, which aggregates workout data across gym visits and home sessions, exemplifies how incumbents are leveraging interoperability to retain users across multiple touchpoints. The category's growth divergence suggests a barbell market structure: affluent consumers cluster around premium smart equipment with full-feature subscriptions, while budget buyers opt for stripped-down conventional units, leaving mid-tier connected equipment, devices with Bluetooth but no proprietary content, struggling to differentiate.
By End-User: Female Segment Accelerates on Strength Training
Males commanded 63.42% market share in 2025, a reflection of historical gym-culture norms where men disproportionately invested in home equipment, yet the Female segment is expanding at 8.55% CAGR through 2031, outpacing the overall market by nearly a full percentage point. This acceleration stems from a cultural recalibration where women increasingly prioritize strength training over cardio-only regimens, dismantling outdated stereotypes that weightlifting induces "bulkiness" rather than lean muscle definition. Brands like Tonal and Mirror (acquired by Lululemon in 2020) explicitly target women through marketing that emphasizes aesthetics, compact design, and community features, contrasting with the utilitarian, performance-focused messaging that characterizes male-oriented products.
The female segment's growth is further amplified by prenatal and postnatal fitness demand, with equipment manufacturers introducing adjustable benches, resistance bands, and low-impact machines tailored to pregnancy-safe workouts. Male segment growth, while slower, remains robust due to the established habit of home-gym investment among weightlifting and CrossFit communities, where equipment ownership signals commitment and facilitates training flexibility. However, the male segment faces saturation in developed markets, where garage gyms and basement setups have reached penetration ceilings, whereas the female segment retains greenfield potential as first-time buyers enter the market.
By Distribution Channel: E-Commerce Erodes Showroom Advantage
Offline retail stores captured 59.97% share in 2025, buoyed by consumers' desire to test equipment ergonomics, assess build quality, and negotiate financing terms face-to-face, yet online retail stores are expanding at 9.37% CAGR through 2031, a trajectory that will flip the channel hierarchy within the forecast window. This shift reflects the maturation of e-commerce infrastructure, free returns, white-glove delivery, and virtual showrooms, which have neutralized the tactile advantage once exclusive to brick-and-mortar. Amazon's dominance in fitness equipment sales, amplified by Prime membership's free shipping and same-day delivery in urban markets, has commoditized distribution, forcing specialty retailers like Dick's Sporting Goods to adopt omnichannel strategies that blend in-store pickup with online ordering. Direct-to-consumer brands like Peloton, Tonal, and Hydrow bypassed traditional retail entirely, using digital marketing and influencer partnerships to build brand equity without wholesaler margins, a playbook that legacy manufacturers are now replicating through proprietary e-commerce platforms.
Offline retail's resilience in 2025 stems from high-consideration purchases, treadmills, ellipticals, and rowers, where consumers prioritize hands-on evaluation before committing USD 1,000-plus, yet this advantage erodes as augmented-reality apps enable virtual equipment placement in home environments, simulating spatial fit without showroom visits. Online retail's growth is further accelerated by financing integration; Affirm and Klarna's one-click checkout options reduce friction at the point of sale, converting browsing into purchases faster than in-store financing applications that require credit checks and paperwork. The channel's bifurcation mirrors broader retail trends: premium, complex equipment sustains offline demand through consultative selling, while commoditized, price-transparent products migrate online, where comparison shopping and discount hunting dominate. By 2031, online channels may command a majority share, relegating physical retail to experiential flagship stores in major metros rather than the sprawling suburban footprint that characterized the pre-pandemic era.
Geography Analysis
North America held 41.69% market share in 2025, a dominance rooted in high disposable incomes, established fitness culture, and early adoption of connected equipment. The United States, which accounted for the lion's share of North American revenue, saw gym memberships hit a record 72.9 million in 2024, creating a hybrid dynamic where consumers maintain both facility access and home equipment. Canada and Mexico exhibit similar patterns, though Mexico's growth is tempered by lower per-capita income and limited credit penetration, constraining access to premium smart equipment. North America's slower growth reflects replacement-cycle dynamics; the pandemic-era buying surge created a saturation overhang where households that purchased treadmills in 2020-2021 will not upgrade until mechanical failure or feature obsolescence, a timeline that extends 5-7 years for durable goods.
Asia-Pacific is projected to expand at 8.93% CAGR through 2031, the fastest among all regions, driven by urbanization in China and India, where rising middle classes prioritize health spending and apartment living necessitates compact, foldable equipment. Indonesia, Thailand, and Singapore are emerging hotspots, with urban professionals in Jakarta, Bangkok, and Singapore favoring premium connected bikes and strength systems that fit sub-1,000-square-foot condos. However, the region's growth is bifurcated: affluent urban consumers cluster around smart equipment, while rural and lower-income segments remain underserved due to limited e-commerce logistics and credit access. Asia-Pacific's trajectory hinges on infrastructure development, last-mile delivery, payment digitization, and after-sales service networks, which can extend premium equipment access beyond tier-1 cities into tier-2 and tier-3 markets where the bulk of population growth resides.
Europe, South America, and the Middle East and Africa collectively represent the balance of global share, each exhibiting distinct growth drivers and constraints. Europe's mature fitness culture, particularly in Germany, the United Kingdom, and the Netherlands, sustains steady demand for conventional equipment, yet smart-device adoption lags. South America's growth is concentrated in Brazil and Argentina, where economic volatility and currency depreciation constrain discretionary spending, though urban elites in São Paulo and Buenos Aires mirror North American consumption patterns. The Middle East and Africa show pockets of strength in the United Arab Emirates and Saudi Arabia, where government wellness initiatives and expatriate populations drive premium equipment sales, yet broader regional adoption is hindered by infrastructure gaps and low credit penetration. Turkey's fitness market, straddling Europe and Asia, benefits from a young population and growing gym culture, positioning it as a manufacturing hub for brands targeting both regions. Across these geographies, the common thread is income inequality; equipment sales concentrate in affluent urban enclaves, leaving vast rural and lower-income populations reliant on bodyweight training or public fitness infrastructure, a dynamic that will persist unless manufacturers develop ultra-low-cost models or governments deploy subsidy programs.

Regulatory Landscape
Home fitness equipment is primarily shaped by consumer product safety regimes and evolving standards that affect design, labeling, and post-market surveillance. In the European Union, Regulation (EU) 2023/988 (General Product Safety Regulation) became effective in December 2024, tightening requirements around manufacturer-led risk assessment, technical documentation, and traceability for consumer products, including fitness equipment intended for in-home use. Product-level safety engineering is also anchored by international standards such as ISO 20957-1:2024 (published January 2024), which updates general safety requirements and test methods for indoor stationary training equipment.
In the United States, safety expectations are overseen by bodies such as the U.S. Consumer Product Safety Commission (CPSC), while industry standards (for example, ASTM specifications) are commonly used to demonstrate conformance and reduce injury risk from improper use or equipment failure. Trade policy also affects landed costs and sourcing strategies for equipment sold globally, with the Office of the United States Trade Representative (USTR) maintaining Section 301 tariff-exclusion windows for certain China-origin products, including listed exclusions referenced as expiring on November 9, 2026. In parallel, USTR released new Section 301 findings and proposed actions in June 2026, alongside a July 2026 hearing schedule. Industry groups such as the Health and Fitness Association (HFA) submitted formal comments to USTR in 2026, reflecting ongoing advocacy around tariff classification and supply chain stability for fitness equipment importers and retailers.
Competitive Landscape
The market is characterized by intense competition and fragmentation, driven by the presence of numerous domestic and international players. Key players include Icon Health and Fitness, Inc., Johnson Health Tech Co. Ltd., Technogym SpA, and Peloton Interactive, Inc. These industry leaders prioritize product innovation and development, allowing them to consistently introduce new offerings. Meanwhile, other players in the segment often resort to mergers and acquisitions, bolstering their dominance over domestic competitors.
Manufacturers now vie for supremacy not just on hardware specifications, but on integrated technologies like connected features, AI-driven coaching, and virtual reality experiences. This heightened competition fuels both consolidation activities and strategic partnerships. At the same time, safety concerns lead to regulatory compliance, benefiting companies with strong quality control and user support systems. Untapped opportunities arise in demographics like female consumers, who are rapidly embracing fitness, and in urban markets where space constraints necessitate compact equipment solutions. Disruptors are challenging established players with direct-to-consumer models, subscription access, and niche positioning.
However, they must navigate regulatory oversight, such as that from the U.S. Consumer Product Safety Commission, which influences product development and market strategies. The recall of 3.8 million BowFlex dumbbells, spurred by injury reports, underscores the swift repercussions of safety issues on market standing and consumer trust. This highlights the critical role of quality control and user education in maintaining a competitive edge. Companies are increasingly focusing on ecosystem development, merging equipment, content, community features, and data analytics. This holistic approach not only caters to diverse consumer needs but also fosters brand loyalty and sets them apart in the market.
Home Fitness Equipment Industry Leaders
-
Johnson Health Tech Co. Ltd.
-
Technogym SpA
-
Peloton Interactive, Inc.
-
BowFlex, Inc.
-
Icon Health and Fitness, Inc.
- *Disclaimer: Major Players sorted in no particular order

Market Opportunities and Future Outlook
One actionable opportunity sits in building hybrid training ecosystems that connect home hardware to broader training networks, including commercial venues and third-party content platforms, without forcing consumers into a single-brand stack. In 2026, Peloton leaned into this direction by announcing the Peloton Commercial Series for high-traffic gym environments (shipping slated for late 2026) and by partnering with Spotify to distribute Peloton fitness and wellness content inside Spotify's fitness category for Premium subscribers, expanding distribution beyond Peloton's direct hardware and app funnel. This cross-channel approach is closely tied to the market's smart equipment momentum and helps reduce reliance on one-time equipment purchases by widening the addressable audience for paid coaching and content.
Supply-chain diversification is another near-term focus for brands seeking faster replenishment and better coverage for after-sales support, particularly as product needs diverge by use case and space constraints. Compact, foldable formats and modular strength systems can be easier to support when production footprints and inventory planning are regionally balanced. In May 2026, Johnson Health Tech began production at its Bac Ninh plant in Vietnam, adding capacity in Southeast Asia and reinforcing this manufacturing balance. On compliance execution, the EU's GPSR framework is being operationalized through updates to harmonised standards, including the European Commission's April 2026 Implementing Decision (EU) 2026/901, which gives manufacturers and retailers a clearer path to translating documentation, traceability, and safety-by-design into faster listings and smoother cross-border distribution across Europe.
Recent Industry Developments
- June 2026: The Office of the United States Trade Representative (USTR) issued findings and proposed actions tied to Section 301 investigations, with hearings scheduled for July 2026. For home fitness equipment brands and retailers sourcing globally, this raised uncertainty around input costs and reinforced the need to manage tariff exposure and diversify suppliers.
- April 2026: Peloton announced a global partnership with Spotify, placing Peloton fitness and wellness content into Spotify's new fitness category for Premium subscribers. The partnership expands content distribution beyond Peloton's owned platform and supports a software-and-content engagement model alongside hardware sales.
- January 2025: Johnson Health Tech issued a consumer notification letter for a safety recall affecting certain Matrix Fitness training cycles. The action underscored the importance of safety compliance, documentation, and customer support in protecting brand trust in the home fitness equipment category.


Research Methodology Framework and Report Scope
Market Definition and Coverage
This market covers revenue generated from equipment that people buy and use inside their homes to exercise, including cardio machines, strength equipment, free weights, and connected home gym devices, counted on an equipment sales value basis.
Scope exclusions: We exclude stand-alone wearables, nutrition products, and purchases made specifically for commercial gyms or fitness studios.
Segmentation Overview
-
Product Type
- Treadmills
- Elliptical Machines
- Stationary Cycles
- Rowing Machines
- Strength Training Equipment
- Other Product Types
-
Category
- Conventional
- Smart/Connected Equipment
-
End-User
- Male
- Female
-
Distribution Channel
- Offline Retail Stores
- Online Retail Stores
-
Geography
-
North America
- United States
- Canada
- Mexico
- Rest of North America
-
Europe
- Germany
- United Kingdom
- Italy
- France
- Spain
- Netherlands
- Poland
- Belgium
- Sweden
- Rest of Europe
-
Asia-Pacific
- China
- India
- Japan
- Australia
- Indonesia
- South Korea
- Thailand
- Singapore
- Rest of Asia-Pacific
-
South America
- Brazil
- Argentina
- Colombia
- Chile
- Peru
- Rest of South America
-
Middle East and Africa
- South Africa
- Saudi Arabia
- United Arab Emirates
- Nigeria
- Egypt
- Morocco
- Turkey
- Rest of Middle East and Africa
-
North America
Data Sources, Market Sizing, and Validation
Desk Research
Desk research was used to build the initial fact base on demand signals, trade flows, pricing direction, and category adoption. We referenced public sources such as US Census Bureau retail trade releases, USITC and UN Comtrade trade statistics, Eurostat consumer and industry datasets, and World Bank macro indicators that help explain household spending and durable goods demand.
To tighten assumptions, we also reviewed annual reports, investor presentations, earnings call transcripts, and product specification sheets, which help track category mix shifts, including connected equipment, foldable designs, and entry-level versus premium models. Select paid database subscriptions were used only for company financials and intelligence, patent databases, and shipment-level import and export checks where public series lacked granularity. These examples are not exhaustive, and other public sources were also used for collection, cross-checking, and clarification.
Primary Interviews and Surveys
Primary work focused on interviews and structured surveys with manufacturers, brand distributors, large retailers, specialty dealers, and logistics and service partners, since these groups see real movements in volumes, promotions, and returns. For a global view, we balanced inputs across APAC, EMEA, and the Americas, then revisited key respondents when pricing, freight, or connected-feature attach rates shifted from the original assumptions.
Distribution of primary research fieldwork respondents
| Company type | Respondent position | Region |
|---|---|---|
| Top tier: 39% | CXOs: 17% | APAC: 49% |
| Mid tier: 41% | Functional/Unit leaders: 27% | EMEA: 30% |
| Smaller Players: 20% | Managers: 56% | Americas: 21% |
Market-Sizing & Forecasting
Sizing starts with a top-down build where household fitness participation and replacement cycles are translated into a demand pool for major equipment categories, and then converted into value using observed price bands. Once the demand pool is built, it is validated with selective bottom-up approximations, such as sampled model-level ASP times unit volumes from retailer checks and supplier roll-ups, followed by adjustments where the two views do not reconcile.
Key inputs used in the model include at-home workout participation trends, the share of households with adequate space for equipment, average replacement timing by category (treadmills versus free weights), online versus offline channel mix, promotion intensity during peak seasons, and the attach rate for connected features that can lift ASP. Forecasting relies on scenario analysis supported by expert views on consumer discretionary spend, freight and material cost direction, and category maturity by region, so the range stays realistic even when demand swings. Where bottom-up visibility is patchy for smaller brands, gaps are handled by applying category-level channel shares and price bands that are confirmed through interviews, and then stress-tested for sensitivity.
Data Validation & Update Cycle
Outputs are checked against independent signals such as import trends, major product launch cycles, and reported revenue direction from public filings, and then reviewed for sudden step changes that cannot be explained by inputs. When a variance looks material, assumptions are revisited, and respondents may be re-contacted to confirm whether the driver is pricing, mix, or volume.
A multi-step analyst review is followed before sign-off, with focus on currency consistency, inflation effects, and region-to-global roll-ups. Reports are refreshed annually, and interim updates are triggered by material events like large price resets, supply constraints, or major demand shocks. Before delivery, a final freshness pass is done so the market view reflects the latest public data and validated assumptions.
Mordor Intelligence's Home Fitness Equipment Market Size Measured Against Other Published Estimates
Published market sizes for home fitness equipment can look far apart, even when the topic name sounds the same, because each publisher draws the inclusion line differently and applies its own pricing and forecast logic. Differences often come from what is counted as home-use equipment, how connected features are treated, which year is used as the anchor, and how inflation and currency conversion are applied.
The main gap comes from whether adjacent categories like stand-alone wearables, nutrition products, or commercial gym purchases are blended into the total, plus how replacement demand is estimated for big-ticket machines. Some estimates also lean on aggressive post-pandemic rebound scenarios, while others stay conservative on discretionary spending and assume slower ASP progression when promotions are heavy. Evidence checks such as trade flows, retail channel shifts, and price-band reality checks can move the number up or down when the first-pass model is not aligned with observed market signals.
Benchmark comparison
| Source | Market Size | Gaps in Research Methodology |
|---|---|---|
| Mordor Intelligence | USD 11.01 B (2025) | |
| Global Consultancy A | USD 12.88 B (2025) | Uses a broader equipment framing that can lift totals when flexibility-focused items and wider home-use apparatus are grouped together, and it may apply different channel mix and price-band assumptions for connected versus non-connected products. |
| Regional Consultancy B | USD 9.34 B (2024) | Anchors on a different base year and appears to keep the scope tighter around select machine categories, which can reduce value when free weights, multifunctional systems, or higher ASP connected devices are undercounted or priced conservatively. |
The spread in the table is mainly explained by scope and anchoring choices, not by arithmetic. The steps used here keep the value traceable to a clear home-use equipment basket and price bands. A core difference versus other estimates is excluding stand-alone wearables and commercial procurements, which is how Mordor Intelligence keeps the total focused on equipment sales tied to in-home use and replacement demand rather than adjacent wellness spending. Once those scope rules are fixed, remaining differences usually come from how fast ASPs are allowed to rise and how strongly the forecast assumes discretionary spending rebounds.


Key Questions Answered in the Report
What is the current size of the home fitness equipment market?
It was valued at USD 11.84 billion in 2026 and is forecast to reach USD 17.06 billion by 2031.
Which product type is growing fastest?
Stationary cycles are projected to rise at a 7.85% CAGR through 2031.
How quickly is smart equipment expanding?
Smart machines are pacing a 9.61% CAGR, exceeding the overall market rate.
Which region shows the strongest growth outlook?
Asia-Pacific leads with an expected 8.93% CAGR between 2026 and 2031.
Page last updated on:


 Your data is secure and never sold or shared.



