Strength Training Equipment Market Size and Share
Market Overview
| Study Period | 2021 - 2031 |
|---|---|
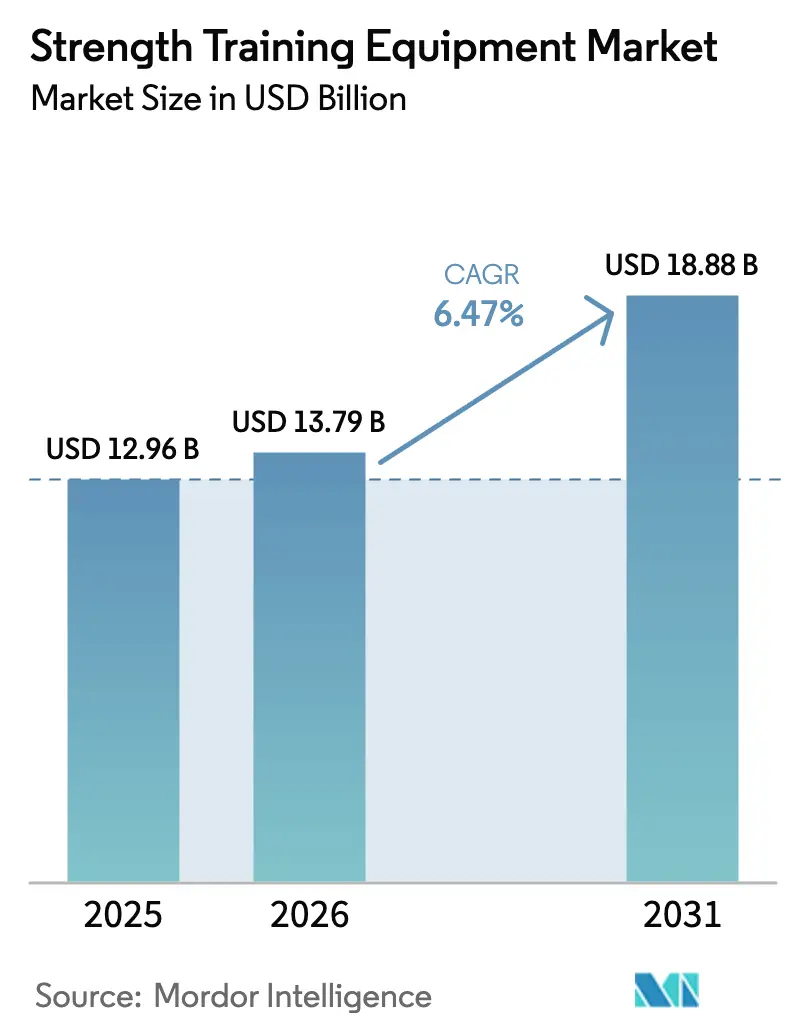
| Market Size (2026) | USD 13.79 Billion |
| Market Size (2031) | USD 18.88 Billion |
| Growth Rate (2026 - 2031) | 6.47% CAGR |
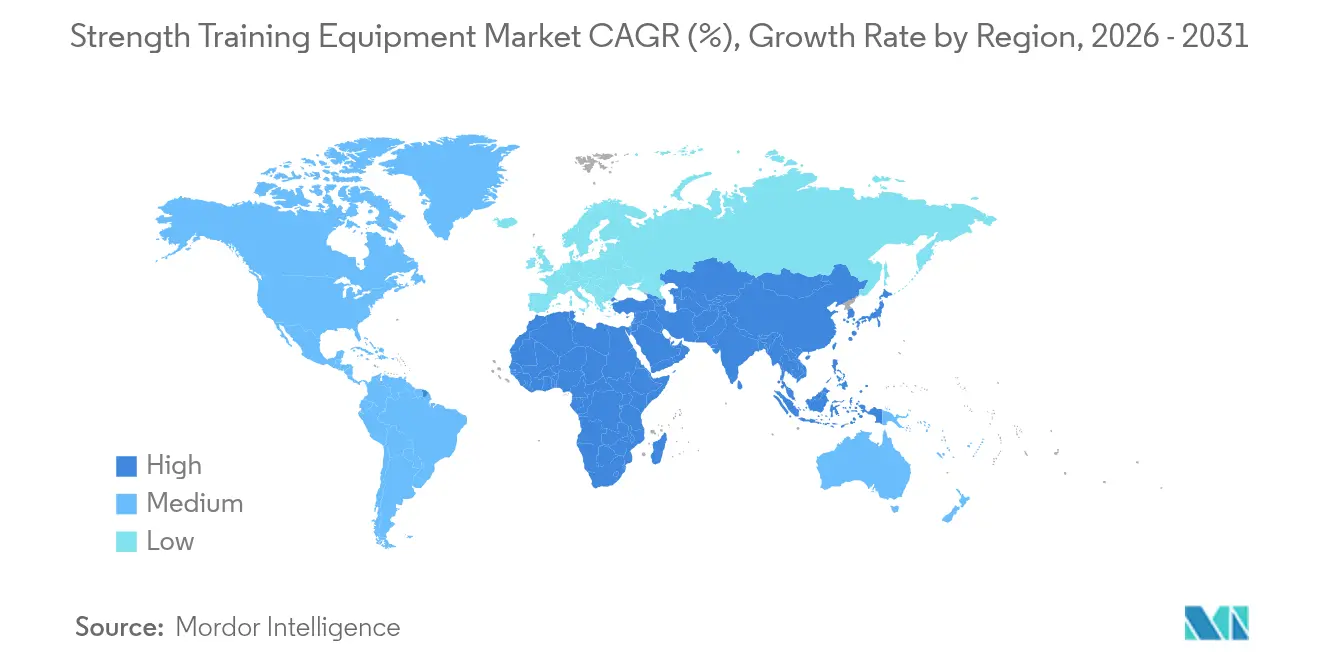
| Fastest Growing Market | Asia Pacific |
| Largest Market | North America |
| Market Concentration | Medium |
Major Players
*Disclaimer: Major Players sorted in no particular order Image © Mordor Intelligence. Reuse requires attribution under CC BY 4.0. |
|
Strength Training Equipment Market Analysis by Mordor Intelligence
The strength training equipment market size in 2026 is estimated at USD 13.79 billion, growing from 2025 value of USD 12.96 billion with 2031 projections showing USD 18.88 billion, growing at 6.47% CAGR over 2026-2031. This growth reflects increasing consumer focus on preventive healthcare and wellness, supported by technological advancements and changing exercise preferences. The market expansion is primarily driven by rising health consciousness, increasing obesity rates, growing disposable income in developing economies, and the integration of smart features in fitness equipment. Commercial fitness facilities are expanding their equipment capacity to accommodate rising memberships, while residential consumers continue to invest in professional-grade home gym equipment. Additionally, the market benefits from government initiatives promoting physical activity, corporate wellness programs, and the growing popularity of strength training among diverse age groups.
Key Report Takeaways
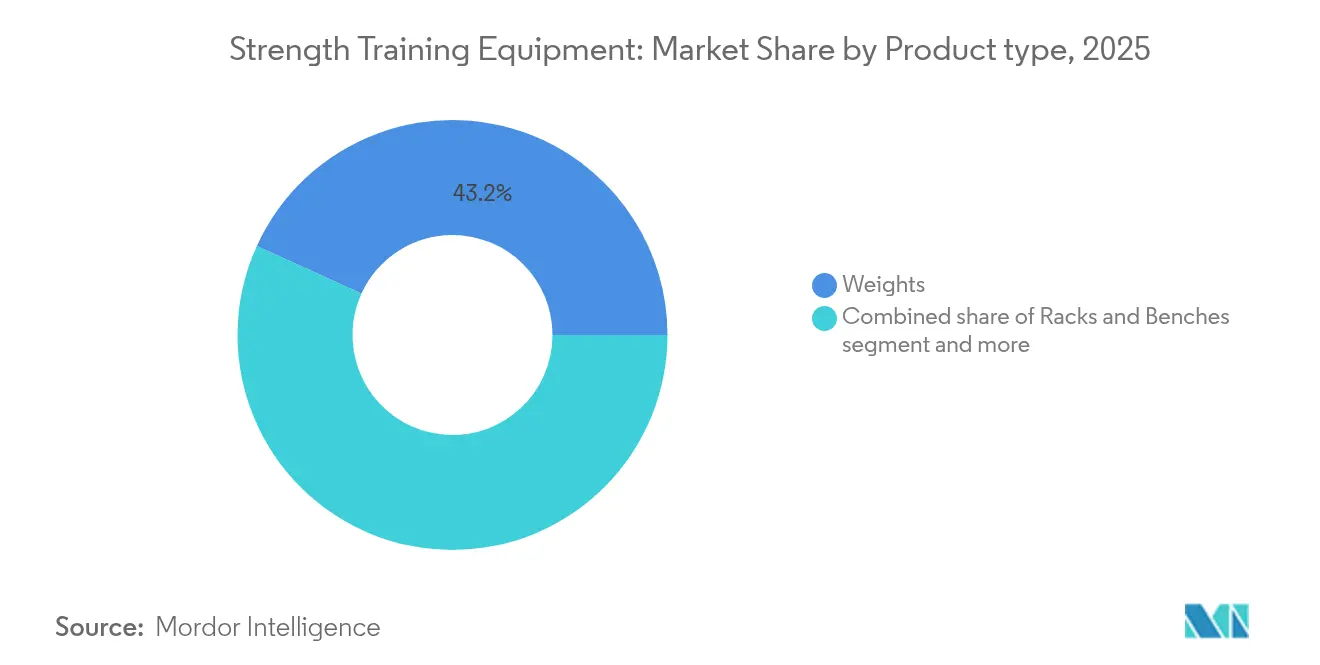
- By product type, weights led with 43.20% fitness equipment market share in 2025, while racks and benches posted the quickest 6.71% CAGR through 2031.
- By end user, the commercial segment held 61.95% of the fitness equipment market size in 2025; the residential segment grows fastest at 6.73% CAGR to 2031.
- By category, mass-market items commanded 71.62% share of the fitness equipment market size in 2025, whereas premium products are set to expand at a 7.28% CAGR.
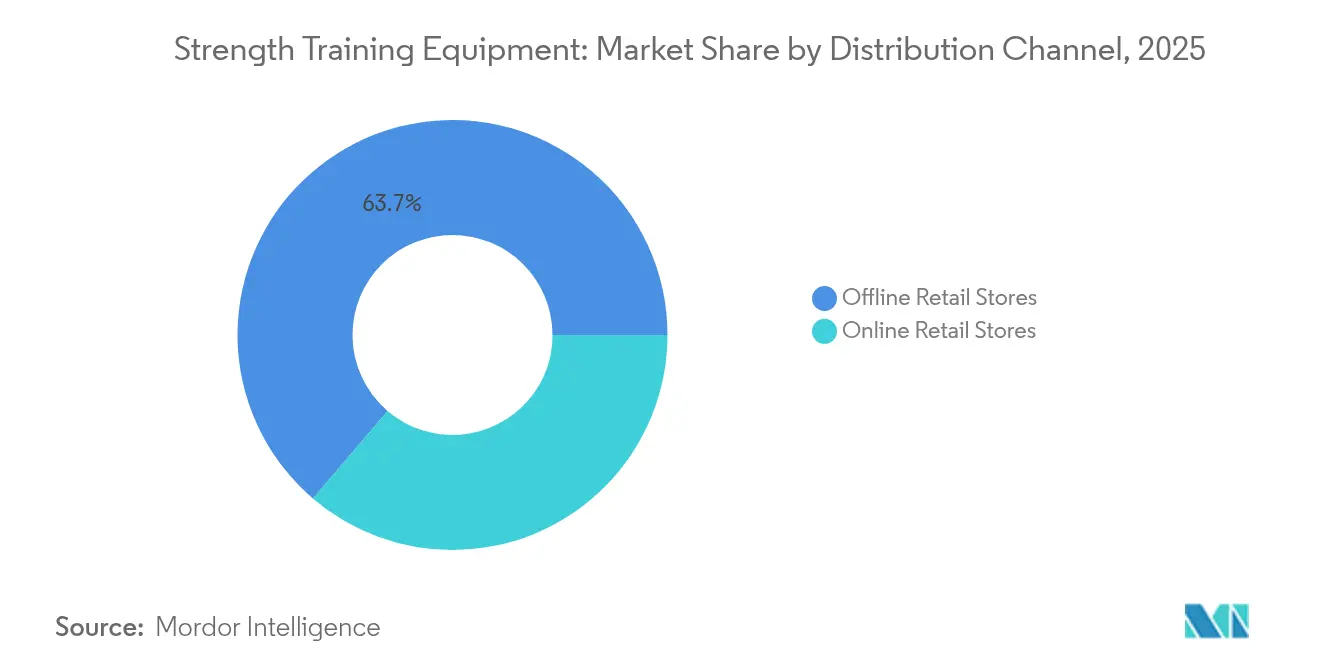
- By distribution channel, offline outlets accounted for 63.75% revenue share in 2025, yet online stores advanced at a 7.71% CAGR.
- By geography, North America captured 30.95% revenue share in 2025; Asia-Pacific records the top regional CAGR of 8.06%.
Note: Market size and forecast figures in this report are generated using Mordor Intelligence’s proprietary estimation framework, updated with the latest available data and insights as of 2026.
Global Strength Training Equipment Market Trends and Insights
Drivers Impact Analysis*
| Driver | (~) % Impact on CAGR Forecast | Geographic Relevance | Impact Timeline |
|---|---|---|---|
| Increasing health and fitness awareness | +1.2% | Global, with strongest impact in Asia-Pacific and North America | Long term (≥ 4 years) |
| Rising prevalence of obesity and lifestyle diseases | +0.8% | Global, particularly North America and Europe | Medium term (2-4 years) |
| Growth of home gyms and remote workouts | +0.9% | Global, accelerated in developed markets | Short term (≤ 2 years) |
| Technological advancements in equipment production | +0.7% | North America, Europe, and urban Asia-Pacific centers | Medium term (2-4 years) |
| Growing fitness club membership and commercial demand | +0.6% | Asia-Pacific core markets, spill-over to Middle East and Africa | Long term (≥ 4 years) |
| Increasing popularity of strength training over cardio | +0.5% | Global, with early adoption in North America and Europe | Medium term (2-4 years) |
| Source: Mordor Intelligence | |||
Increasing Health and Fitness Awareness
The strength training equipment market is experiencing significant growth, driven by increasing health and fitness awareness across diverse age groups and demographics. Consumers increasingly recognize strength training's long-term benefits, including enhanced muscular strength, improved metabolic function, lower risk of chronic diseases, and better mental health. This trend extends globally, supported by broader access to health information, fitness influencers on social media, and a cultural shift prioritizing physical wellness. As preventive healthcare gains importance, strength training equipment, from free weights to resistance machines, has transformed from a luxury into an essential investment. The United States exemplifies this trend, with the Health and Fitness Association (HFA) reporting 77 million Americans holding memberships in gyms, studios, or fitness facilities in 2024, demonstrating the widespread adoption of fitness activities [1]Source: Health & Fitness Association, "Number of memberships at fitness centers and health clubs in the United States", www.healthandfitness.org.
Rising Prevalence of Obesity and Lifestyle Diseases
The strength training equipment market is expanding due to the increasing prevalence of obesity and lifestyle diseases. Sedentary lifestyles, poor dietary habits, and reduced physical activity have led to a significant increase in these health conditions worldwide. With rising public and personal healthcare costs, strength training has become essential due to its effectiveness in weight management, insulin sensitivity improvement, and enhanced cardiovascular and metabolic health. Resistance training offers distinct advantages over aerobic exercises by maintaining lean muscle mass, enhancing basal metabolic rate, and improving body composition, making it vital for preventing and managing obesity-related complications. Healthcare professionals, individuals, and wellness centers actively incorporate strength training into comprehensive health programs. For example, the Italian National Statistical Institute reported that 5.8 million people in Italy were classified as obese in 2023, leading health authorities to implement structured exercise programs, including resistance training, across communities [2]Source: Italian National Statistical Institute, "Number of obese individuals in Italy", www.istat.it.
Growth of Home Gyms and Remote Workouts
Consumers are increasingly choosing home gyms and remote workouts, driving growth in the global strength training equipment market. They prefer at-home fitness for its practicality, flexibility, and time efficiency. This change reflects a long-term shift toward convenient and personalized fitness solutions with digital technology integration. The rise of hybrid and remote work has led more people to create home fitness spaces. Digital platforms now offer app-based workouts and virtual coaching, making strength training easier to access. Users invest in quality home equipment as these digital solutions make workouts more engaging. Both developed and emerging markets show steady growth in equipment sales. Government programs support this trend - Canada's ParticipACTION offers digital resources for home workouts, while the United Kingdom's NHS Digital Fitness Program provides free online strength training plans. These government initiatives build consumer trust in home fitness equipment.
Technological Advancements in Equipment Production
The integration of artificial intelligence and Internet of Things capabilities in smart fitness equipment is transforming traditional strength training into data-driven experiences that enhance workout effectiveness and safety. EGYM's Smart Strength Squat technology and AI-powered Genius tool incorporate advanced algorithms that provide real-time form correction and personalized training adjustments. Moreover, in June 2025, Interactive Strength Inc.'s USD 500 million investment in AI token treasury with Fetch.ai demonstrated the industry's focus on blockchain and AI integration for equipment optimization. Advanced manufacturing automation and precision engineering enable mass customization of equipment to individual user specifications while maintaining production cost-effectiveness.
Restraints Impact Analysis*
| Restraint | (~) % Impact on CAGR Forecast | Geographic Relevance | Impact Timeline |
|---|---|---|---|
| Stringent regulatory requirements | -0.4% | Europe and North America, expanding to Asia-Pacific | Long term (≥ 4 years) |
| High initial capital investment and maintenance costs | -0.3% | Global, particularly impacting emerging markets | Medium term (2-4 years) |
| Space constraints for home equipment | -0.2% | Urban centers globally, acute in Asia-Pacific megacities | Short term (≤ 2 years) |
| Price fluctuation in raw material | -0.3% | Global manufacturing hubs, supply chain dependent | Short term (≤ 2 years) |
| Source: Mordor Intelligence | |||
Stringent Regulatory Requirements
The European Union's Machinery Regulation 2023/1230, which takes effect in January 2027, implements new cybersecurity and digitalization requirements for connected fitness equipment manufacturers. The regulation requires enhanced safety protocols for AI-enabled equipment and cybersecurity measures for IoT-connected devices, extending product development cycles by 12-18 months. The EN17229 standards for European health clubs establish additional compliance requirements for commercial equipment manufacturers. The increased regulatory requirements may favor larger manufacturers with established compliance resources, while smaller manufacturers face higher compliance costs. While the regulation's focus on digital documentation and remote monitoring reflects industry trends, manufacturers must invest significantly in compliance infrastructure.
High Initial Capital Investment and Maintenance Costs
Commercial-grade fitness equipment requires substantial upfront investment, with premium strength training systems creating barriers for smaller fitness facilities and limiting market penetration in price-sensitive segments. Maintenance costs for sophisticated connected equipment represent a significant portion of the initial purchase price annually, as specialized technicians and proprietary software updates are essential for optimal performance. The complexity of modern equipment with integrated electronics and AI capabilities increases the total cost of ownership, particularly for facilities lacking technical expertise. Manufacturers are developing service-as-a-subscription models to distribute costs over time, with companies like Technogym reporting growth in their service revenue streams alongside equipment sales. Leasing and financing options are expanding to address cost barriers, though interest rate fluctuations affect affordability calculations for potential buyers.
*Our forecasts treat driver/restraint impacts as directional, not additive. The impact forecasts reflect baseline growth, mix effects, and variable interactions.
Segment Analysis
By Product Type: Weights Maintain Dominance Despite Functional Training Surge
Weights hold a 43.20% market share in 2025, demonstrating their essential role in strength training across all fitness levels and applications. The segment maintains its position through versatility and effectiveness, serving both beginner and advanced users in commercial and residential settings. Racks and benches show the highest growth rate at 6.71% CAGR during 2026-2031, supported by functional training methods that focus on compound movements and athletic performance. Exercise and medicine balls comprise a smaller but consistent segment, with sustained demand from rehabilitation and group fitness programs.
The market shows increased preference for functional training equipment, moving away from isolated muscle exercises toward movement-based training that replicates daily activities. In March 2025, NordicTrack's launch of the Ultra 1 luxury treadmill with advanced cooling systems and immersive technology demonstrates the integration of premium features into traditional equipment categories. Additional product categories, including training accessories and recovery equipment, are expanding as fitness professionals integrate comprehensive training systems that combine mobility, stability, and recovery with strength training.


By End User: Commercial Facilities Drive Volume While Residential Accelerates
The commercial segment maintains a dominant position with 61.95% market share in 2025, attributed to substantial increases in gym memberships and systematic expansion of fitness facilities across emerging markets. Lifetime's financial performance demonstrates robust segment growth, reporting an 18.7% revenue increase in Q4 2024 and achieving a membership base of 812,062. Commercial establishments benefit from substantial procurement efficiencies and implement systematic maintenance protocols, thereby maximizing equipment performance and operational lifespan. The segment exhibits particularly strong performance metrics in the Asia-Pacific regions, where rapid urbanization and expanding middle-class demographics drive systematic fitness facility development.
The residential segment demonstrates accelerated growth at 6.73% CAGR, reflecting fundamental transformations in fitness consumption patterns that persist beyond initial pandemic-driven adoption. The segment's expansion is facilitated by spatially optimized equipment configurations and sophisticated connected fitness platforms that deliver professional-grade training experiences within domestic environments. The residential market trajectory indicates sustained capital allocation toward home fitness infrastructure as consumers prioritize accessibility and individualized training methodologies.
By Category: Premium Segment Outpaces Mass Market Growth
Mass market products command 71.62% of the market share in 2025, catering to price-sensitive consumers and facilities that require basic functionality. This segment leverages economies of scale in manufacturing and simplified designs to reduce production costs while maintaining essential performance standards. Mass market equipment provides the fundamental infrastructure for fitness facilities and home gyms, making strength training accessible across various economic segments.
The premium segment exhibits robust growth at 7.28% CAGR, as consumers increasingly invest in high-quality, technology-integrated equipment that enhances workout experiences. Technogym's "Healthness" approach, which integrates preventive healthcare features into premium equipment, demonstrates the industry's shift toward positioning advanced products as health investments. Premium equipment incorporates advanced materials, electronic systems, and integrated software platforms, justifying higher prices through enhanced functionality and durability. This growth indicates increasing market maturity and consumer sophistication in equipment selection.
By Distribution Channel: Digital Commerce Transforms Equipment Sales
Offline retail stores hold a 63.75% market share in 2025, as consumers prefer physical evaluation of fitness equipment before making substantial investments. Traditional retail channels offer product demonstrations, immediate availability, and expert consultation services, which remain essential for complex equipment purchases. Sporting goods retailers and specialty fitness stores continue to serve customers who value in-person product interaction and local support services.
Online retail stores are experiencing a 7.71% CAGR, reshaping equipment distribution through digital experiences and direct-to-consumer approaches. E-commerce platforms use virtual reality demonstrations, augmented reality placement tools, and detailed video content to simulate in-store experiences. Peloton's collaboration with Costco, offering Bike+ for strength training through retail stores and online channels, illustrates the adoption of omnichannel strategies. The online segment's expansion is supported by enhanced logistics, financing options, and subscription services that build long-term customer relationships.
Geography Analysis
North America holds 30.95% market share in 2025, driven by established fitness infrastructure and high per-capita fitness spending that maintains premium equipment demand. The region's 5.45% CAGR indicates market stability, supported by facility modernization, technology integration, and growing corporate wellness programs. The Sports and Fitness Industry Association reported 4.2% growth in sporting goods and fitness equipment sales in 2023, with institutional fitness equipment increasing 11.8% and treadmill sales rising 23.5% . The United States maintains market leadership through its established fitness culture, high disposable incomes, and regulatory environment supporting connected fitness equipment innovation. Canada and Mexico contribute through growing fitness facility networks and cross-border equipment trade.
Asia-Pacific records the highest growth rate at 8.06% CAGR, propelled by urbanization, increasing health awareness, and government physical activity initiatives across major economies. The region maintains significant growth potential, with fitness penetration rates lower than developed markets. Johnson Health Tech's USD 100 million investment in Vietnam manufacturing capacity in August 2024, establishing the world's largest fitness equipment factory, indicates strong industry confidence in regional growth. India, Japan, and Southeast Asian markets drive expansion through growing middle-class populations and health awareness initiatives.
Europe exhibits consistent growth at 4.18% CAGR, influenced by strict regulatory requirements and sustainability measures that affect equipment design and manufacturing. The European fitness sector generated EUR 36.0 billion in revenue in 2024, serving 71.6 million consumers, as reported by Europe Active, demonstrating market stability . Germany and the United Kingdom drive regional demand through established fitness cultures and high equipment standards. Southern European markets, including Italy, France, and Spain, contribute by expanding boutique fitness facilities and premium equipment adoption in urban areas.

Competitive Landscape
The fitness equipment market demonstrates moderate fragmentation. This market structure facilitates market penetration for both established manufacturers and technology-focused enterprises through differentiated product portfolios. Industry incumbents, including Life Fitness, Technogym S.p.A., and Johnson Health Tech. Co., Ltd., and BowFlex, Inc., maintain substantial market positions through their established brand equity and comprehensive product offerings. The competitive dynamics are increasingly influenced by technological capabilities, with substantial investments directed toward AI integration, IoT implementation, and software platform development to establish recurring revenue streams through subscription-based services.
The competitive landscape is experiencing a significant transformation as companies adopt integrated ecosystem approaches, developing comprehensive fitness platforms that merge hardware infrastructure with software solutions and content services. This strategic evolution is exemplified by Interactive Strength's expansion initiatives, including a proposed acquisition of a connected-fitness enterprise generating over USD 40 million in revenue. The market structure continues to evolve as organizations implement vertical integration strategies to enhance their technological capabilities and market presence.
The competitive environment presents substantial opportunities in specialized market segments, particularly in rehabilitation equipment, senior-focused fitness solutions, and space-optimized residential systems that address specific consumer requirements not adequately served by conventional commercial equipment. Market participants are establishing competitive advantages through the implementation of subscription-based business models, AI-driven personalization capabilities, and community engagement features. This approach extends beyond traditional product differentiation to encompass comprehensive user experience management and sustained engagement strategies, fundamentally altering the competitive dynamics of the fitness equipment industry.
Strength Training Equipment Industry Leaders
-
Life Fitness
-
Technogym S.p.A
-
Johnson Health Tech. Co., Ltd.
-
BowFlex, Inc.
-
Core Health & Fitness LLC
- *Disclaimer: Major Players sorted in no particular order


Recent Industry Developments
- April 2025: Gymleco unveiled the 029 Incline Press Chest Flyes, a compact, biomechanically optimized machine that combines incline press and chest flyes. Designed for maximum muscle activation and space efficiency, it’s an ideal addition for modern gyms.
- January 2025: STRONG Pilates introduced new strength training equipment that combines traditional Pilates with strength conditioning. The equipment features a weighted bar and Reverse Spring system, which integrates conventional strength training with spring-loaded tension.
- October 2024: Technogym introduced adjustable dumbbells equipped with internal sensors that analyze movement patterns and monitor exercise performance.
- February 2024: Precor introduced a functional strength training product line through its partnership with BeaverFit. The collaboration added more than 10 new products to Precor's catalog, featuring compact functional training equipment with built-in storage solutions.


Research Methodology Framework and Report Scope
Market Definitions and Key Coverage
Our study defines the strength training equipment market as all new free weights, resistance machines, multifunctional trainers, benches, racks, and allied accessories sold to commercial gyms, institutional facilities, and residential users, valued at the manufacturer's selling price net of taxes and freight. Equipment hired, leased, or refurbished is outside the revenue pool that we measure.
Scope exclusion: Cardio-only machines, wearable sensors, nutrition services, and aftermarket maintenance fees are specifically excluded to avoid mixing service revenue with core hardware value.
Segmentation Overview
-
By Product Type
- Weights
- Racks and Benches
- Exercise and Medicine Balls
- Other Product Types
-
By End User
- Residential
- Commercial
-
By Category
- Mass
- Premium
-
By Distribution Channel
- Offline Retail Stores
- Online Retail Stores
-
By Geography
-
North America
- United States
- Canada
- Mexico
- Rest of North America
-
Europe
- Germany
- United Kingdom
- Italy
- France
- Spain
- Netherlands
- Poland
- Belgium
- Sweden
- Rest of Europe
-
Asia-Pacific
- China
- India
- Japan
- Australia
- Indonesia
- South Korea
- Thailand
- Singapore
- Rest of Asia-Pacific
-
South America
- Brazil
- Argentina
- Colombia
- Chile
- Peru
- Rest of South America
-
Middle East and Africa
- South Africa
- Saudi Arabia
- United Arab Emirates
- Nigeria
- Egypt
- Morocco
- Turkey
- Rest of Middle East and Africa
-
North America
Detailed Research Methodology and Data Validation
Primary Research
Mordor analysts interviewed procurement heads at multi-chain gyms across five regions, specialty distributors, and product managers at leading manufacturers. These conversations validated typical annual replacement rates, region-wise average selling prices, and the home-gym shift that secondary data only hinted at.
Desk Research
We started with government trade statistics (HS 950691 dumbbells/barbells, 950699 weight machines), consumer-expenditure tables from the US Bureau of Labor Statistics, Eurostat production indices, and import/export dashboards for Asia-Pacific. Industry association releases such as IHRSA club counts and the International Olympic Committee's fitness participation surveys helped us size addressable user pools. Prices and smart-feature premiums were benchmarked using quarterly filings of listed OEMs, dealer catalogs, and Dow Jones Factiva news archives. Questel patent analytics clarified emerging tech footprints around hydraulic resistance and connected plates. The sources listed are illustrative; many additional public and paid references informed our desk work.
Market-Sizing & Forecasting
A blended top-down and bottom-up model was used. Country-level output and trade values were reconstructed, then adjusted by gym membership penetration, household fitness-spend ratios, and smart-unit price uplift, which are further tested against sampled ASP × volume figures collected from tenders and retailer panels. Key variables such as urban obesity prevalence, steel price indices, e-commerce share, and health-club openings feed a multivariate regression that projects demand to 2030. Where bottom-up estimates run sparse, particularly in emerging markets, weight factors derived from primary interviews bridge data gaps before final triangulation.
Data Validation & Update Cycle
Two analysts independently review anomalies, followed by a senior check. Models refresh annually, with interim revisions whenever currency swings, major M&A, or regulatory shifts move revenue baselines.
Why Mordor's Strength Training Equipment Size & Share Analysis Baseline Stands Reliable
Published market values often differ because firms pick unequal scopes, currencies, or refresh cadences. We acknowledge these variances upfront so buyers understand why numbers seldom match at first glance.
Key gap drivers include: some studies bundle cardio or connected-fitness software, others quote factory-gate units while Mordor reports end-user net revenue; a few depend on historical ratios without fresh primary checks; several convert 2024 prices with fixed exchange rates, whereas our team rolls forward monthly FX averages.
Benchmark comparison
| Market Size | Anonymized source | Primary gap driver |
|---|---|---|
| USD 12.96 B (2025) | Mordor Intelligence | - |
| USD 13.40 B (2025) | Global Consultancy A | broader product basket, limited primary validation |
| USD 4.50 B (2025) | Trade Journal B | covers commercial gyms only, excludes home segment |
| USD 12.90 B (2024) | Industry Association C | earlier base year, static FX conversion |
These comparisons show that once scope and timing are aligned, Mordor's disciplined blend of fresh desk data and field engagement provides a balanced, reproducible baseline that decision-makers can trust.


Key Questions Answered in the Report
What is the current size of the fitness equipment market?
The fitness equipment market is valued at USD 13.79 billion in 2026 and is forecast to grow at 6.47% CAGR to USD 18.88 billion by 2031.
Which region is expanding fastest in the fitness equipment market?
Asia-Pacific posts the strongest 8.06% CAGR, driven by rising incomes, government wellness campaigns and club roll-outs across China, India and Southeast Asia.
Which product category holds the largest share of the fitness equipment market?
Weights dominate with 43.20% revenue share in 2025 owing to their versatility across commercial and residential settings.
How fast is the residential segment growing?
Residential demand for strength-training gear is advancing at a 6.73% CAGR as homeowners adopt hybrid exercise routines that blend home and gym workouts.
Page last updated on:


