IoT Professional Services Market Size and Share
Market Overview
| Study Period | 2020 - 2031 |
|---|---|
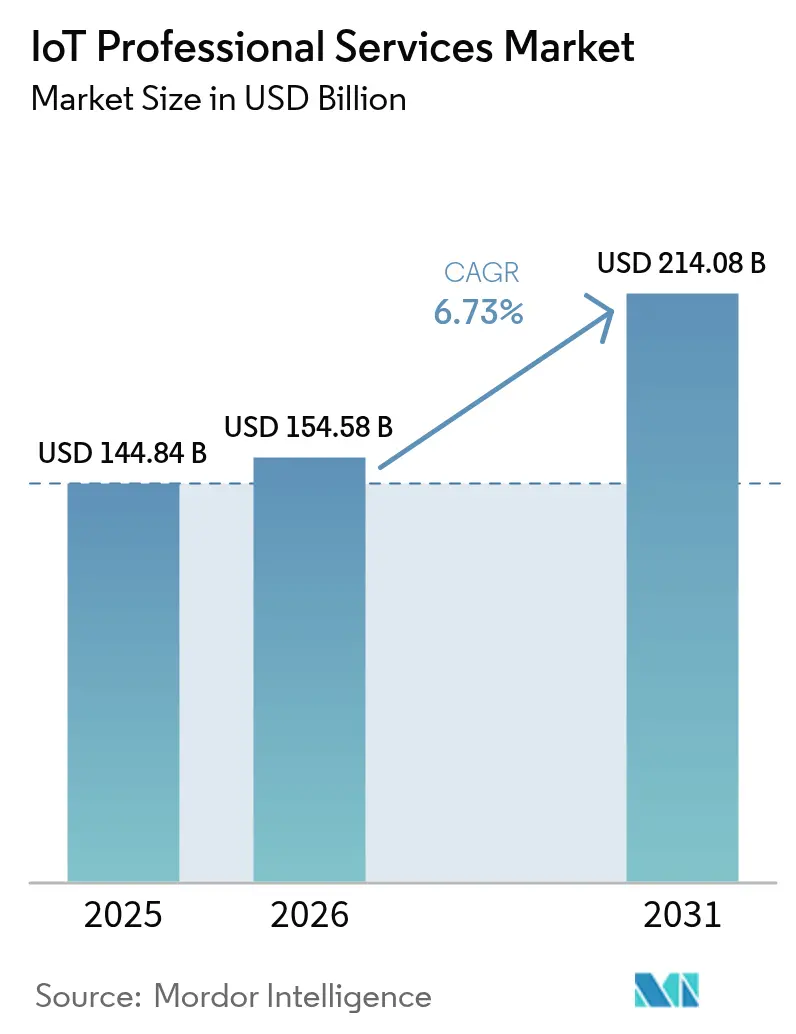
| Market Size (2026) | USD 154.58 Billion |
| Market Size (2031) | USD 214.08 Billion |
| Growth Rate (2026 - 2031) | 6.73% CAGR |
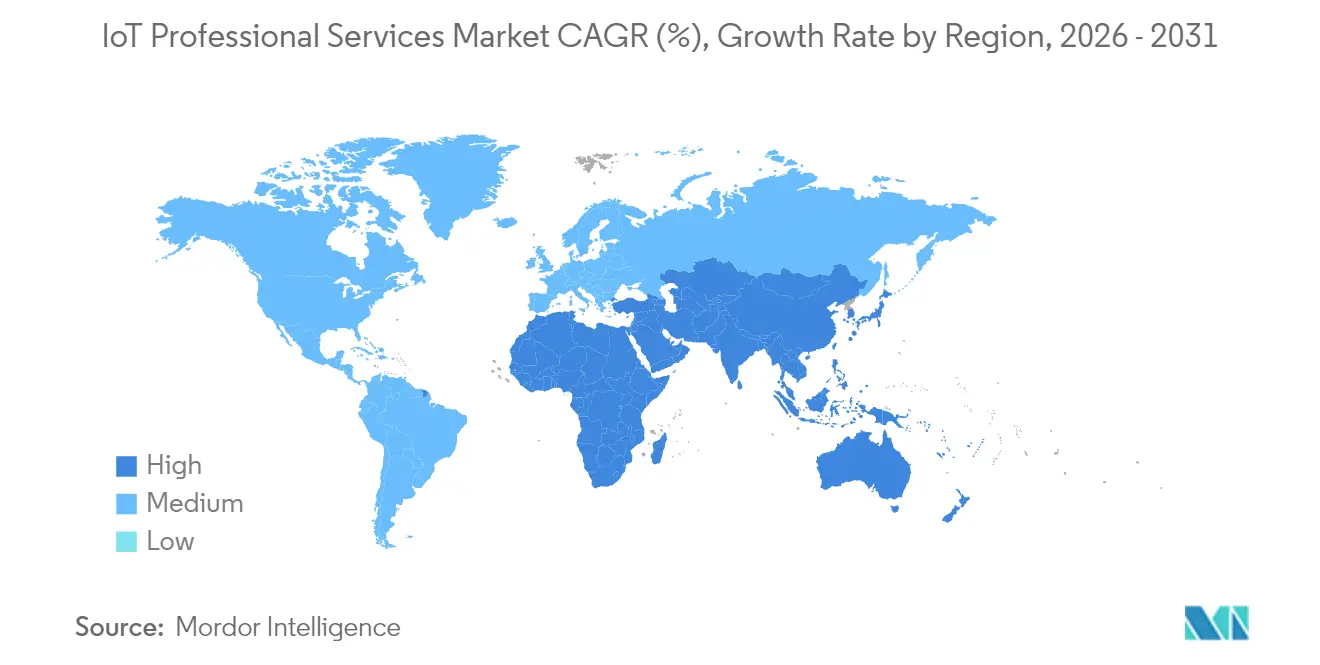
| Fastest Growing Market | Asia Pacific |
| Largest Market | North America |
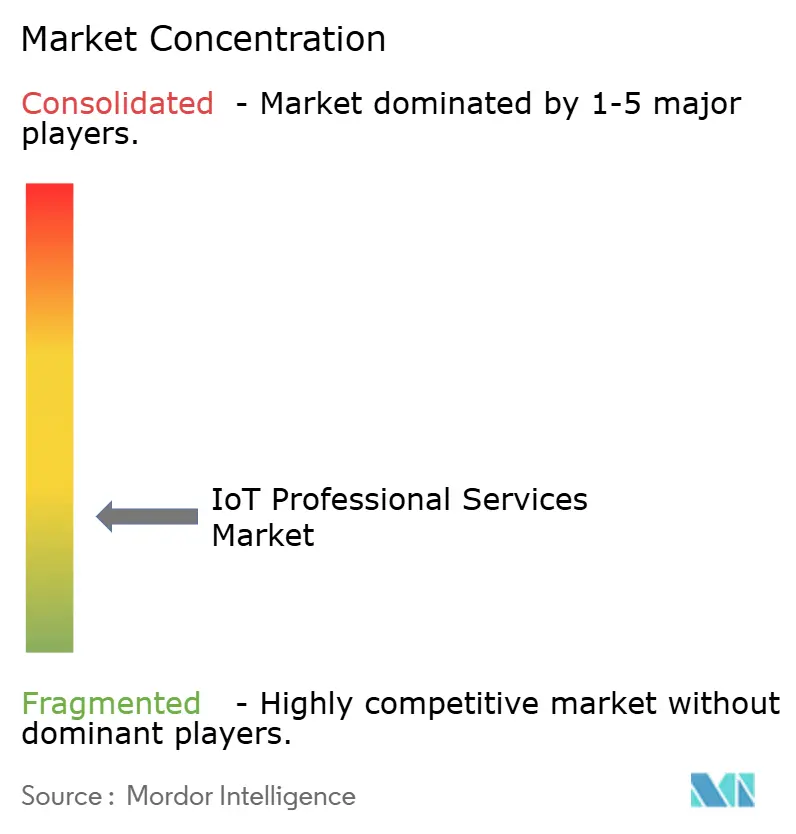
| Market Concentration | Low |
Major Players *Disclaimer: Major Players sorted in no particular order Image © Mordor Intelligence. Reuse requires attribution under CC BY 4.0. | |
IoT Professional Services Market Analysis by Mordor Intelligence
The IoT professional services market size was valued at USD 144.84 billion in 2025 and estimated to grow from USD 154.58 billion in 2026 to reach USD 214.08 billion by 2031, at a CAGR of 6.73% during the forecast period (2026-2031). Expanding connected-device ecosystems, 5G rollouts, and edge-computing investments are moving enterprises from experimentation to full-scale deployments that require specialized consulting, system integration, and managed-service expertise. Outcome-based pricing, domain-specific solutions, and regulatory mandates around Industry 4.0 are reshaping how suppliers package and deliver value. Demand is strongest where device volumes and data-driven business models converge, yet rising cyber-risk and talent shortages temper near-term growth expectations. Overall, the IoT professional services market is transitioning from fragmented project work to recurring, platform-enabled engagements that link technology performance to business outcomes.
Key Report Takeaways
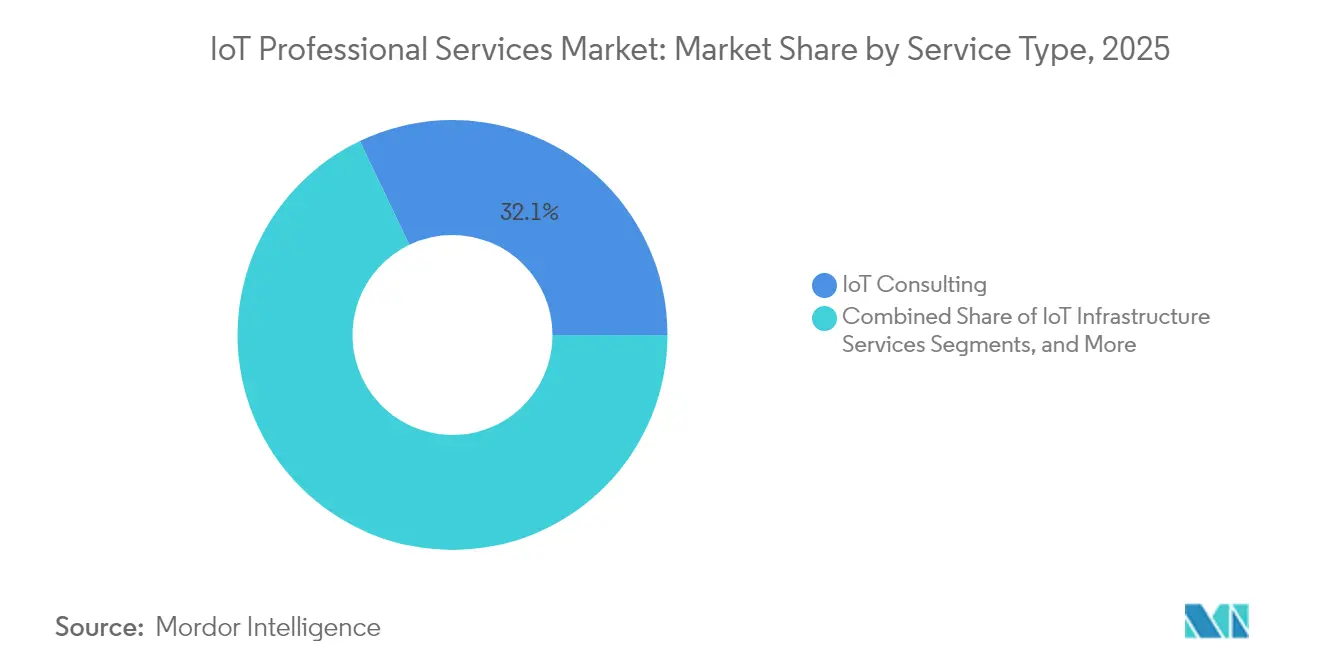
- By service type, IoT consulting led with 32.10% of the IoT professional services market share in 2025, while system design and integration is expanding at a 7.05% CAGR through 2031.
- By organization size, large enterprises accounted for 63.05% of demand in 2025; SMEs record the highest projected CAGR at 7.28% to 2031.
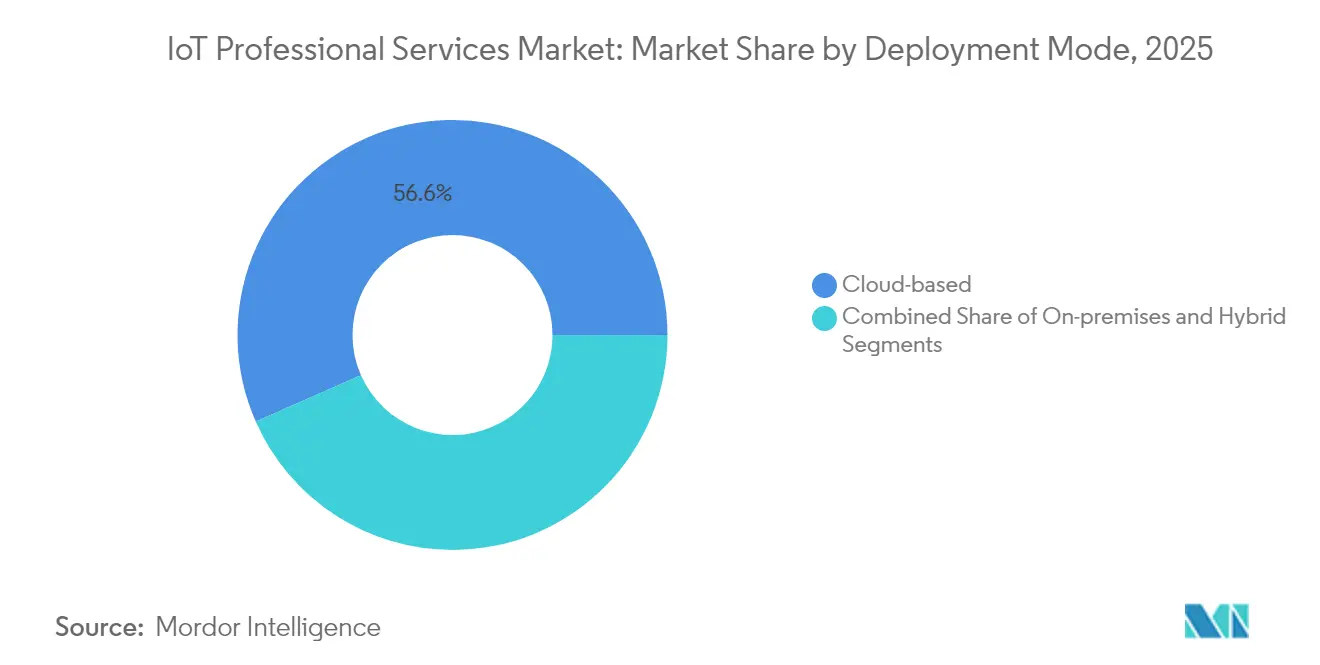
- By deployment mode, cloud-based delivery held 56.60% share of the IoT professional services market size in 2025 and is rising at an 8.08% CAGR.
- By end-user industry, manufacturing captured 25.45% revenue share in 2025, whereas healthcare is set to grow at 7.52% CAGR through 2031.
- By geography, North America retained 36.95% share in 2025, but Asia Pacific is on track for an 7.88% CAGR to 2031.
Note: Market size and forecast figures in this report are generated using Mordor Intelligence’s proprietary estimation framework, updated with the latest available data and insights as of 2026.
Global IoT Professional Services Market Trends and Insights
Drivers Impact Analysis*
| Driver | (~) % Impact on CAGR Forecast | Geographic Relevance | Impact Timeline |
|---|---|---|---|
| Proliferation of connected devices and falling sensor costs | +1.8% | Global, with Asia-Pacific leading adoption | Medium term (2-4 years) |
| Enterprise digital-transformation roadmaps | +1.5% | North America and EU primary, Asia-Pacific emerging | Long term (≥ 4 years) |
| 5G and edge-computing rollout | +1.2% | North America, China, South Korea early deployment | Medium term (2-4 years) |
| Regulatory push for Industry 4.0 and smart infrastructure | +0.9% | EU, Japan, Singapore policy-driven | Long term (≥ 4 years) |
| Outcome-based pricing models for IoT services | +0.6% | Global, with enterprise focus | Short term (≤ 2 years) |
| AI-driven AIOps platforms creating integration demand | +0.8% | North America, China, advanced economies | Medium term (2-4 years) |
| Source: Mordor Intelligence | |||


Proliferation of Connected Devices and Falling Sensor Costs
Global connected-device volumes climbed to 18.8 billion units, stretching enterprise capacity to manage diverse hardware, firmware, and communication protocols. Lower sensor prices make large-scale rollouts financially viable, yet device heterogeneity magnifies lifecycle-management complexity. Professional-service partners are therefore asked to design provisioning, configuration, and monitoring frameworks that accommodate multivendor fleets. Lightweight M2M, Zero-Touch onboarding, and secure element authentication are gaining traction as best-practice blueprints. Edge-computing investment, projected to total USD 378 billion by 2028, further amplifies demand for integration services that balance on-premises processing with cloud analytics.
Enterprise Digital-Transformation Roadmaps
Boards increasingly treat IoT data as a strategic asset, folding connected-device projects into broader digital-core programs. IBM reported USD 4.96 billion in consulting revenue tied to digital-transformation engagements, underscoring the shift from isolated pilots to enterprise-wide modernization.[1]International Business Machines Corporation, “2024 Annual Report,” ibm.comService providers are now evaluated on their ability to map operational KPIs to sensor architectures and analytics pipelines that deliver measurable ROI. Outcome-based pricing is gaining favor as buyers demand guarantees on uptime, cost savings, or revenue uplift. As digital cores mature, demand rises for managed-service wraps that continuously optimize device, network, and application performance.
5G and Edge-Computing Rollout
Ultra-reliable low-latency communication enabled by 5G permits time-critical automation that was infeasible on legacy networks. GSMA case studies cite 15–20% productivity gains in smart-factory settings when 5G and edge analytics are combined.[2]GSMA, “Digital Nations Report 2024,” gsma.com To unlock these benefits, enterprises need partners versed in network slicing, private-core deployment, and edge-orchestration tooling. Integrators are packaging reference architectures that blend radio-access, MEC nodes, and IoT platforms into turnkey stacks. The result is a sizable addressable market for planning, spectrum strategy, site engineering, and KPI-driven optimization services.
Regulatory Push for Industry 4.0 and Smart Infrastructure
Policy initiatives such as Malaysia’s Industry4WRD, which targets a 30% productivity uplift in manufacturing, create structured demand for compliance-oriented IoT consulting.[3]Ministry of International Trade and Industry, “Industry4WRD Policy Blueprint,” miti.gov.my In the EU, forthcoming cybersecurity labeling rules oblige manufacturers to embed security-by-design, prompting a surge in certification and audit engagements. Singapore’s multilevel Cybersecurity Labelling Scheme exerts similar pressure in Southeast Asia. Providers able to pair technical depth with regulatory fluency are capturing premium fees for gap assessments, remediation roadmaps, and certification support.
Restraints Impact Analysis*
| Restraint | (~) % Impact on CAGR Forecast | Geographic Relevance | Impact Timeline |
|---|---|---|---|
| Data-privacy and cyber-security concerns | -1.4% | Global, with EU GDPR compliance focus | Short term (≤ 2 years) |
| Interoperability and standards fragmentation | -1.1% | Global, particularly affecting SME adoption | Medium term (2-4 years) |
| Shortage of skilled IoT talent | -0.9% | North America, EU, developed markets | Long term (≥ 4 years) |
| Carbon-footprint scrutiny of hyperscale cloud workloads | -0.3% | EU, North America sustainability mandates | Long term (≥ 4 years) |
| Source: Mordor Intelligence | |||
Data-Privacy and Cyber-Security Concerns
Ordr found 82% of healthcare IoT environments host at least one serious vulnerability, fuelling board-level anxiety over ransomware, safety risks, and regulatory fines. Enterprises therefore require layered defenses ranging from secure-boot chips to encrypted data pipelines and micro-segmented networks. The skills needed cut across embedded security, OT protocols, and cloud IAM, yet most IT teams remain understaffed. Service providers investing in SOC-as-a-service, red-team testing, and zero-trust reference architectures are best placed to convert security fears into multi-year retainer contracts.
Interoperability and Standards Fragmentation
Competing protocols such as MQTT, OPC UA, LoRaWAN, and 3GPP LPWA complicate cross-vendor collaboration, especially for SMEs that lack in-house architects. Integration projects often stall while teams reconcile data models, quality-of-service settings, and management APIs. Middleware accelerators, API gateways, and pre-certified device libraries are emerging to bridge gaps, but professional-service expertise remains essential to map disparate systems into coherent digital threads. Fragmentation therefore slows adoption, yet also creates recurring revenue for integrators able to deliver vendor-agnostic blueprints and reference kits.
*Our forecasts treat driver/restraint impacts as directional, not additive. The impact forecasts reflect baseline growth, mix effects, and variable interactions.
Segment Analysis
By Service Type: Consulting Leads Integration Growth
IoT consulting retained 32.10% revenue share in 2025, reflecting sustained demand for vendor-neutral strategy, ROI modeling, and business-case validation. System design and integration, however, is expanding at a 7.05% CAGR as enterprises convert roadmaps into production rollouts that involve complex middleware, data lake, and analytics orchestration. Providers differentiate via domain accelerators, reference architectures, and outcome-based contracts that link fees to plant-floor uptime or energy-efficiency gains. The IoT professional services market size for design and integration is projected to widen sharply as 5G and edge projects graduate from pilot to scale.
Momentum is also building in managed-service wraps that combine device monitoring, predictive maintenance, and remote-update orchestration. Suppliers bundle platform subscriptions with SLA-backed operations centers to secure annuity revenue and deepen client lock-in. As integration complexity rises, tooling investments in CI/CD for firmware, digital twin simulation, and AI-driven test automation become table stakes for staying competitive in the IoT professional services market.


By Organization Size: SME Acceleration Drives Market Expansion
Large enterprises generated 63.05% of 2025 spending due to diversified portfolios, global supply chains, and sizeable modernization budgets. Yet SMEs are the fastest-growing buyer group at a 7.28% CAGR, enabled by pay-as-you-go cloud platforms that cut capital outlay and compress deployment timelines. For SMEs, service partners must offer packaged starter kits, modular pricing, and financing bridges that align costs with near-term cash flows. Providers that tailor governance templates, security baselines, and ROI dashboards to resource-constrained teams gain decisive advantage within this swelling sub-segment of the IoT professional services market.
In larger accounts, volume scale yields multi-tower engagements that span advisory, integration, and managed run operations. Projects often feature phased global rollouts coordinated through hybrid delivery centers. In contrast, SME deals emphasize rapid time to value, pre-configured integrations with ERP and CRM, and vertical templates such as cold-chain monitoring or energy sub-metering. This bifurcation forces suppliers to run dual go-to-market motions, preserving depth for Fortune 500 clients while industrializing delivery for high-velocity SME opportunities across the IoT professional services market.
By Deployment Mode: Cloud Dominance Accelerates
Cloud-based delivery captured 56.60% revenue share in 2025 and is expanding at an 8.08% CAGR. Buyers appreciate elastic scaling, built-in AI services, and consumption billing that aligns spend with data volume. Edge-to-cloud reference architectures dominate RFP requirements, with Kubernetes-based orchestration linking on-premises gateways to hyperscale AI engines. The IoT professional services market size for cloud implementations is forecast to outpace on-premises projects by more than 2:1 during the outlook period.
On-premises deployments persist in regulated domains such as defense, utilities, and pharma, where data residency and deterministic latency remain non-negotiable. Hybrid models are therefore gaining ground, blending local processing for critical workloads with cloud analytics for non-sensitive insights. Service partners must master container portability, multi-cloud policy enforcement, and FinOps disciplines to optimize total cost of ownership across mixed environments in the IoT professional services market.
By End-User Industry: Healthcare Disrupts Manufacturing Leadership
Manufacturing commanded 25.45% of 2025 revenue, leveraging IoT for predictive maintenance, quality assurance, and real-time asset tracking. Smart-factory deployments now lean heavily on edge AI for defect detection and energy optimization, fueling continuous demand for plant-floor integration and OT-IT convergence skills. Nevertheless, healthcare is the fastest-growing vertical at a 7.52% CAGR, propelled by remote patient monitoring, smart infusion pumps, and asset-location services. As hospitals modernize legacy infrastructure and pursue value-based care, spending on secure connectivity, data governance, and analytics soars within the IoT professional services market.
Retail, energy, and logistics also present sizable pipelines, each demanding verticalized blueprints that address regulatory nuance, legacy integration, and outcome measurement. For example, utilities prioritize safety-critical SCADA integration, while retailers focus on frictionless checkout and supply-chain cold-chain monitoring. Service providers that offer modular, compliance-ready accelerators can replicate wins across industries and strengthen wallet share in the broader IoT professional services market.
Geography Analysis
North America retained 36.95% of 2025 revenue, supported by advanced 5G coverage, robust venture funding, and federal initiatives such as NIST’s national IoT strategy. Enterprises in the United States prioritize zero-trust security and AI-enabled analytics, driving complex multi-tower engagements that favor providers with end-to-end portfolios. Canada benefits from near-shoring trends and industrial IoT modernization, while Mexico leverages cross-border manufacturing corridors that rely on real-time supply-chain visibility.
Asia-Pacific is the fastest-growing region at an 7.88% CAGR. China allocates sizable smart-city budgets and promotes Industrial Internet platforms to digitize manufacturing. Japan’s Society 5.0 program and Singapore’s Smart Nation initiatives reinforce regional demand for compliance-ready, scalable solutions. India’s semiconductor and AI policies further expand the addressable base. Providers must balance cost-competitive delivery with deep cultural alignment and local-language support to capitalize on this momentum in the IoT professional services market.
Europe maintains steady growth underpinned by GDPR, the EU Cybersecurity Act, and national Industry 4.0 frameworks that create governance-driven demand for consulting and certification support. Germany, France, and the United Kingdom invest heavily in digital-twin programs, while Eastern European economies leverage EU funds to modernize infrastructure. Middle East and Africa remain nascent but show promise as Gulf states accelerate Vision 2030 smart-city portfolios that require turnkey professional-service engagement.

Competitive Landscape
The IoT professional services market remains moderately fragmented. Accenture generated USD 64.9 billion in FY 2024 revenue and leverages a global network of innovation hubs to capture large transformation deals. IBM combines consulting, Red Hat OpenShift, and Maximo asset-management suites to deliver end-to-end offerings that resonate in industrial sectors. Cognizant’s 2024 acquisitions of Thirdera and Belcan deepen edge-AI and digital-engineering skills that underpin automotive, aerospace, and healthcare wins.
Specialist firms such as Bosch.IO and Virtusa compete through vertical focus and agile delivery, often partnering with hyperscalers to co-sell solution bundles. Platform owners, including Siemens, accelerate service pull-through via acquisitions like Brightly Software, adding CMMS capabilities that complete digital-twin stacks. Telecommunications operators, led by AT&T and Vodafone, leverage private-5G offerings to secure integration and managed-service fees tied to campus-network rollouts.
Emerging trends include AI-driven automation in service delivery, expansion of outcome-based contracts, and investment in training academies to close critical talent gaps. Providers that embed generative AI for code generation, test-case automation, and anomaly prediction shorten deployment cycles and boost margins. Meanwhile, recurring managed services tied to SLAs on uptime, energy reduction, or production throughput secure multi-year revenue streams, prompting incumbents to pivot from time-and-materials toward value-linked engagement models in the IoT professional services market.
IoT Professional Services Industry Leaders
Accenture PLC
IBM Corporation
Tata Consultancy Services
Cognizant
Capgemini SE
- *Disclaimer: Major Players sorted in no particular order

Recent Industry Developments
- April 2025: Qualcomm acquired Edge Impulse to bolster edge-AI capabilities for connected devices.
- February 2025: Cognizant posted Q4 2024 revenue of USD 5.1 billion, citing growth from AI-led platforms and recent acquisitions that expand IoT offerings.
- November 2024: FPT Software was named a Disruptor in the HFS Horizons IoT Provider report after completing 500+ projects and training 3,000 engineers.
- October 2024: Microsoft reported USD 65.6 billion in quarterly revenue, with Azure services rising 33% year-over-year, underscoring demand for cloud-enabled IoT workloads.


Research Methodology Framework and Report Scope
Market Definitions and Key Coverage
Our study treats the IoT professional services market as the global revenue pool generated when third-party specialists design, integrate, secure, and support connected-device solutions across enterprise settings. The covered services include consulting, infrastructure readiness, system design and integration, support, training, and technical hand-holding that maximize IoT return on investment.
Scope Exclusion: Managed connectivity bundles and generic cloud hosting that charge recurring network fees fall outside this definition.
Segmentation Overview
- By Service Type
- IoT Consulting
- IoT Infrastructure Services
- System Design and Integration
- Others
- By Organization Size
- Small and Medium Enterprises (SMEs)
- Large Enterprises
- By Deployment Mode
- Cloud-based
- On-premises
- Hybrid
- By End-user Industry
- Manufacturing
- Retail
- Healthcare
- Energy and Utilities
- Transportation and Logistics
- Other Industries
- By Geography
- North America
- United States
- Canada
- Mexico
- South America
- Brazil
- Argentina
- Rest of South America
- Europe
- Germany
- United Kingdom
- France
- Italy
- Spain
- Russia
- Rest of Europe
- Asia-Pacific
- China
- Japan
- India
- South Korea
- Australia
- Rest of Asia-Pacific
- Middle East and Africa
- Middle East
- GCC
- Turkey
- Israel
- Rest of Middle East
- Africa
- South Africa
- Nigeria
- Rest of Africa
- Middle East
- North America
Detailed Research Methodology and Data Validation
Primary Research
We interviewed system integrators, telecom architects, OT engineers in manufacturing plants, and CIOs across North America, Europe, and Asia-Pacific. Their insights refined pricing ladders, clarified average project duration, and gauged likely budget shifts once 5G private networks mature, thereby letting us stress-test assumptions harvested from secondary material.
Desk Research
Mordor analysts began with authoritative open data trade filings from the International Trade Centre, industry spending trackers published by the OECD and the U.S. Bureau of Economic Analysis, technology adoption surveys from GSMA Intelligence, patent families indexed in Questel, and peer-reviewed IEEE papers that quantify device density and protocol shifts. These benches establish historical spending arcs and regional adoption curves. Additional texture came from annual reports, 10-Ks, investor decks, and policy notes issued by bodies such as the European Commission and NIST, which clarify regulatory catalysts for Industry 4.0 rollouts. Subscription databases, Dow Jones Factiva for deal flow and D&B Hoovers for vendor financials, supplied firm-level revenue signals that anchor service mix splits. The sources listed are illustrative; many others supported data validation and interpretation.
Market-Sizing and Forecasting
An initial top-down construct rolls global enterprise digital transformation outlays into an IoT adoption funnel, then applies service penetration ratios derived from primary interviews. Select bottom-up checks, supplier roll-ups and sampled average selling price times project counts, calibrate the totals and flag anomalies. Key model drivers include connected device installed base, average integration hours per deployment, service day rates, regional wage differentials, cybersecurity compliance milestones, and edge computing uptake. A multivariate regression blends these variables and projects demand to 2030, while scenario analysis tests upside (sovereign 5G investment) and downside (data sovereignty pushback) cases. Missing granular data points are bridged with conservative analogs from adjacent IT services pools and verified in follow-up calls.
Data Validation and Update Cycle
Outputs pass a three-layer review: automated variance scans, senior analyst peer checks, and lead author sign-off. Mordor Intelligence refreshes the full model annually; mid-cycle, we reopen inputs if mergers, regulatory shifts, or macroeconomic jolts alter core assumptions. Before release, an analyst reruns the latest quarter's indicators so clients always receive the freshest view.
Why Mordor's IoT Professional Services Baseline Earns Trust
Published estimates rarely align because each firm tweaks scope, price inflators, or refresh cadence; understanding these levers is critical before budgets are set.
Key gap drivers stem from (a) whether managed connectivity is included, (b) how aggressively cloud migration premiums are layered onto consulting revenue, and (c) if forecasts roll forward pre-pandemic growth without post-2022 project deferrals that our interviews surfaced.
Benchmark comparison
| Market Size | Anonymized source | Primary gap driver |
|---|---|---|
| USD 144.84 B (2025) | Mordor Intelligence | - |
| USD 132.5 B (2024) | Global Consultancy A | Excludes training and support services, uses 2021 wage index unchanged |
| USD 195.26 B (2024) | Industry Association B | Bundles managed connectivity and device maintenance within service total |
| USD 116.7 B (2022) | Trade Journal C | Older base year, projects linear growth, no primary validation |
These comparisons show that when service boundaries blur or older baselines roll forward unchecked, totals swing widely. By anchoring to clearly stated service lines, fresh wage indices, and live practitioner input, Mordor provides a balanced, reproducible baseline that decision makers can depend on.


Key Questions Answered in the Report
What is the current IoT professional services market size?
The market generated USD 154.58 billion in 2026 and is projected to reach USD 214.08 billion by 2031.
Which service type leads the IoT professional services market?
IoT consulting holds the top position with 32.10% share, though system design & integration is growing fastest at a 7.05% CAGR.
How fast is cloud deployment growing within the IoT professional services market?
Cloud-based delivery is advancing at an 8.08% CAGR, the quickest among deployment modes.
Which region offers the highest growth opportunity?
Asia Pacific shows the strongest upside with an 7.88% CAGR driven by manufacturing modernization and government digital programs.
What is the main restraint facing IoT professional services adoption?
Cyber-security and data-privacy concerns remain the leading barrier, lowering the overall growth trajectory by an estimated 1.4 percentage points.
Page last updated on:


