
Market Overview
| Study Period | 2020 - 2031 |
|---|---|
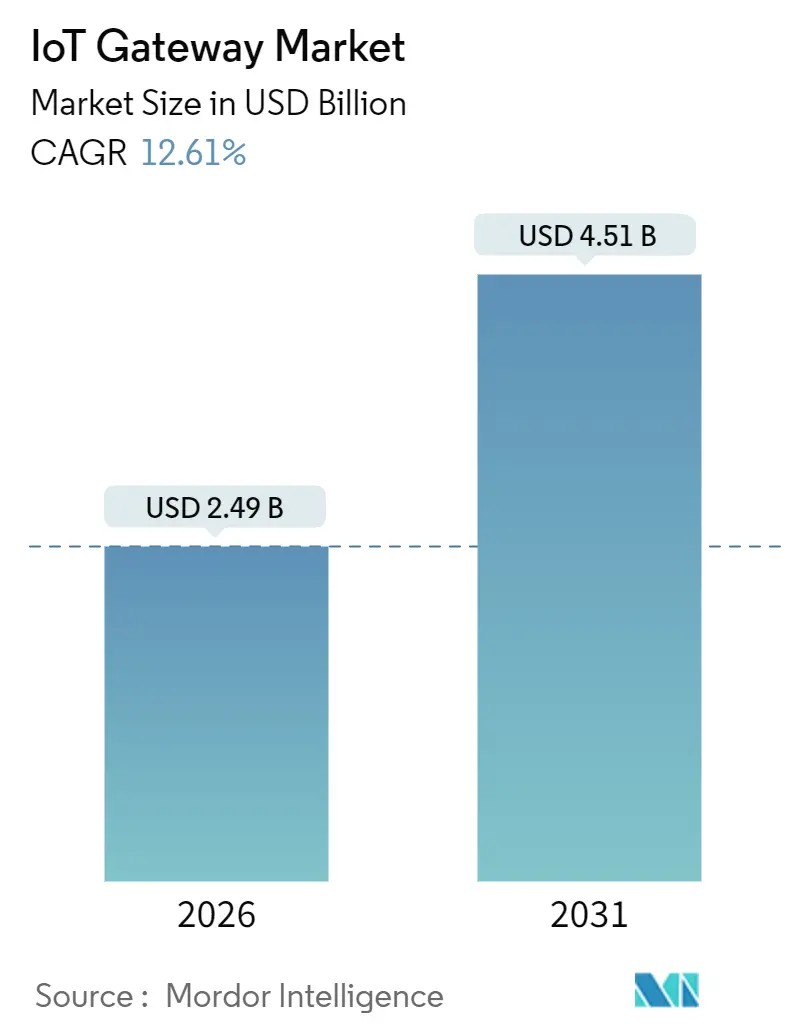
| Market Size (2026) | USD 2.49 Billion |
| Market Size (2031) | USD 4.51 Billion |
| Growth Rate (2026 - 2031) | 12.61 % |
| Fastest Growing Market | Asia Pacific |
| Largest Market | North America |
| Market Concentration | Medium |
Major Players *Disclaimer: Major Players sorted in no particular order Image © Mordor Intelligence. Reuse requires attribution under CC BY 4.0. | |
IoT Gateway Market Analysis by Mordor Intelligence
The IoT gateway market size reached USD 2.49 billion in 2026 and is projected to climb to USD 4.51 billion by 2031, advancing at a 12.61% CAGR during the forecast span. The expansion reflects a structural redesign in distributed computing, where gateways run containerized AI workloads at the network edge, trimming round-trip latency below 10 milliseconds for industrial automation and clinical monitoring. Early 5G standalone roll-outs, the arrival of Wi-Fi 7 backhaul, and the inclusion of neural processing units inside gateway SoCs are compressing deployment costs and broadening performance headroom. At the same time, private-network slicing helps enterprises segregate operational traffic from public routes, raising adoption among manufacturers that need deterministic throughput. Cyber-secure lifecycle management, led by eSIM activation and hardware root-of-trust, is becoming a non-negotiable purchase criterion as threat actors intensify attacks on operational technology assets.
Key Report Takeaways
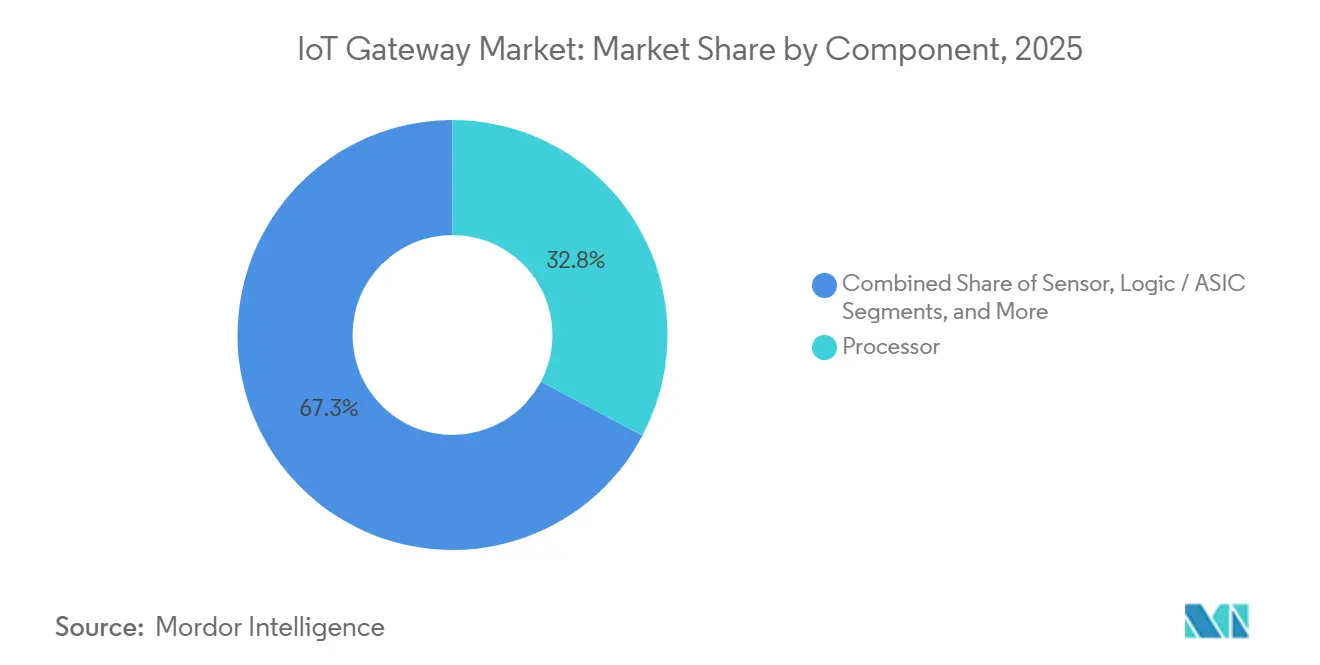
- By component, processors held 32.75% of IoT gateway market share in 2025, while connectivity ICs are on track to expand at a 13.11% CAGR through 2031.
- By end-user industry, industrial manufacturing accounted for 29.84% of the IoT gateway market size in 2025 and healthcare is progressing at a 12.98% CAGR during 2026-2031.
- By deployment environment, DIN-rail gateways commanded 34.74% share in 2025, whereas rugged outdoor units are projected to advance at a 13.33% CAGR.
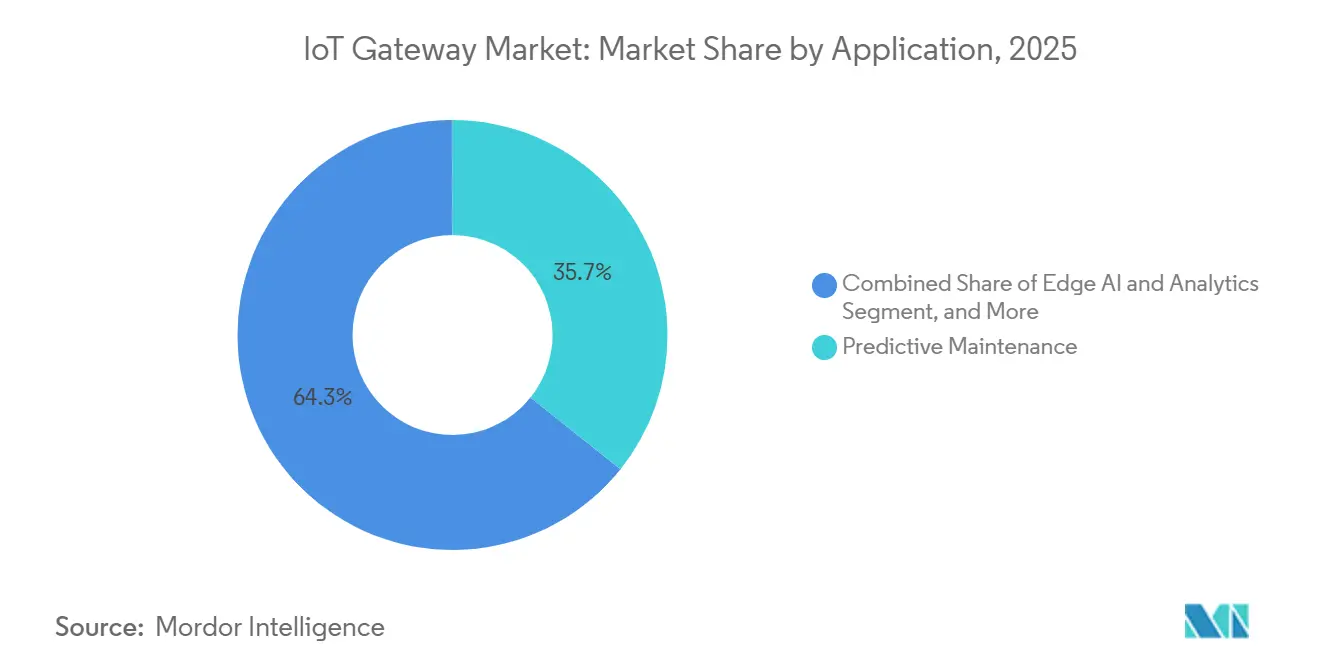
- By application, predictive maintenance led with 35.73% share of the IoT gateway market size in 2025 and edge AI is set to grow at a 13.55% CAGR.
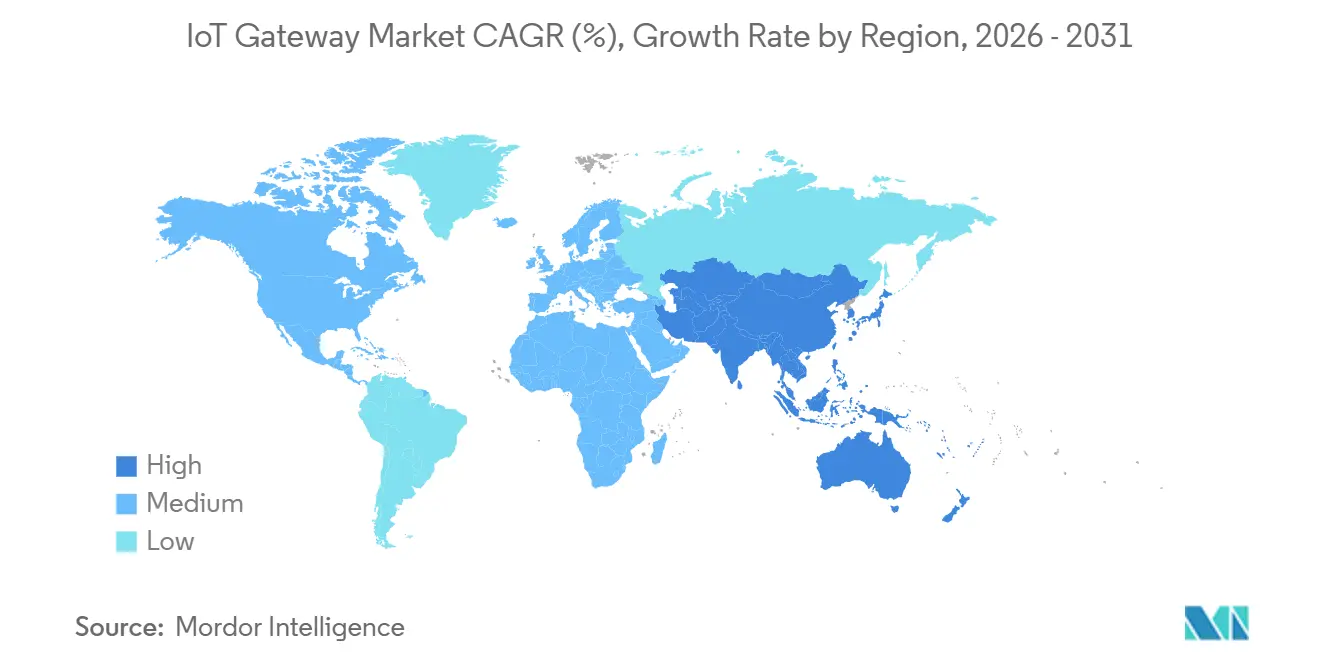
- By geography, North America captured 38.74% share in 2025; Asia-Pacific is poised for a 13.66% CAGR through 2031.
Note: Market size and forecast figures in this report are generated using Mordor Intelligence’s proprietary estimation framework, updated with the latest available data and insights as of January 2026.
Market Trends and Insights
Drivers Impact Analysis of IoT Gateway Market*
| Driver | (~) % Impact on CAGR Forecast | Geographic Relevance | Impact Timeline |
|---|---|---|---|
| 5G-enabled low-latency edge connectivity roll-outs | +2.8% | Global, with early density in South Korea, UAE, and US metro clusters | Short term (≤ 2 years) |
| Industry 4.0 adoption and factory edge analytics | +2.4% | Europe and Asia-Pacific manufacturing corridors, spillover to Mexico and Vietnam | Medium term (2-4 years) |
| Rapid smart-city LPWAN gateway deployments | +1.9% | Asia-Pacific urban centers, selective EU smart-city initiatives | Medium term (2-4 years) |
| AI/ML inference moving from cloud to gateway silicon | +2.6% | North America and Asia-Pacific, limited adoption in cost-sensitive MEA markets | Long term (≥ 4 years) |
| Telco private-network slicing for secure IoT backhaul | +1.7% | Enterprise campuses in North America, Europe, and Australia | Medium term (2-4 years) |
| Growing OEM demand for eSIM-based secure lifecycle management | +1.3% | Global, with regulatory tailwinds in EU (eIDAS 2.0) and US (CMMC 2.0) | Long term (≥ 4 years) |
| Source: Mordor Intelligence | |||


5G-Enabled Low-Latency Edge Connectivity Roll-Outs
Enterprises are adopting 5G standalone cores that guarantee sub-20 millisecond latency, enabling gateways to control collaborative robots and augmented-reality service tools in real time. Qualcomm’s QCS8550 processor combines a 5G RedCap modem with a 12 TOPS AI engine, letting factory operators keep high-throughput vision inference on-premises while sending model retraining jobs to the cloud.[1]Qualcomm, “Qualcomm QCS8550 IoT Processor,” qualcomm.com Private 5G sites increased by 140% year over year, with gateway shipments into automotive plants accounting for 38% of that volume.[2]Ericsson, “Ericsson Mobility Report 2025,” ericsson.com RedCap became commercially available in mid-2025, however, most battery-powered sensors still rely on LTE-M, resulting in a two-tier architecture with high-bandwidth and low-power links. Early adopters report that deterministic latency cuts unplanned production stoppages by enabling microsecond-level machine coordination.
Industry 4.0 Adoption and Factory Edge Analytics
Manufacturers embed IoT gateways in CNC machines and conveyors to run predictive maintenance models that flag bearing failures 72 hours in advance, cutting downtime by nearly one-third. Siemens delivered more than 50,000 Industrial Edge gateways in 2024, each shipping with a marketplace for containerized analytics apps.[3]Siemens, “Industrial Edge,” siemens.com ABB’s Ability Edgenius platform, launched in March 2025, enables maintenance teams to deploy TensorFlow Lite models via a drag-and-drop interface, eliminating the need for data science staff.[4]ABB, “ABB Ability Edgenius,” abb.com While the return on investment is proven, air-gapped operational networks hinder over-the-air patching; many facilities still use USB keys for firmware updates, thereby extending the mean time to remediation for critical patches.
Rapid Smart-City LPWAN Gateway Deployments
Urban authorities in China, India, and the Gulf states are installing LoRaWAN and NB-IoT gateways on street furniture to monitor air quality, parking, and waste collection. China Mobile surpassed 300 million NB-IoT endpoints by December 2024, anchoring volume economics for ultra-narrowband silicon. Municipal managers report sensor battery life of over five years, resulting in reduced truck rolls for maintenance. European cities such as Lyon are layering Wi-Fi 7 backhaul onto LPWAN clusters to aggregate traffic into edge nodes that can execute basic analytics before forwarding summaries to the cloud. Government funding tied to sustainability goals accelerates deployment, yet procurement cycles remain long because each new gateway must comply with evolving cybersecurity rules.
AI/ML Inference Moving From Cloud to Gateway Silicon
Chipmakers now integrate neural processing units directly into gateway SoCs, delivering 1-8 TOPS of INT8 inference at sub-10-watt power budgets. Intel’s Atom x6000E line ships with a 1.5 TOPS accelerator and Time-Coordinated Computing for deterministic scheduling. NXP’s Ara-1 device reaches 8 TOPS while meeting ISO 26262 ASIL-B requirements, unlocking functional-safety use cases in automotive V2X gateways. Local inference avoids recurring cloud fees that can reach seven-figure sums in camera-rich factories, however, device fleets now require orchestrated model rollouts to sustain accuracy as operating conditions change. Bootloaders with A-B partitions and encrypted payloads are gaining favor to ensure rollback should an update malfunction.
Restraints Impact Analysis of IoT Gateway Market*
| Restraint | (~) % Impact on CAGR Forecast | Geographic Relevance | Impact Timeline |
|---|---|---|---|
| Fragmented protocol standards and legacy integration cost | -1.8% | Global, acute in brownfield industrial sites with 20+ year-old equipment | Short term (≤ 2 years) |
| Escalating cyber-attack surface at distributed gateways | -2.1% | North America and Europe, where ransomware targeting OT networks intensified post-2023 | Short term (≤ 2 years) |
| Short refresh cycles driving CAPEX and e-waste concerns | -1.4% | Europe and North America, with regulatory pressure from EU WEEE Directive and circular economy mandates | Medium term (2-4 years) |
| Uneven global 5G coverage limiting advanced use-cases | -1.6% | Emerging markets in Africa, South America, and rural Asia-Pacific where 5G penetration remains below 15% | Long term (≥ 4 years) |
| Source: Mordor Intelligence | |||
Fragmented Protocol Standards and Legacy Integration Cost
Gateways juggle Modbus RTU, OPC UA, MQTT, CoAP, and vendor-specific fieldbus, forcing separate software stacks that bloat firmware images and complicate quality assurance. IEEE research shows conversion bugs trigger nearly half of gateway downtime, with data-type mismatches between Modbus and MQTT topping the list. While the Matter protocol gained momentum in smart homes, only a minority of industrial gateways shipped in 2025 support it, leaving factories to maintain parallel stacks indefinitely. Retrofitting a decade-old PLC with Ethernet/IP can cost more than replacing the controller, stalling upgrade projects in cash-constrained plants. OEMs respond by shipping modular gateway mezzanine cards, but these add BOM cost and lengthen certification cycles.
Escalating Cyber-Attack Surface at Distributed Gateways
Each deployed gateway exposes web services, message brokers, or SSH consoles that adversaries probe for privilege escalation. A 2024 CISA advisory listed 14 critical vulnerabilities across major gateway brands, including Remote Code Execution flaws in default management dashboards. Digi International’s annual security audit disclosed that 22% of its installed base ran firmware more than 18 months old, highlighting slow patch uptake. IEC 62443 certification enforces secure boot and signed updates, yet it stops short of mandating continuous runtime monitoring, leaving space for intrusion that hijacks sensor payloads. The Ponemon Institute pegs the average cost of an IoT-related breach at USD 4.2 million, with gateways the initial point of compromise in almost one-third of incidents.
*Our forecasts treat driver/restraint impacts as directional, not additive. The impact forecasts reflect baseline growth, mix effects, and variable interactions.
IoT Gateway Market Segment Analysis
By Component:
Connectivity ICs Outpace Processors in Mixed-Radio DesignsConnectivity IC revenue is forecast to expand at 13.11% CAGR during 2026-2031 as multi-radio boards demand discrete RF front-ends for Wi-Fi 7, Bluetooth LE, and 5G RedCap. Qualcomm’s tri-band Wi-Fi 7 chipset generates 5.8 Gbps peak throughput, meeting vision inspection workloads that stream 4K video from production lines. Processors remain the largest line item because they anchor compute and security; yet, their growth lags as OEMs extend life cycles to recoup R&D investments. The IoT gateway market size for connectivity ICs is expected to surpass USD 1 billion by 2031, if unit forecasts hold.
Edge AI inflection reshapes processor criteria. Intel and NXP bundle 1-8 TOPS accelerators plus deterministic clocks, commanding a 23% price premium that OEMs gladly pay to differentiate on inference latency. Memory and storage commoditize, though NOR flash with Execute-in-Place (XiP) retains margin because secure boot demands it. Power-management ICs are designed to accommodate wider input voltage ranges, aligning with global certification standards.


By End-User Industry:
Healthcare Surges, Manufacturing Holds GroundIndustrial manufacturing claimed 29.84% of IoT gateway market size in 2025, supported by predictive maintenance and collaborative robots that need real-time failsafe signals. Siemens, ABB, and Schneider Electric integrate gateways into PLC cabinets to simplify procurement. Healthcare grows at 12.98% CAGR as reimbursement frameworks cover remote patient monitoring devices that aggregate vital signs, infusion pump data, and ventilator metrics. A JAMA study reported hospital gateways cut sepsis detection times by six hours, saving critical care beds.
Automotive and transportation sectors leverage V2X gateways for fleet telemetry; however, spectrum allocation delays in the EU are pushing large-scale deployment to 2026. Energy and utilities adopt IP67 gateways in substations for grid balancing, while retail chains install camera-enabled gateways to track footfall, although only one-third realize payback within two years.
By Application:
Edge AI Leads New Value CreationPredictive maintenance held 35.73% share of IoT gateway market size in 2025, leveraging vibration and thermal inputs to cut unscheduled stoppages. Edge AI and analytics is the fastest riser at 13.55% CAGR because running TensorFlow Lite or ONNX locally avoids cloud inference fees that can exceed hardware cost multiples. Intel’s OpenVINO toolkit lets engineers port vision models to gateways with minimal code changes, shortening pilot to production by weeks.
Secure connectivity management gains momentum as enterprises migrate from static VPNs to software-defined zero-trust overlays. Protocol translation gateways grow slowly in greenfield projects that adopt MQTT natively, but they remain relevant in brownfield plants where Modbus devices continue to be in service for decades.
By Deployment Environment:
Rugged Outdoor Units Extend Edge to Harsh SitesDIN-rail gateways retained 34.74% share in 2025, benefiting from mechanical compatibility with factory panels. Rugged outdoor models, sealed to IP67, will outpace the overall IoT gateway market at a 13.33% CAGR as utilities shift their monitoring to remote substations. Portable gateways address construction and event sites where short-term connectivity takes priority over capital expenditure, yet their unit price keeps the adoption niche.
Thermal constraints shape enclosure design; outdoor housings cap processor TDP at 25 watts, limiting AI throughput unless vendors adopt advanced heat-pipe assemblies. Solar charging and five-day battery buffers are becoming mandatory in regions with unreliable grids, particularly in parts of Africa and South America.
Geography Analysis
North America IoT Gateway Market
North America captured 38.74% IoT gateway market share in 2025, bolstered by early 5G standalone deployments and logistics hubs that rely on private LTE for asset tracking. Cisco shipped 180,000 industrial gateways in fiscal 2025, bundling Splunk analytics to differentiate. Canada concentrates on mining and forestry with rugged units that endure sub-zero winters, while Mexico’s nearshoring wave installs greenfield IIoT lines for automotive suppliers.
APAC IoT Gateway Market
Asia-Pacific grows at 13.66% CAGR, the swiftest worldwide. China deploys NB-IoT gateways for smart meters at massive scale, and India rolls out LoRaWAN hubs in agricultural logistics corridors. Japan and South Korea are pioneers in 5G private networks for autonomous mobile robots, whereas Australia utilizes LPWAN for crop and cattle oversight across vast ranches. Regulatory fragmentation, such as India’s pending device security certification, can postpone launches by up to a year.
Europe IoT Gateway Market
Europe held 22% share in 2025. Germany invests heavily under the Industry 4.0 program, France pushes smart-city pilots, and the UK channels post-Brexit policy toward 5G campus networks. The NIS2 Directive mandates IEC 62443 compliance, adding 15-20% to the cost of gateway bills while enhancing baseline security. Southern European adoption trails due to lower automation intensity, and Eastern Europe grows as auto suppliers modernize.
MEA and South America IoT Gateway Market
The Middle East and Africa hold a combined 7% share. The UAE and Saudi Arabia fund mega-projects where thousands of gateways support autonomous mobility and energy management. South America adopts LoRaWAN for irrigation and smart metering, though economic headwinds impede broad rollouts.

Regulatory Landscape
IoT gateway compliance is increasingly shaped by cybersecurity baseline requirements layered on top of radio and EMC rules. In the United States, CISA issued Binding Operational Directive 26-02 in February 2026 for federal civilian agencies, tightening expectations around asset inventory, patching cadence, and the retirement of end-of-support edge devices that often include gateways. NIST also updated guidance for IoT product manufacturers with IR 8259r1 in April 2026, reinforcing secure development, vulnerability handling, and lifecycle support practices that flow into gateway vendor requirements.
Regionally, standards and conformity regimes continue to affect time-to-market and BOM decisions. India's Telecommunication Engineering Centre (TEC) notified revised IoT Gateway standards (TEC 24492607) in June 2026, adding a specific national reference point for gateway certification alongside established requirements such as FCC Part 15 (US) and EU RED (2014/53/EU). In Europe, the EU Cyber Resilience Act (CRA) raises secure-by-design and secure-by-default expectations for connected products, pushing gateway suppliers to strengthen secure boot, signed updates, and vulnerability disclosure processes to maintain access to regulated enterprise and public-sector procurements.
Value Chain Analysis
The IoT gateway value chain starts with silicon and connectivity building blocks (processors, connectivity ICs, cellular modules, security elements) supplied by semiconductor vendors, then moves to gateway OEMs and industrial computer manufacturers that integrate compute, multi-radio connectivity, and hardened enclosures into DIN-rail, embedded, and rugged outdoor form factors. Platform and software layers, including edge orchestration and device-management stacks, form a parallel value stream, with deployments commonly standardized around cloud-adjacent runtimes (for example, AWS IoT Greengrass in industrial edge environments) and security components aligned to secure-by-design expectations.
Go-to-market typically combines direct enterprise sales (large manufacturing, utilities, healthcare networks), channel partners and distributors, and system integrators that adapt gateways to sector protocols (Modbus, OPC UA, MQTT) and compliance constraints. After deployment, lifecycle management, OTA patching, and security monitoring increasingly influence procurement decisions as agencies and regulated industries respond to tighter patch and end-of-support controls reflected in U.S. federal directives and updated NIST guidance in 2026. This strengthens the position of vendors that can certify, update, and support fleets over multi-year cycles while maintaining supply continuity across multi-radio component stacks.
Competitive Landscape
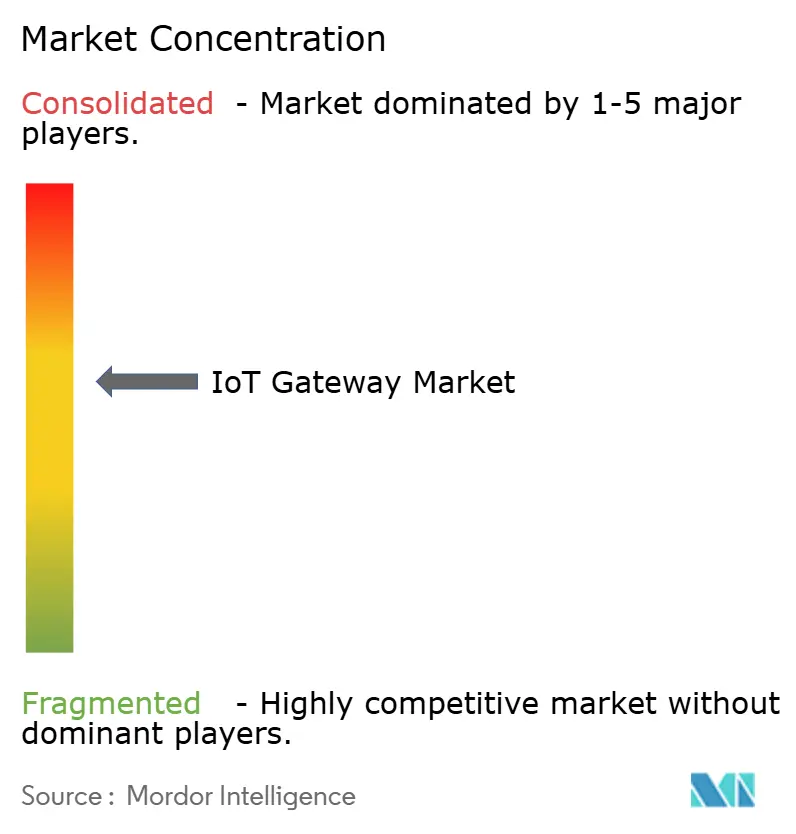
The IoT gateway market is moderately fragmented as the top 10 suppliers command most of combined revenue. Cisco, Advantech, and Dell Technologies leverage existing networking portfolios to upsell edge hardware, while Intel, Qualcomm, and NXP integrate vertically by offering reference designs that shorten OEM time-to-market. Industrial automation incumbents such as Siemens and ABB build gateway logic into PLCs, framing IoT as a feature rather than a separate SKU. Huawei, Nokia, and Ericsson tie gateways to 5G infrastructure deals, bundling radio, core, and edge in a single contract.
Healthcare requires FDA-cleared data paths, prompting Digi International to launch a HIPAA-compliant gateway that targets the USD 400 million remote patient monitoring niche. Oil and gas demand ATEX-certified enclosures, limiting competition to rugged specialists. Start-ups such as Samsara decouple middleware from hardware, letting customers load containerized workloads over the air. IEC 62443 mandates now filter suppliers that lack secure boot or runtime integrity checks, raising barriers for new entrants.
IoT Gateway Industry Leaders
Cisco Systems, Inc.
Advantech Co., Ltd.
Microchip Technology Inc.
Huawei Technologies Co., Ltd.
Dell Technologies Inc.
- *Disclaimer: Major Players sorted in no particular order
IoT Gateway Market Companies Covered in this Report
- Cisco Systems, Inc.
- Advantech Co., Ltd.
- Dell Technologies Inc.
- Microchip Technology Inc.
- Huawei Technologies Co., Ltd.
- Hewlett Packard Enterprise Development LP
- Samsara Inc.
- Eurotech S.p.A.
- ADLINK Technology Inc.
- Kontron AG
- Intel Corporation
- Siemens AG
- NXP Semiconductors N.V.
- Texas Instruments Incorporated
- Sierra Wireless, Inc.
- AAEON Technology Inc.
- Moxa Inc.
- Digi International Inc.
- Schneider Electric SE
- ABB Ltd.
- Qualcomm Incorporated
- Thales Group
- Telit Cinterion Ltd.
- Red Hat, Inc.
- Nokia Corporation
- Ericsson AB
- Cradlepoint, Inc.

Market Opportunities and Future Outlook
Security-by-design gateway portfolios are a visible whitespace area because buyers are turning EU CRA expectations and industrial IEC 62443-driven security requirements into concrete procurement gates. That creates room for products positioned as CRA-ready, built around secure boot, signed updates, and controlled vulnerability handling. Advantech's 2026 introduction of CRA-ready secure edge AI configurations with SecEdge technology on NVIDIA Jetson also points to differentiation moving beyond connectivity into compliance-aligned security architecture and managed lifecycle tooling.
Ecosystem-led scaling is another opportunity, since deployment programs involve operators, device makers, and application partners, particularly in LPWAN and cellular backhaul use cases where regional fragmentation slows rollout. Active partner programs such as Netmore's Pulse Partner Program (launched February 2026) and the Sequans Partner Network show vendors using structured ecosystems to accelerate solution qualification and reduce integration friction for gateways that need certified modem options, eSIM provisioning, and multi-protocol interoperability. At the same time, national standards updates such as India's TEC IoT Gateway revisions (June 2026) create demand for region-specific compliant SKUs and local certification support, favoring suppliers and integrators with established test, labeling, and documentation workflows.
Recent Industry Developments in IoT Gateway Market
- July 2026: Microchip Technology Inc. announced a new 90W Power-over-Ethernet PoE solution aimed at streamlining industrial IoT deployments. The PoE upgrade enables higher edge power for gateways and peripherals, supporting denser sensor deployments and cameras at the edge.
- February 2026: Cisco Systems Inc. announced the commercial activation of a 5G Standalone-native IoT platform, integrating AT&T's SA core with Cisco's Mobility Services Platform. This directly integrates 5G SA with IoT gateway management, enabling deterministic, carrier-grade connectivity for industrial gateways.
- February 2026: Cisco Systems Inc. announced a collaboration with AT&T to power IoT connectivity with eSIM and 5G enabled solutions. The arrangement enhances secure provisioning and scalable management of gateways in large deployments.


IoT Gateway Market Report Scope and Research Methodology
Market Definition and Coverage
For this report, the IoT gateway market is defined as the revenue generated from hardware and software that connects IoT devices and sensors to networks or cloud, and that supports data routing, protocol translation, edge processing, and device connectivity management.
Scope exclusions: The sizing excludes generic enterprise routers and switches that do not perform IoT gateway functions, along with pure cloud IoT platforms that do not ship as gateway products.
Segments Covered in This Report
- By Component
- Processor
- Sensor
- Memory and Storage Device
- Connectivity IC
- Logic / ASIC
- Power Management and Other Components
- By End-User Industry
- Industrial / Manufacturing
- Automotive and Transportation
- Healthcare and Life Sciences
- Consumer Electronics and Smart Home
- Energy and Utilities
- BFSI
- Oil and Gas
- Retail and Hospitality
- Aerospace and Defense
- Agriculture and Smart Farming
- By Application
- Edge AI and Analytics
- Remote Monitoring and Telemetry
- Predictive Maintenance
- Secure Connectivity Management
- Protocol Translation Gateway
- By Deployment Environment (Form Factor)
- DIN-rail / Guide-rail
- Wall-mounted / Cabinet
- Embedded / Board-level
- Rugged Outdoor
- Portable / Mobile
- By Geography
- North America
- United States
- Canada
- Mexico
- South America
- Brazil
- Argentina
- Rest of South America
- Europe
- United Kingdom
- Germany
- France
- Italy
- Spain
- Rest of Europe
- Asia-Pacific
- China
- Japan
- India
- South Korea
- Australia and New Zealand
- Rest of Asia Pacific
- Middle East and Africa
- Middle East
- Saudi Arabia
- United Arab Emirates
- Turkey
- Rest of Middle East
- Africa
- South Africa
- Nigeria
- Rest of Africa
- Middle East
- North America
Data Sources, Market Sizing, and Validation
Desk Research
Desk research is used to set the outer limits of the market and to build the first version of our assumptions for installed base growth and new deployments. We mainly rely on public and official sources such as ITU connectivity indicators, OECD digital economy statistics, NIST cybersecurity guidance (for common security requirements), and standards bodies such as IEEE and IETF to understand protocol and networking direction that affects gateway adoption.
We also review company filings, earnings call commentary, and product documentation to map typical pricing logic and how gateway capabilities are bundled. To cross-check trade and manufacturing signals, we use sources such as UN Comtrade and customs releases, along with press and association updates on industrial automation, energy, and smart building rollouts. Where needed, paid subscriptions are used for company financial intelligence, shipment and trade visibility, and patent databases to validate technology direction. These desk sources are not exhaustive, and many other public references were also used to collect, validate, and clarify data points.
Primary Interviews and Surveys
Primary work is used to confirm what the desk model cannot show clearly, especially which gateway functions are being paid for, what the typical unit-to-project ratios look like, and how pricing moves by deployment environment. We spoke with a mix of product leaders, solution and channel roles, and operational managers across major demand regions so assumptions on adoption, refresh cycles, and edge compute needs could be checked and adjusted before finalizing the market totals.
Distribution of primary research fieldwork respondents
| Company type | Respondent position | Region |
|---|---|---|
| Top tier: 34% | CXOs: 13% | APAC: 51% |
| Mid tier: 49% | Functional/Unit leaders: 32% | EMEA: 31% |
| Smaller Players: 17% | Managers: 55% | Americas: 18% |
Market-Sizing & Forecasting
Sizing starts from a top-down demand pool, where connected endpoint growth and network modernization indicators are translated into likely gateway deployments by use case and environment. From there, expected unit volumes are combined with blended pricing ranges, and the totals are adjusted using inputs from interviews on configuration mix, security features, and edge compute requirements.
To keep the model grounded, we corroborate it with selective bottom-up checks, such as sampling gateway product revenue disclosures, using channel feedback on project sizes, and running a few ASP (average selling price) times volume cross-checks across applications. Inputs that matter most include enterprise edge computing uptake, industrial automation investment cycles, cellular and Ethernet penetration in remote sites, typical device-to-gateway ratios by venue type, and replacement cycles tied to security updates and connectivity upgrades. Where direct values are missing, gaps are handled by using proxy indicators (like site counts or equipment density) that are then re-tested with primary respondents for reasonableness.
Forecasts are built using scenario analysis supported by trend lines on device growth, edge analytics adoption, and connectivity upgrades, and then stress-tested against macro spending signals discussed by interviewees. A short set of scenarios is maintained so the forecast remains usable when near-term deployment timing changes.
Data Validation & Update Cycle
Validation is done by triangulating the modeled totals against independent checks such as shipment signals, project pipeline commentary, and adoption benchmarks drawn from interviews. Outliers are flagged, and assumptions are revisited when a region, industry, or deployment environment shows a jump that cannot be explained by real demand drivers.
Before sign-off, the model goes through multi-step analyst reviews, including internal consistency checks across volumes, pricing, and growth rates, and then a targeted re-contact process if key parameters drift. Reports are refreshed annually, and interim updates are made when major events materially change adoption or pricing. Right before delivery, a final review pass is completed so clients receive the most current view available.
Mordor Intelligence's IOT Gateway Market Size Versus Other Published Estimates
Published numbers for IoT gateway market size can vary a lot, even when they sound like they measure the same thing. Differences usually come from what gets counted as a gateway, whether software and services are included, and how base-year timing and currency conversion are handled.
Some external estimates fold adjacent categories such as IoT nodes, modules, or broader networking equipment into the total, which can lift the value quickly. In Mordor Intelligence's estimate, only dedicated IoT gateway products and related software revenue tied to gateway functionality are counted, and the published total is refreshed to a 2026 base with the latest validation pass.
Benchmark comparison
| Source | Market Size | Gaps in Research Methodology |
|---|---|---|
| Mordor Intelligence | USD 2.49 B (2026) | |
| Trade Journal A | USD 1.99 B (2024) | Uses an earlier base year and typically emphasizes hardware-only gateway sales, which can undercount software-enabled edge functions and newer security-driven upgrades. |
| Industry Research Summary B | USD 10.48 B (2024) | Appears to apply a broader product scope and may include adjacent edge connectivity products beyond IoT gateways, which inflates totals when categories are not cleanly separated. |
The spread in the table is mostly explained by scope and timing choices, followed by how pricing is blended across industrial and commercial deployments. By keeping inclusions tied to clear gateway functions and then checking adoption and pricing with real buyer and channel feedback, the final number stays traceable to practical inputs that can be revisited year after year.


Key Questions Answered in the Report
What is the projected value of the IoT gateway market in 2031?
The IoT gateway market is expected to reach USD 4.51 billion by 2031, reflecting a 12.61% CAGR during 2026-2031.
Which region is forecast to grow the fastest for IoT gateways to 2031?
Asia-Pacific leads with a projected 13.66% CAGR, driven by large-scale NB-IoT smart-meter programs and rapid 5G private-network adoption.
Which industry vertical shows the highest growth momentum for IoT gateways?
Healthcare is advancing at a 12.98% CAGR as reimbursable remote patient monitoring scales in hospitals and home-care settings.
How does 5G RedCap influence gateway adoption?
5G RedCap delivers 150 Mbps throughput at lower power draw than full 5G, making cellular backhaul economical for mid-bandwidth gateways in logistics and manufacturing.
Why are rugged outdoor gateways gaining traction?
Utilities, oil and gas, and transportation agencies need IP67-rated enclosures that withstand −40 °C to +75 °C, which drives a 13.33% CAGR for rugged models.
Page last updated on:





