IoT Integration Market Size and Share
Market Overview
| Study Period | 2020 - 2031 |
|---|---|
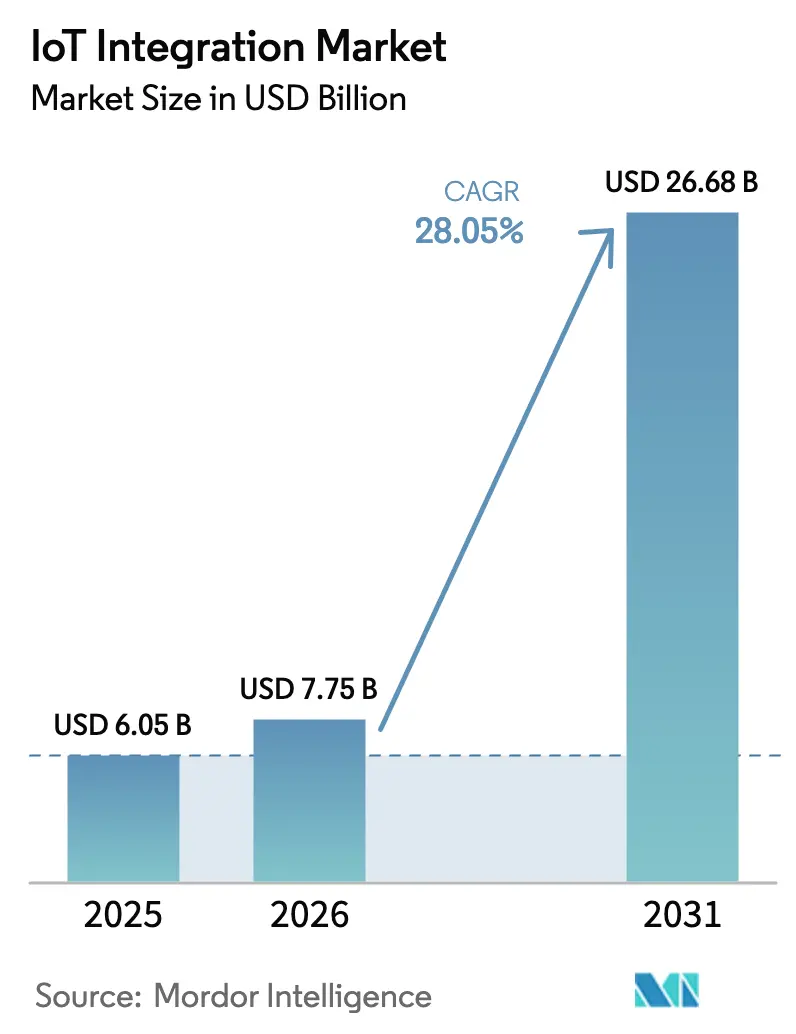
| Market Size (2026) | USD 7.75 Billion |
| Market Size (2031) | USD 26.68 Billion |
| Growth Rate (2026 - 2031) | 28.05% CAGR |
| Fastest Growing Market | Asia Pacific |
| Largest Market | North America |
| Market Concentration | Medium |
Major Players *Disclaimer: Major Players sorted in no particular order Image © Mordor Intelligence. Reuse requires attribution under CC BY 4.0. | |
IoT Integration Market Analysis by Mordor Intelligence
IoT Integration market size in 2026 is estimated at USD 7.75 billion, growing from 2025 value of USD 6.05 billion with 2031 projections showing USD 26.68 billion, growing at 28.05% CAGR over 2026-2031. Rapid 5G roll-outs, expanding edge-cloud architectures, and surging enterprise digital-transformation programs accelerate spending on integration partners that can tame complex, multi-vendor environments. Hardware‐software convergence, heightened cybersecurity mandates, and growing demand for real-time analytics further widen the addressable IoT Integration market. Global device counts are climbing sharply, and the overarching IoT economy is on track for USD 1.8 trillion by 2028, creating steady tailwinds for specialist integrators. Enterprises focus on device fleet orchestration, network slicing, and cloud-edge workload alignment, while vendors differentiate through vertical expertise and robust partner ecosystems.
Key Report Takeaways
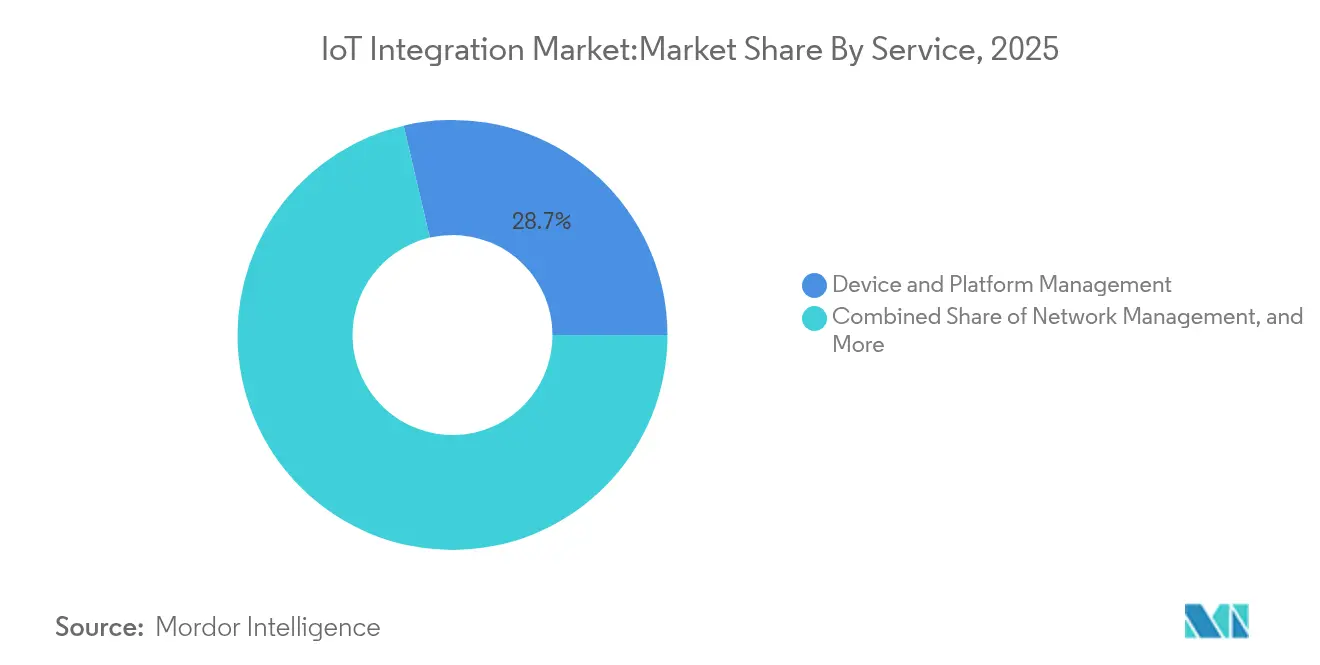
- By service, Device and Platform Management led with 28.65% of IoT Integration market share in 2025; Network Management is poised for a 30.20% CAGR to 2031.
- By application, Smart Buildings and Home Automation held 33.10% of the IoT Integration market size in 2025, whereas Smart Healthcare is forecast to expand at a 31.60% CAGR.
- By enterprise size, Large Enterprises captured 66.85% of IoT Integration market share in 2025, yet SMEs are advancing at a 29.95% CAGR.
- By end-user industry, Manufacturing accounted for 28.55% of the IoT Integration market size in 2025; Healthcare shows the fastest 31.60% CAGR.
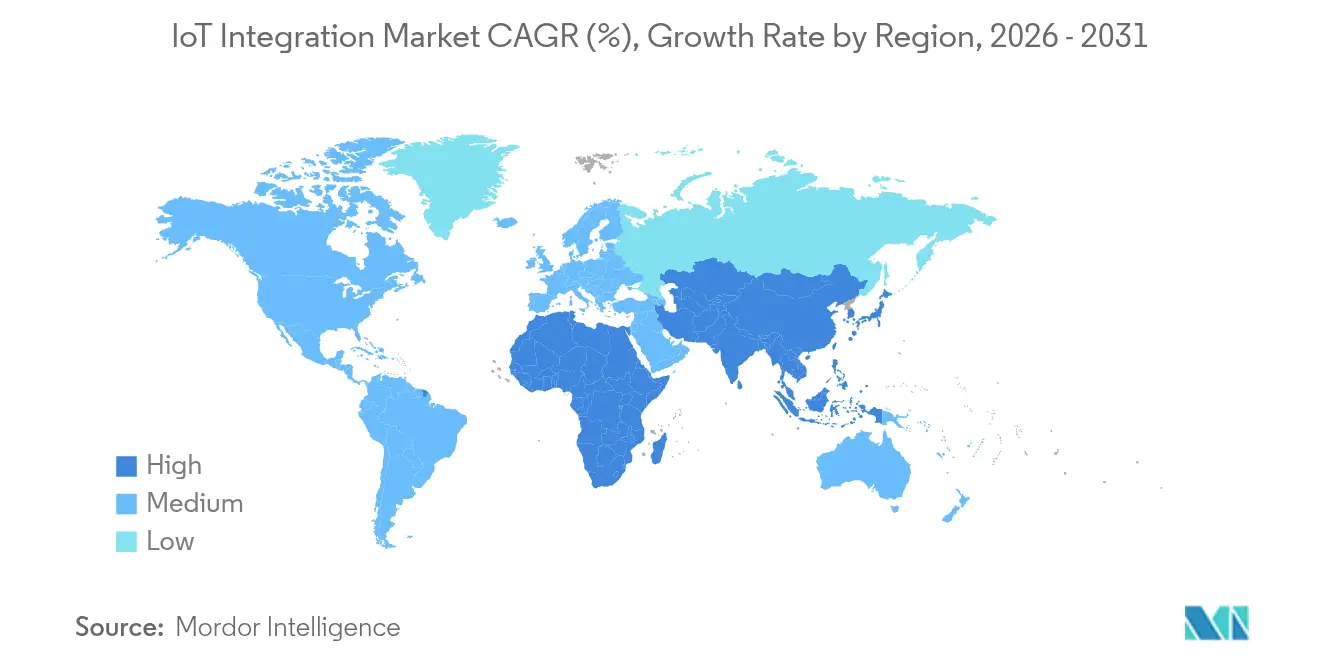
- By geography, North America dominated with 38.45% share in 2025; Asia-Pacific is growing at a 35.20% CAGR.
Note: Market size and forecast figures in this report are generated using Mordor Intelligence’s proprietary estimation framework, updated with the latest available data and insights as of 2026.
Market Trends and Insights
Drivers Impact Analysis of IoT Integration Market*
| Driver | (~) % Impact on CAGR Forecast | Geographic Relevance | Impact Timeline |
|---|---|---|---|
| Proliferation of connected devices | +8.2% | Global | Medium term (2-4 years) |
| Emergence of 5G-enabled low-latency networking | +7.5% | North America and EU, Asia-Pacific core | Medium term (2-4 years) |
| Cloud–edge convergence accelerating integration demand | +6.8% | Global, with early gains in North America, Europe | Short term (≤ 2 years) |
| Government-led smart-city initiatives | +5.2% | Asia-Pacific, Middle East, Europe | Medium term (2-4 years) |
| Digital-thread requirements in discrete industries | +4.1% | Manufacturing hubs globally | Long term (≥ 4 years) |
| EU Data Act-driven real-time data portability needs | +2.3% | European Union | Short term (≤ 2 years) |
| Source: Mordor Intelligence | |||
Proliferation of connected devices
The surge in connected devices multiplies protocol diversity and data-management complexity, forcing enterprises to seek integrators that deliver scalable, secure device-lifecycle platforms. Nordic Semiconductor’s 2025 purchase of Memfault created a chip-to-cloud stack that illustrates how hardware vendors now bundle integration capabilities to simplify customer roll-outs
Emergence of 5G-enabled low-latency networking
Private and public 5G networks unlock use cases such as machine-vision quality control and city-wide autonomous-traffic management, yet add layers of network-slice orchestration and QoS governance. Las Vegas deployed a private 5G network that lowered municipal connectivity costs while improving road-safety metrics through AI-augmented traffic signaling [1]NTT DATA, “Las Vegas Private 5G Network Case Study,” nttdata.com. Integrators therefore cultivate 5G core skills and automation tooling to manage heterogeneous RAN, edge, and cloud domains within the IoT Integration market.
Cloud and edge convergence accelerating integration demand
Enterprises now push analytics closer to devices while retaining centralized governance in hyperscale clouds. Microsoft Azure recorded 29% revenue growth in fiscal-Q1 2025, supported by 60,000 AI-service customers and rising IoT workloads. Integration partners must knit together edge gateways, cloud pipelines, and policy engines that respect data-sovereignty rules and bandwidth limits.
Digital-thread requirements in discrete industries
Manufacturers want uninterrupted data lineage from CAD through shop-floor sensors to service analytics. Honeywell and Qualcomm expanded their collaboration to embed AI at the edge of industrial control systems, underscoring rising demand for domain-centric integrators versed in safety standards and legacy OT protocols.
Restraints Impact Analysis of IoT Integration Market*
| Restraint | (~) % Impact on CAGR Forecast | Geographic Relevance | Impact Timeline |
|---|---|---|---|
| Complex security and compliance mandates | −3.7% | Global, especially regulated industries | Medium term (2-4 years) |
| High total cost of multi-vendor integration | −2.9% | SME-heavy markets, emerging economies | Short term (≤ 2 years) |
| Talent gap in converged OT-IT integration skills | −2.1% | Global; acute in Asia-Pacific and emerging markets | Long term (≥ 4 years) |
| Legacy infrastructure interoperability hurdles | −1.8% | Brown-field industrial sites worldwide | Medium term (2-4 years) |
| Source: Mordor Intelligence | |||
Complex security and compliance mandates
Parallel data-portability duties under the EU Data Act from September 2025, press integrators to embed SBOM management, zero-trust designs, and evidence-based certification workflows. Specialized labs such as ioXt Alliance and Bureau Veritas now test devices against ETSI EN 303 645 and IEC 62443, expanding demand for audit-ready integration templates [2]ioXt Alliance, “Global Standard for IoT Security Certification,” ioxtalliance.org.
High total cost of multi-vendor integration
OECD research shows 72% of SMEs leverage data for decision-making yet still cite digitalization cost barriers. Integration budgets must cover platform licensing, professional services, and continuous security upkeep, often delaying ROI for price-sensitive adopters. Low-code and no-code offerings such as Qubitro’s SIM-synchronization service with Onomondo aim to compress these costs by automating network provisioning.
*Our forecasts treat driver/restraint impacts as directional, not additive. The impact forecasts reflect baseline growth, mix effects, and variable interactions.
IoT Integration Market Segment Analysis
By Service:
Network Management Drives Next-Generation IntegrationNetwork Management recorded the fastest 30.20% CAGR through 2031 as enterprises diversified across 5G, LPWAN, and satellite links requiring unified orchestration. Device and Platform Management retained the largest 28.65% in 2025 in the IoT Integration market share, thanks to centralized firmware, policy, and analytics control. The IoT Integration market size for Network Management is projected to widen rapidly as players like Terrestar and Monogoto combine cellular and satellite footprints to solve rural coverage gaps. Professional and Managed Services attract customers wanting predictable OPEX, while Testing and Certification Services gain traction under the EU cybersecurity regime. Continuous protocol evolution obliges integrators to refresh telemetry ingestion, subscriber management, and traffic-prioritization tools. Vendors that bundle SIM lifecycle, billing, and slice automation in a single pane simplify enterprise adoption. System Design and Architecture services continue to win mandates for brown-field retrofits where legacy SCADA interfaces mix with modern container clusters, pushing overall growth in the IoT Integration market.


By Application:
Smart Healthcare Accelerates Beyond Smart Buildings DominanceSmart Buildings and Home Automation owned 33.10% of 2025 IoT Integration market share, but Smart Healthcare drives the highest 31.60% CAGR, reflecting demand for remote patient monitoring, connected imaging, and AI-assisted diagnostics. The IoT Integration market size for Smart Healthcare is set to rise alongside a 18.6% CAGR in RPM devices. Industrial logistics and smart energy continue steady climbs through supply-chain tracking and grid-modification needs.
Healthcare integrators must bridge HL7/FHIR standards, HIPAA safeguards, and medical-device telemetry into hospital EMR systems. Conversely, smart-building projects emphasize energy dashboards and predictive maintenance. Government smart-city programs like South Korea’s USD 101 million initiative illustrate public-sector appetite for integrated lighting, transport, and safety platforms.
By Enterprise Size:
SME Acceleration Challenges Large-Enterprise DominanceLarge Enterprises held 66.85% of the 2025 IoT Integration market share, leveraging budgets and dedicated teams to run global roll-outs. Yet SMEs post a robust 29.95% CAGR to 2031 as cost-effective cloud services lower entry barriers. Survey data show European SMEs unlocking higher revenue growth when IoT, AI, and Big Data tools converge.
Vendors now position “IoT-as-a-service” bundles with pre-configured dashboards, cellular connectivity, and SLA-driven managed services. Milesight’s facility-monitoring solution in Seoul delivered 32% route-distance cuts and 29% fuel savings for SME fleets, exemplifying how verticalized starter kits quicken payback . The emergence of generative-AI copilots further simplifies adoption through natural-language rule engines.

By End-user Industry:
Healthcare Transformation Accelerates Beyond Manufacturing LeadershipManufacturing captured 28.55% of 2025 IoT Integration market size as Industry 4.0 demand for predictive maintenance and digital twins persists. However, Healthcare’s 31.60% CAGR now outpaces all verticals, driven by connected medical devices and smart-hospital retrofits. Energy, utilities, and automotive each tap IoT for asset optimization and autonomous capabilities. Integrators in manufacturing must harmonize MES, ERP, and OT-level sensor streams, while those in healthcare balance strict regulatory controls with low-latency telemetry. Retail chains use RFID and computer vision for real-time stock insights, whereas BFSI firms integrate IoT data streams for risk analytics and customer-experience upgrades. Collectively, these dynamics reinforce diversified revenue paths across the IoT Integration market.
Geography Analysis
North America, APAC and Europe IoT Integration Market
North America retained 38.45% IoT Integration market share in 2025, supported by early 5G deployments, hyperscale cloud uptake, and sizable industrial IoT budgets. Regional success stories include Microsoft Azure’s AI-driven service expansion that underpins large integration deals. Investment momentum continues in smart-city, healthcare, and manufacturing pilots that demand sophisticated multi-cloud, zero-trust architectures. Asia-Pacific recorded the fastest 35.20% CAGR through 2031. Government programs such as China’s dual-circulation manufacturing push and India’s Digital India scheme catalyze factory automation and utilities upgrades. South Korea’s National Strategic Smart City Program spent USD 101 million during 2018-2022 on data-centric urban services, raising SME participation and IoT research and development outcomes. Nations like Thailand, Indonesia, and the Philippines race to deploy smart meters and logistics hubs, bolstering region-wide demand for the IoT Integration market. Europe maintains stable growth underpinned by stringent data-governance laws. The EU Data Act, applicable September 2025, forces device vendors and integrators to guarantee real-time data portability, stimulating consulting opportunities around API management and secure sharing frameworks. Interoperability pilots in Germany’s automotive corridor and France’s smart-energy projects highlight the region’s focus on standards-based implementations.

Competitive Landscape
The IoT Integration market exhibits moderate consolidation as cloud hyperscalers, network vendors, and boutique consultancies cultivate distinct value propositions. Microsoft, AWS, and Cisco exploit broad platform ecosystems, leveraging established developer communities and global support footprints. Their vertical-specific solution blueprints accelerate time-to-value for enterprise roll-outs that demand scalable DevSecOps pipelines.
Specialized firms differentiate through deep domain knowledge and lean delivery models. Nordic Semiconductor’s Memfault acquisition created an end-to-end firmware observability path that rivals cannot easily replicate. Likewise, Netmore’s partnership with Alliot Technologies merges LPWAN coverage with integration toolkits, opening doors to mid-market customers seeking turnkey deployments.
Regulatory mastery is emerging as a critical moat. Providers versed in the EU Cyber Resilience Act or FDA device-interoperability guidelines secure premium engagements as clients prioritize compliance assurance. White-space opportunities remain in AI-edge orchestration, industrial-safety certification, and healthcare-data harmonization, allowing nimble players to claim profitable niches within the IoT Integration market.
IoT Integration Industry Leaders
Microsoft Corporation
Amazon Web Services, Inc.
Cisco Systems, Inc.
IBM Corporation
Siemens AG
- *Disclaimer: Major Players sorted in no particular order

IoT Integration Market Companies Covered in this Report
- Microsoft Corporation
- Amazon Web Services, Inc.
- Cisco Systems, Inc.
- IBM Corporation
- Siemens AG
- Oracle Corporation
- PTC Inc.
- Qualcomm Incorporated
- General Electric Company
- Verizon Communications Inc.
- Accenture plc
- Capgemini SE
- Infosys Limited
- Tata Consultancy Services Limited
- HCL Technologies Limited
- Cognizant Technology Solutions Corporation
- Bosch.IO GmbH
- Huawei Technologies Co., Ltd.
- Schneider Electric SE
- Atos SE
- Wipro Limited

Recent Industry Developments in IoT Integration Market
- June 2025: Singtel launched an enhanced Multi-Domestic Connectivity solution with floLIVE to streamline global IoT roll-outs across 190+ markets.
- March 2025: Netmore and Alliot Technologies formed a partnership to deliver end-to-end IoT solutions across multiple verticals.
- March 2025: Terrestar Solutions and Monogoto unveiled hybrid cellular-satellite services to extend seamless IoT coverage throughout Canada.
- October 2024: LORIOT and Microtronics collaborated to advance environmental-engineering and energy-management IoT deployments in the DACH region.


IoT Integration Market Report Scope and Research Methodology
Market Definition and Coverage
Our study defines the IoT integration market as revenue generated from specialized service providers that connect heterogeneous IoT devices, platforms, applications, and enterprise IT assets so that data flows securely and business workflows run end-to-end. Services span advisory, system and network design, device and platform management, application tuning, data mapping, testing, and managed support across cloud, edge, and on-prem estates.
Scope exclusion: generic IT outsourcing or standalone hardware resale not tied to an IoT integration mandate remains outside this definition.
Segments Covered in This Report
- By Service
- Device and Platform Management Services
- System Design and Architecture Services
- Application Management Services
- Network Management
- Testing and Certification Services
- Professional and Managed Services
- Other Services
- By Application
- Smart Manufacturing
- Smart Buildings and Home Automation
- Connected Logistics and Transportation
- Smart Energy and Utilities
- Smart Healthcare
- Smart Cities and Government
- Other Applications
- By Enterprise Size
- Large Enterprises
- Small and Medium-sized Enterprises (SMEs)
- By End-user Industry
- Manufacturing
- Healthcare and Life Sciences
- Banking, Financial Services and Insurance (BFSI)
- Automotive and Transportation
- Retail and E-commerce
- Energy and Utilities
- Government and Smart Cities
- Other Industries
- By Geography
- North America
- United States
- Canada
- Mexico
- South America
- Brazil
- Argentina
- Rest of South America
- Europe
- Germany
- United Kingdom
- France
- Italy
- Spain
- Russia
- Rest of Europe
- Asia-Pacific
- China
- Japan
- India
- South Korea
- Australia and New Zealand
- Rest of Asia-Pacific
- Middle East and Africa
- Middle East
- Saudi Arabia
- United Arab Emirates
- Turkey
- Rest of Middle East
- Africa
- South Africa
- Nigeria
- Egypt
- Rest of Africa
- Middle East
- North America
Data Sources, Market Sizing, and Validation
Primary Research
Our analysts interviewed system integration practice leads, IoT platform architects, and procurement heads across North America, Europe, and Asia to validate service mix ratios, average deal values, and project rollout timelines. Survey pulses with device makers and telecom operators further tested adoption triggers and hurdle rates that desk research alone could not surface.
Desk Research
We began with statutory datasets and association dashboards such as the International Telecommunication Union's connected device counts, the GSMA Intelligence cellular IoT connection tracker, US Census Bureau and Eurostat ICT spending files, and World Bank manufacturing value-added series, which frame integration demand. Patent feeds from Questel and shipment intelligence from Volza helped trace emerging protocols, while Dow Jones Factiva and company 10-Ks clarified revenue mixes and contract momentum. These sources, together with insights from D&B Hoovers on integrator financials, provided the factual spine of the model. The sources listed illustrate the breadth we tap; many additional references were consulted for triangulation and clarification.
Market-Sizing and Forecasting
A top-down reconstruction starts with national IoT device stocks, connectivity spending, and digitization outlays, which are then filtered through penetration rate and price band assumptions to build the integration service pool. Select bottom-up checks, sampled project ASP times volume and integrator revenue roll-ups, align the totals. Key variables include enterprise 5G rollout pace, average connected asset density per plant, edge cloud workload share, integrator day rate inflation, and cybersecurity compliance spend. Multivariate regression with scenario analysis projects each driver, allowing us to adjust for regulatory shifts or macro slowdowns and to close gaps where bottom-up evidence is thin.
Data Validation and Update Cycle
Outputs pass three-level analyst review, anomaly screens against independent IoT spending indices, and variance checks versus prior editions. We refresh models annually, issuing mid-cycle updates if material events, such as large M&A, spectrum policy changes, or supply chain shocks, shift the baseline.
How Mordor Intelligence's IoT Integration Market Size Compares to Other Published Estimates
Published market values often diverge because firms anchor on different service buckets, base years, and price curves.
We acknowledge these variations up front so clients see the moving parts.
Benchmark comparison
| Market Size | Anonymized source | Primary gap driver |
|---|---|---|
| USD 6.05 B (2025) | Mordor Intelligence | - |
| USD 5.23 B (2024) | Global Consultancy A | Narrower service basket and earlier base year |
| USD 3.20 B (2023) | Global Consultancy B | Excludes managed support and uses static ASP decline |
These comparisons show that when scope, variables, and timing are normalized, Mordor's balanced approach produces a dependable, transparent baseline that executives can retrace and pressure test with ease.


Key Questions Answered in the Report
How big is the IoT Integration market today?
The IoT Integration market is valued at USD 7.75 billion in 2026 and is set to reach USD 26.68 billion by 2031, reflecting a 28.05% CAGR.
Which service segment is growing the fastest?
Network Management is the fastest-growing service, expanding at a 30.20% CAGR thanks to rising 5G, LPWAN, and satellite-link orchestration needs.
Why is Asia-Pacific the fastest-growing region?
Government smart-city programs, accelerated industrial automation, and expanding digital infrastructure propel a 35.20% CAGR for IoT Integration across Asia-Pacific.
How do new EU regulations affect integration projects?
The EU Cyber Resilience Act and Data Act impose mandatory cybersecurity and data-portability requirements, increasing demand for integrators with strong compliance capabilities.
Page last updated on:


