
Technology, Media and Telecom
5th MayPricing Strategy for Semiconductor Components
3 Min Read
The IoT in Banking and Financial Services Market Report Segments the Industry Into by Offering (Hardware, Software, and Services), Connectivity (Wired, and Wireless), Deployment (Cloud, and On Premise), Application (Payment and Transaction Security, Customer Experience Management, and More), End User (Banks, Insurance Companies, and More), and Geography.
Market Overview
| Study Period | 2020 - 2031 |
|---|---|
| Market Size (2026) | USD 68.62 Billion |
| Market Size (2031) | USD 121.09 Billion |
| Growth Rate (2026 - 2031) | 12.05 % CAGR |
| Fastest Growing Market | Asia Pacific |
| Largest Market | North America |
| Market Concentration | Medium |
Major Players*Disclaimer: Major Players sorted in no particular order. Image © Mordor Intelligence. Reuse requires attribution under CC BY 4.0. |
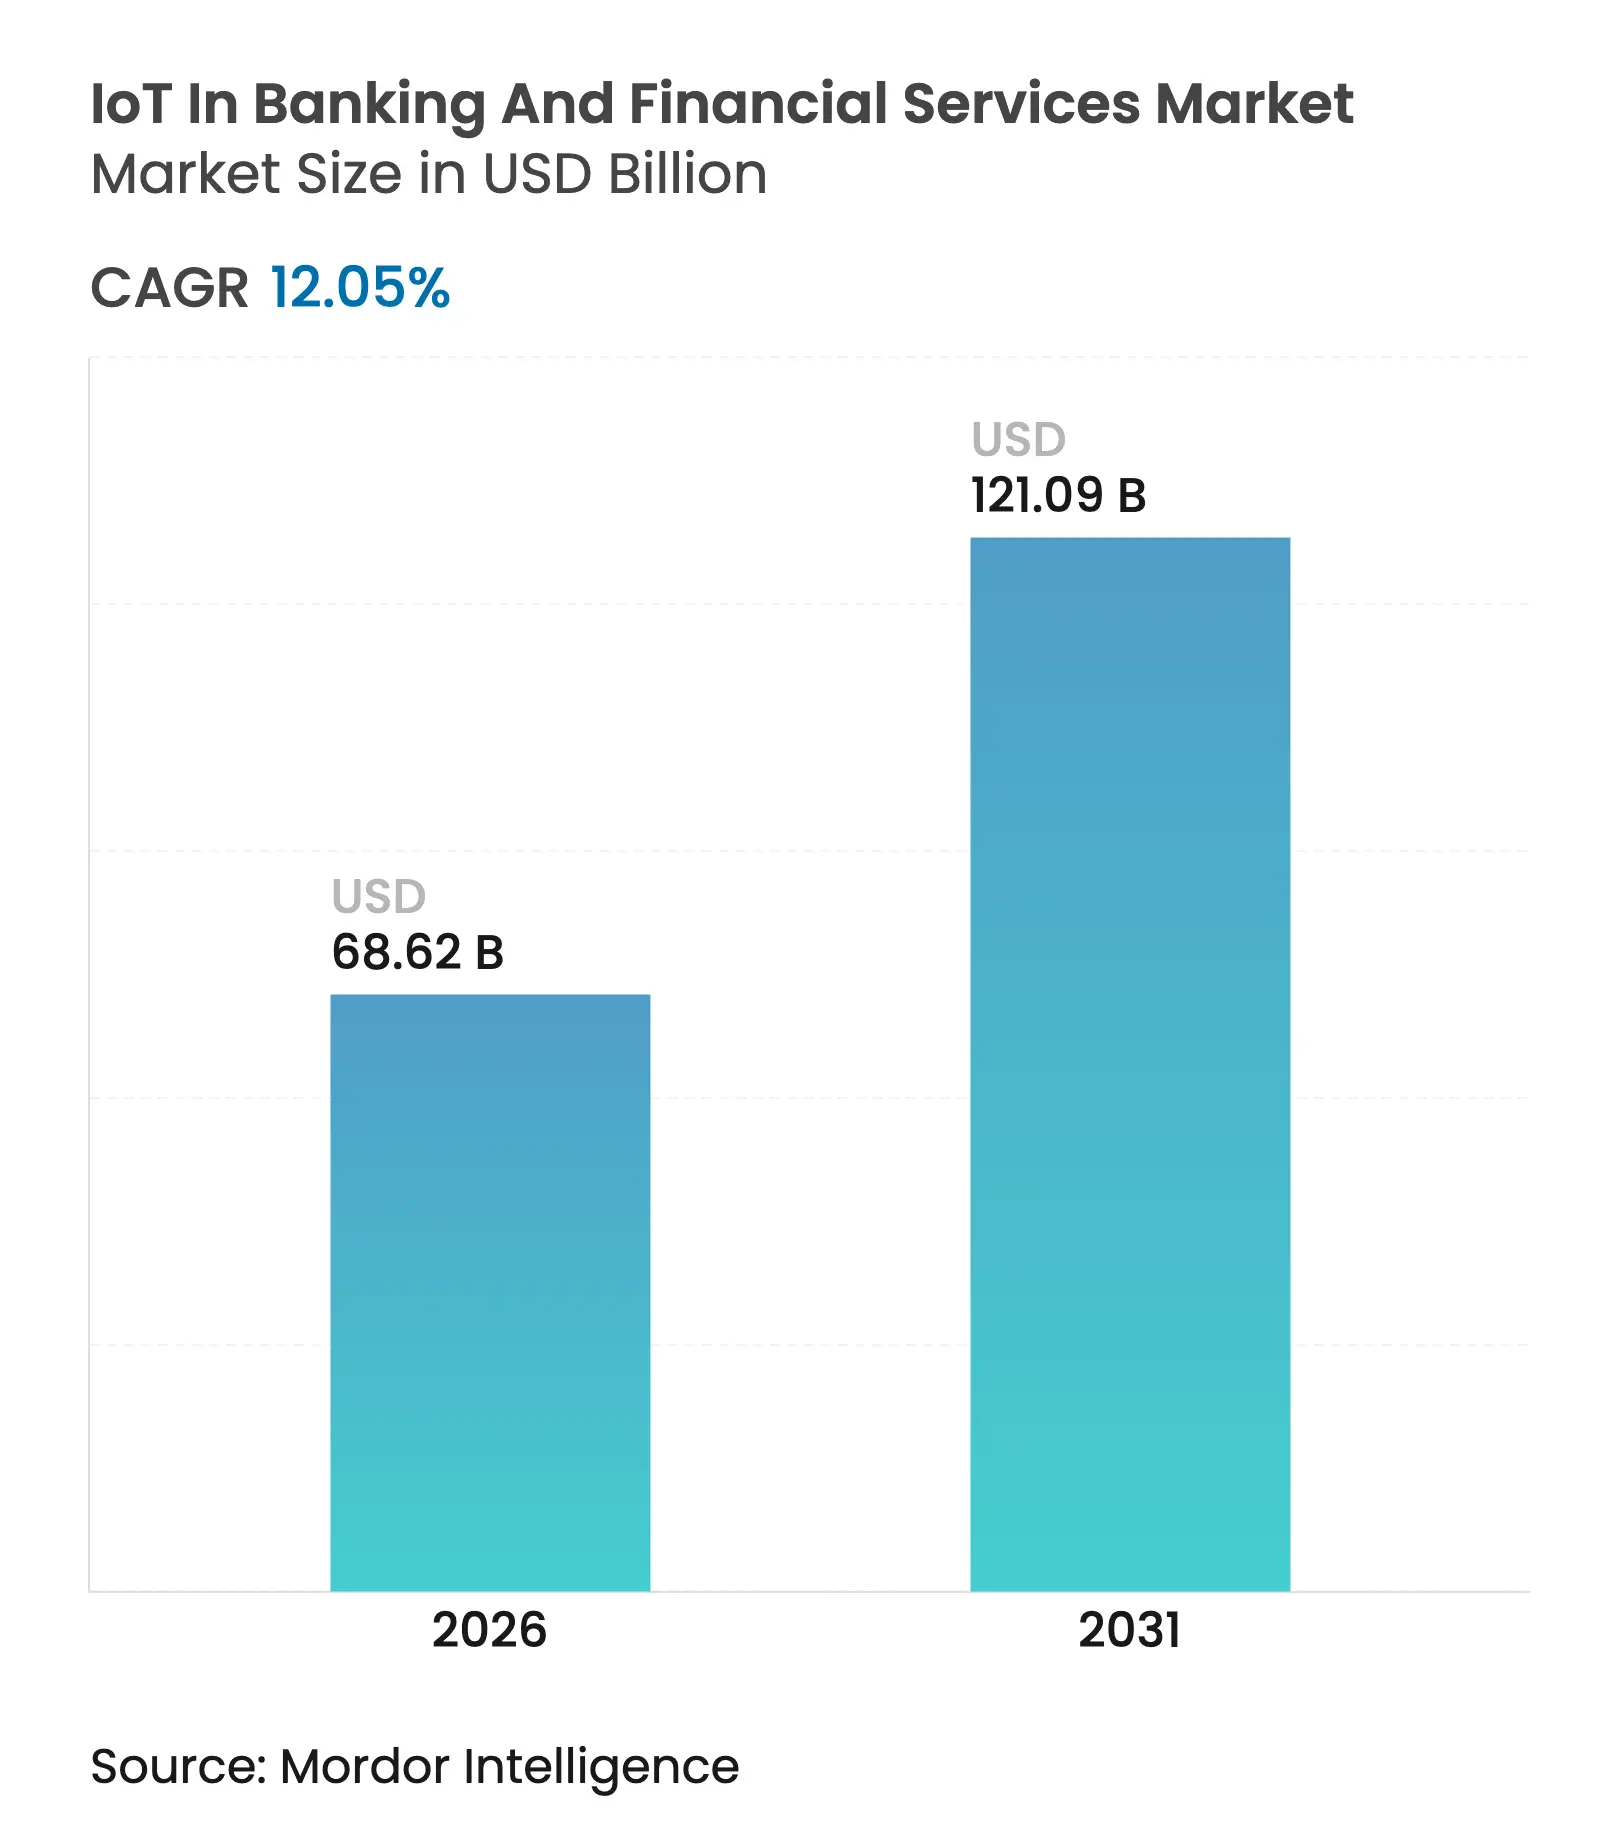
The IoT in Banking and Financial Services market size is expected to grow from USD 61.23 billion in 2025 to USD 68.62 billion in 2026 and is forecast to reach USD 121.09 billion by 2031 at 12.05% CAGR over 2026-2031. Rapid connected-device penetration, the maturation of 5G, and real-time fraud analytics are redefining how institutions manage risk, customer engagement, and branch operations. Convergence of edge computing with advanced authentication is shortening settlement cycles, while open-API regulations are driving ecosystem interoperability. Hardware commoditization is shifting competitive advantage toward services that integrate, secure, and scale deployments. Accelerating payment digitalization and usage-based insurance pricing continue to open fresh revenue streams across the IoT in Banking and Financial Services market.
Key Report Takeaways
Note: Market size and forecast figures in this report are generated using Mordor Intelligence's proprietary estimation framework, updated with the latest available data and insights as of 2026.
Drivers Impact Analysis
| Driver | (~) % Impact on CAGR Forecast | Geographic Relevance | Impact Timeline | |||
|---|---|---|---|---|---|---|
Rising demand for contactless payments and digital wallets Rising demand for contactless payments and digital wallets | +3.2% | Global; strongest in North America and Asia-Pacific | Short term (≤ 2 years) | (~) % Impact on CAGR Forecast:+3.2% | Geographic Relevance:Global; strongest in North America and Asia-Pacific | Impact Timeline:Short term (≤ 2 years) |
Growing adoption of IoT for enhanced branch and ATM security Growing adoption of IoT for enhanced branch and ATM security | +2.8% | North America and Europe core; MEA emerging | Medium term (2-4 years) | |||
Regulatory push for real-time payments and open banking APIs Regulatory push for real-time payments and open banking APIs | +2.1% | Europe in lead; North America and Asia-Pacific following | Medium term (2-4 years) | |||
Edge-compute fraud analytics at ATM level Edge-compute fraud analytics at ATM level | +1.9% | Global; early uptake in developed markets | Long term (≥ 4 years) | |||
IoT-driven usage-based insurance pricing models IoT-driven usage-based insurance pricing models | +1.4% | North America and Europe; Asia-Pacific scaling | Long term (≥ 4 years) | |||
Smart branch sensor networks for energy optimisation Smart branch sensor networks for energy optimisation | +1.1% | Global; focus on developed markets | Medium term (2-4 years) | |||
| Source: Mordor Intelligence | ||||||
Rising Demand for Contactless Payments and Digital Wallets
Mobile-wallet adoption hit 4.8 billion users in 2025, turning device-embedded authentication into the default payment mode[1]Paymentology, “Global Wallet Adoption Report 2025,” paymentology.com. JPMorgan Chase introduced face- and palm-vein-based biometric payments across its network in 2024, eliminating plastic-card dependency and accelerating settlement speed. NFC combined with tokenized ledgers now delivers tamper-resistant payment flows that cut fraud exposure while unlocking richer behavioral data analytics. Financial institutions exploit these insights to refine credit scoring and cross-sell offers in real time. Wearable-centric banking APIs exemplify embedded finance, enabling payments from fitness bands, watches, and medical devices inside the growing IoT in Banking and Financial Services market.
Growing Adoption of IoT for Enhanced Branch and ATM Security
JPMorgan Chase invested USD 200 million to retrofit 85% of its 5,300 branches with smart sensors that unify video, access, and environmental analytics within a single dashboard. Axis Communications’ network cameras pair transaction-triggered video with advanced anomaly detection to anticipate threats before they materialize. Real-world projects document 20% faster incident response and 30% higher operational efficiency after deployment. Integrated IoT security stacks now bundle biometric authentication, tamper alarms, and AI-driven threat scoring, embedding always-on protection deep into the IoT in Banking and Financial Services market.
Regulatory Push for Real-Time Payments and Open Banking APIs
The EU’s Instant Credit Transfers rule compels sub-10-second processing for transactions up to EUR 100,000, necessitating IoT-enabled edge nodes for compliance. Over 69 countries have implemented open-banking mandates that multiply API traffic and require continuous device monitoring to secure shared data. In the United States, the CFPB’s forthcoming Personal Financial Data Rights rule sets parallel expectations, pushing banks to roll out IoT-backed audit and consent management tools. Regulatory necessity therefore continues to channel funds toward connected architectures across the expanding IoT in Banking and Financial Services market.
Edge-Compute Fraud Analytics at ATM Level
ING Bank’s use of Apache Flink streams fraud-detection models directly onto ATM hardware, cutting decision latency to milliseconds. Projects report 69% reductions in processing time and 37% lifts in detection accuracy. By inspecting sensor, behavioral, and transaction data locally, the bank stops suspicious withdrawals before funds leave the machine. Hybrid designs synchronize only summary alerts to headquarters, conserving bandwidth and bolstering sovereignty over sensitive data. These advances underscore how localized AI is safeguarding cash points within the IoT in Banking and Financial Services market.
Restraint Impact Analysis
| Restraint | (~) % Impact on CAGR Forecast | Geographic Relevance | Impact Timeline | |||
|---|---|---|---|---|---|---|
Data privacy and cybersecurity concerns Data privacy and cybersecurity concerns | -2.3% | Europe and North America heightened; global | Short term (≤ 2 years) | (~) % Impact on CAGR Forecast:-2.3% | Geographic Relevance:Europe and North America heightened; global | Impact Timeline:Short term (≤ 2 years) |
High integration and upgrade costs High integration and upgrade costs | -1.8% | Global; heavier for smaller institutions | Medium term (2-4 years) | |||
Interoperability gaps with legacy core-banking systems Interoperability gaps with legacy core-banking systems | -1.5% | Global; acute in mature markets | Long term (≥ 4 years) | |||
Urban wireless-spectrum scarcity for low-latency traffic Urban wireless-spectrum scarcity for low-latency traffic | -0.9% | Dense cities worldwide; APAC megacities | Medium term (2-4 years) | |||
| Source: Mordor Intelligence | ||||||
Data Privacy and Cybersecurity Concerns
Nearly 88% of banking leaders cite device sprawl and data silos as top security risks. Compliance with GDPR and the new ISO/IEC 27562:2024 fintech privacy standard requires device-level encryption, quantum-resilient keys, and continuous endpoint monitoring. Full-stack IoT security frameworks have lowered incident counts by 43%, although their capital and staffing demands remain significant. As threat actors weaponize AI and quantum decryption, institutions must reinforce every connected node, tempering growth within the IoT in Banking and Financial Services market.
High Integration and Upgrade Costs
Legacy mainframes still process core deposits for many global banks, forcing expensive middleware layers when onboarding IoT endpoints. Surveys show 69% of institutions peg integration as their biggest modernization hurdle. Total transformation outlays often reach 3-5 times initial hardware budgets once training and regulatory validation are included. Modular, phased deployments cut costs by up to 40% yet stretch project timelines, slowing near-term uptake across the IoT in Banking and Financial Services market.
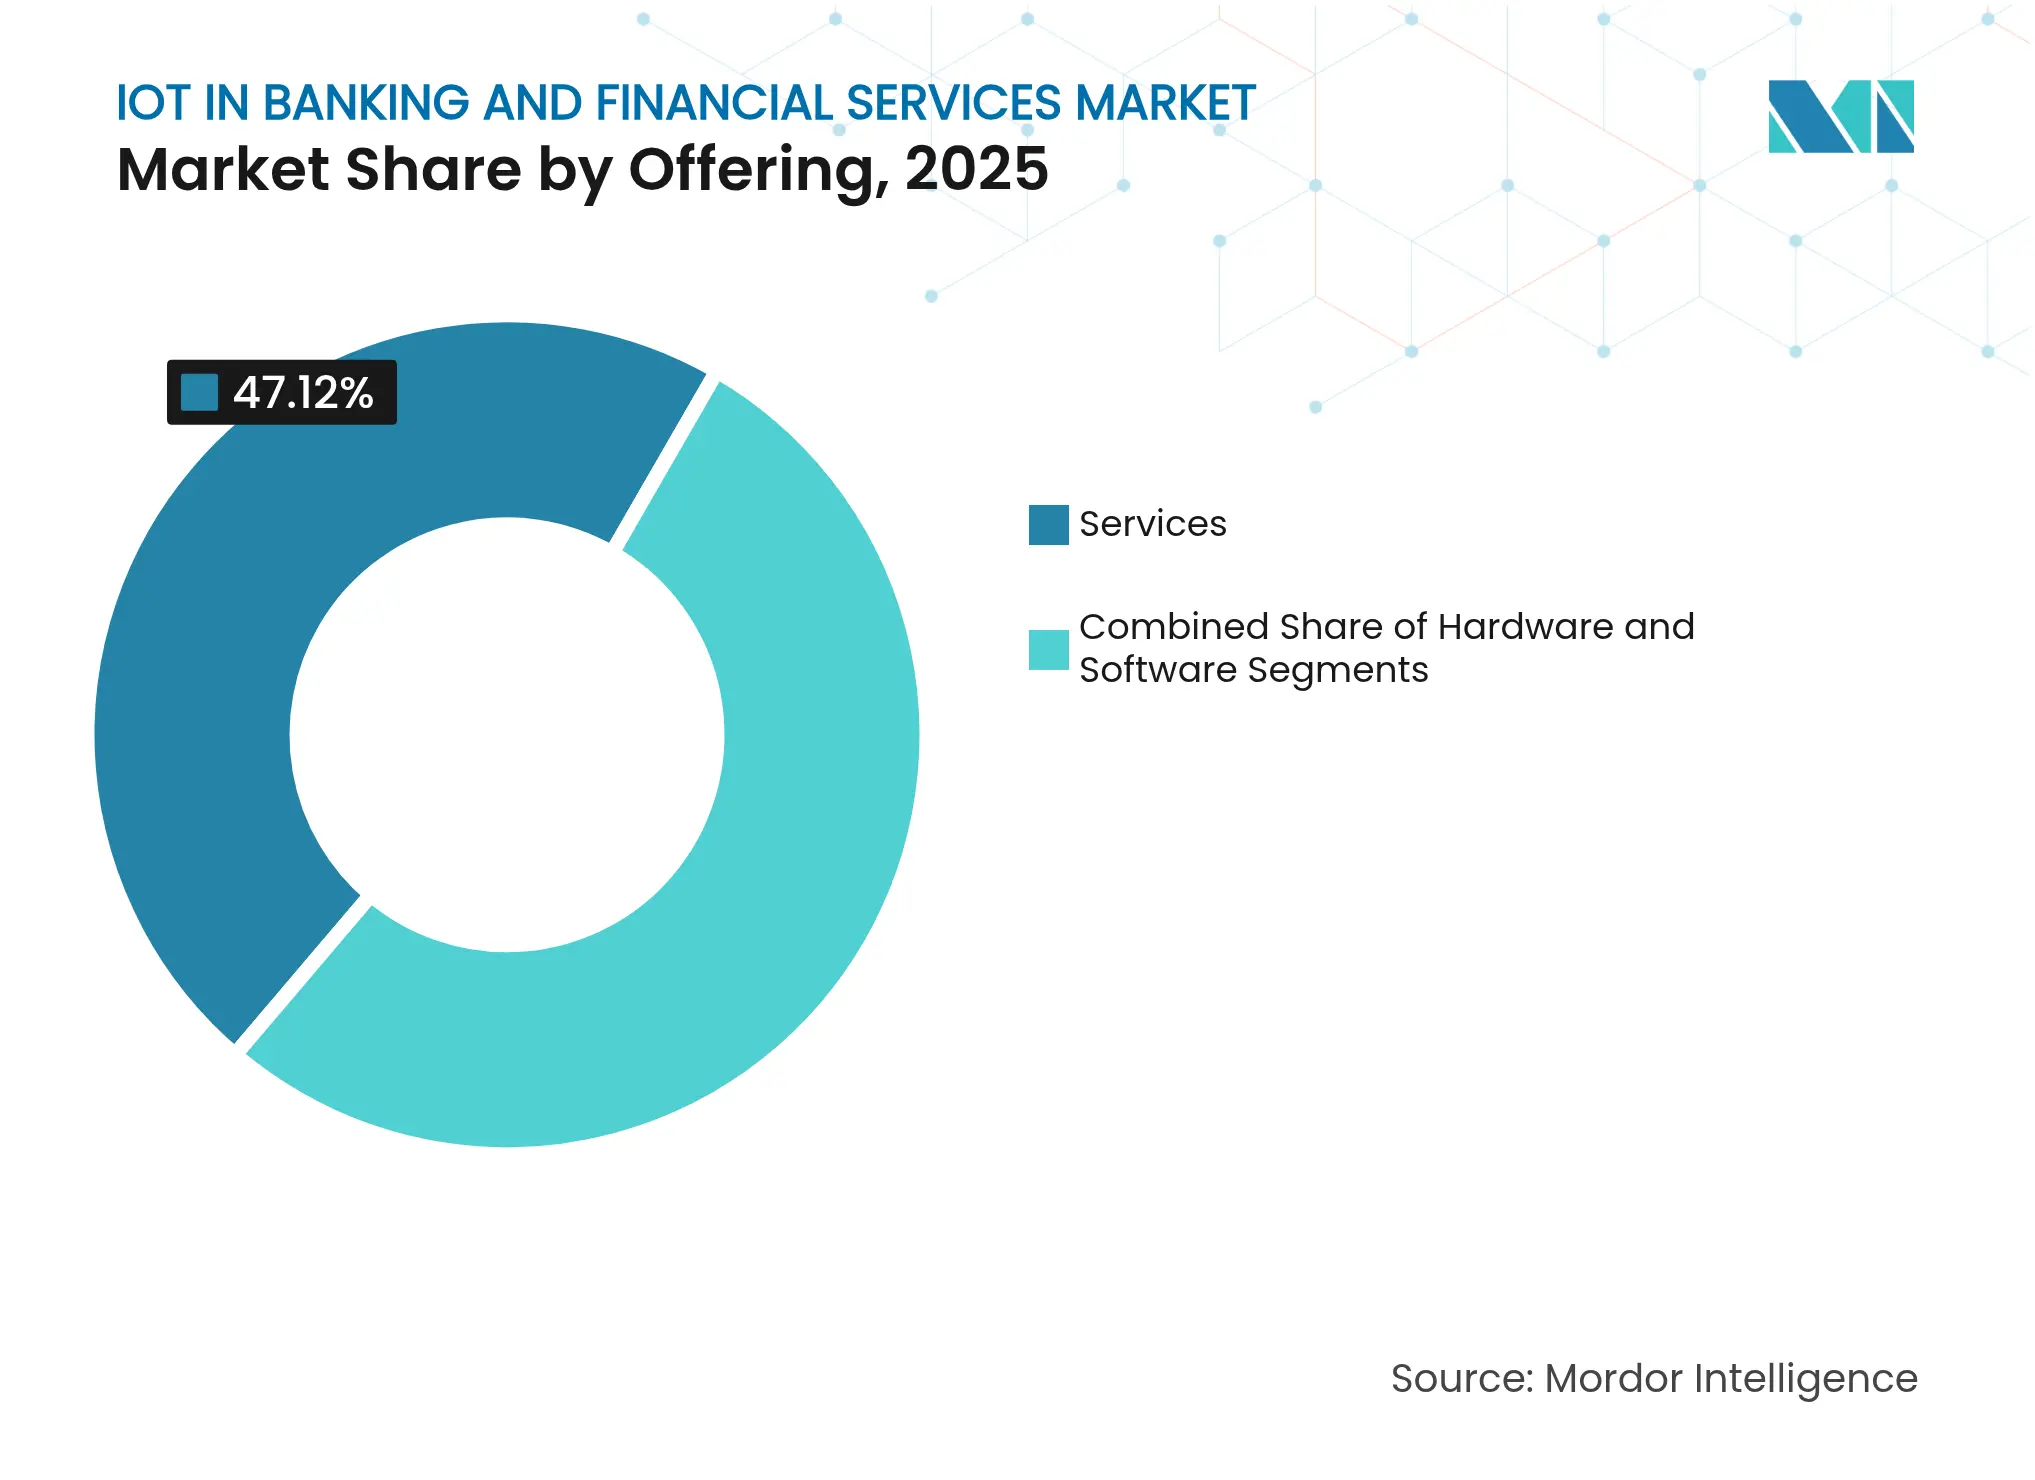
By Offering: Services Drive Implementation Excellence
Services commanded a 47.12% IoT in Banking and Financial Services market share in 2025 and will grow at 41.87% CAGR to 2031. Integration, consulting, and managed services have proven indispensable as institutions navigate stringent oversight, complex device mixes, and multilayer security. Hardware, while necessary, is becoming commoditized, nudging margins lower each year. Software sits between the two, adding analytics, orchestration, and interface logic. Citizens Bank saved USD 1 million annually through a services-led data-streaming overhaul that optimized compute loads and monitoring thresholds. Services providers therefore stand at the project epicenter, translating road-maps into secure, production-scale rollouts that continue to shape the IoT in Banking and Financial Services market.
Hardware remains relevant for specialized sensors, biometric scanners, and ruggedized ATM modules but grows more slowly as common standards spread. The segment nevertheless benefits from retrofit cycles that replace aging endpoints with power-efficient, AI-capable counterparts. Software platforms, meanwhile, monetize via subscription, bundling risk engines, API gateways, and dashboard analytics. With regulatory scrutiny intensifying, demand for managed compliance services is expected to rise sharply, locking in multi-year contracts that stabilize vendor revenue. This service-centric dynamic indicates that the IoT in Banking and Financial Services industry will reward integrators with deep banking know-how over pure hardware innovators.
Note: Segment shares of all individual segments available upon report purchase
By Connectivity: Wireless Solutions Enable Flexible Deployment
Wireless held 63.35% share of the IoT in Banking and Financial Services market in 2025 and is anticipated to advance at a 36.55% CAGR through 2031. Cellular 5G underpins high-bandwidth, low-latency use cases like real-time fraud interdiction, while private LTE supports always-on ATMs in remote areas. Wi-Fi 6 upgrades improve branch analytics by streaming high-resolution video without bottlenecks. Bluetooth Low Energy in smart payment cards lets issuers deliver secure, contactless transactions embedded in slim form factors; Nordic Semiconductor’s dual-mode chipsets illustrate how low-power radios extend battery life while maintaining cryptographic performance.
Wired Ethernet and fiber links persist inside data centers and vault rooms where throughput and tamper resistance override flexibility. Yet the adoption curve favors untethered deployments that can be relocated or resized with limited labor. Institutions also prefer operating-expense connectivity subscription models to capital-intensive cabling work. As spectrum auctions open fresh mid-band frequencies, network operators will prioritize fintech traffic slices that guarantee deterministic performance. These developments reinforce wireless as the backbone of the IoT in Banking and Financial Services market.
By Deployment: Cloud Platforms Accelerate Innovation
Cloud architectures represented 57.20% share of the IoT in Banking and Financial Services market size in 2025 and are forecast to expand at 44.23% CAGR to 2031. Banks migrate workloads to take advantage of elastic scaling, built-in AI services, and rapid API provisioning. CaixaBank earmarked EUR 5 billion for its Cosmos cloud-modernization program, blending generative AI with data-lake analytics to boost personalized offers. Cloud-native IoT hubs reduce provisioning from months to days, slashing time-to-market for new features.
On-premise deployments persist for latency-sensitive or sovereignty-bound data, prompting hybrid patterns. Edge gateways preprocess sensor feeds locally before syncing to cloud models, maintaining customer privacy while exploiting high-powered analytics. Disaster-recovery postures improve as multi-zone cloud architectures insulate operations from regional outages. Platform vendors embed compliance templates that map directly to ISO 27001 and PCI-DSS, simplifying audits. Overall, cloud uptake signals that agility and cost transparency outweigh legacy attachment across the IoT in Banking and Financial Services market.

Recognized by Experts. Trusted by Leaders.
A trusted intelligence partner to global decision-makers across 90+ countries.


By Application: Security Applications Lead Market Penetration
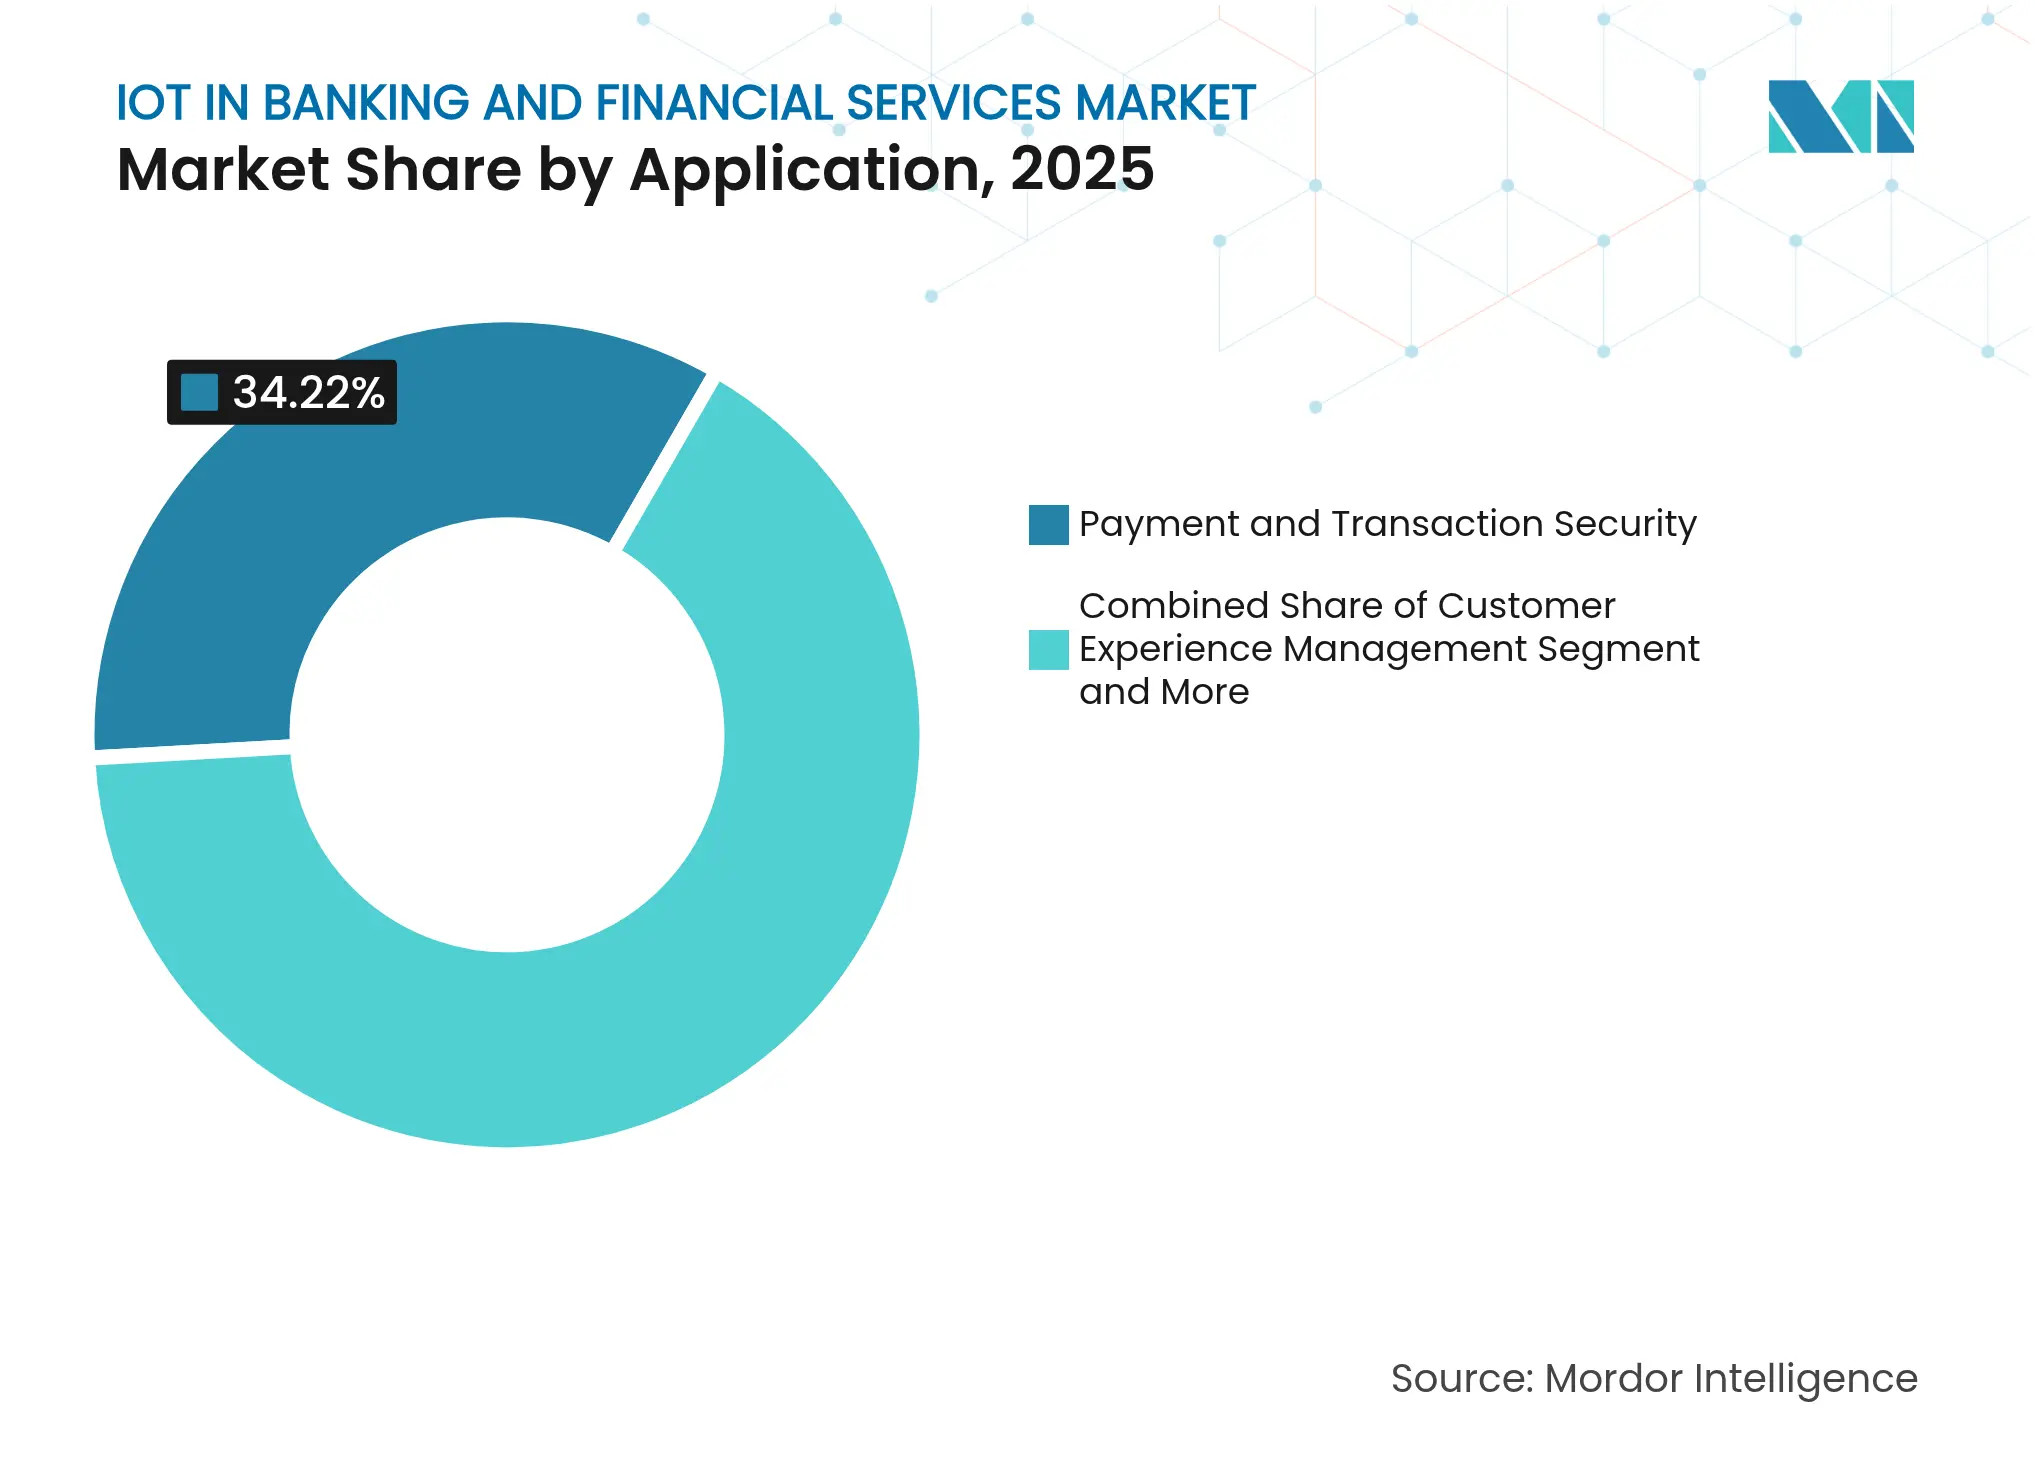
Payment and transaction security contributed 34.22% of segment revenue in 2025, underscoring how threat mitigation dominates project planning. Adaptive risk scoring, biometric confirmation, and tokenized card emulation now ship as baseline modules in major rollouts. Fraud detection and prevention solutions expand fastest at 43.08% CAGR to 2031, propelled by AI models that learn from cross-channel telemetry. Institutions deploy device fingerprints, geolocation checks, and behavioral analytics in tandem, reducing false positives and streamlining customer experience.
Customer-experience management is gaining share as banks convert branch traffic data into queue-optimization insights and craft hyper-personalized mobile journeys. Asset monitoring, such as smart ATM self-healing modules, curbs field-service calls and energy use. ENTOUCH’s integrated facility platform reports 329% five-year ROI owing to energy savings. As compliance obligations grow, risk-management dashboards stitch together audit trails, device attestations, and policy exceptions, embedding governance inside the IoT in Banking and Financial Services market.
Note: Segment shares of all individual segments available upon report purchase
By End User: Banks Lead While Insurance Accelerates
Banks captured 41.55% IoT in Banking and Financial Services market share in 2025 by leveraging large IT budgets and existing channel footprints. They pilot connected branches, biometric ATMs, and micro-location marketing. Insurers, however, post the highest 40.72% CAGR to 2031 as telematics unlocks usage-based premiums. ApexTech’s driving-behavior sensor suite inputs directly into actuarial models, cutting claim fraud and rewarding safe customers.
Investment firms adopt real-time data feeds for algorithmic trading, while fintechs embed micro-lending inside consumer devices. Credit unions and payment processors retrofit legacy cores to match digital-first challengers. Cross-segment partnerships, such as Verizon with Santander’s Openbank, illustrate convergence where telecoms deliver co-branded savings products. Such collaborations widen the usage canvas, accelerating penetration across the IoT in Banking and Financial Services market.
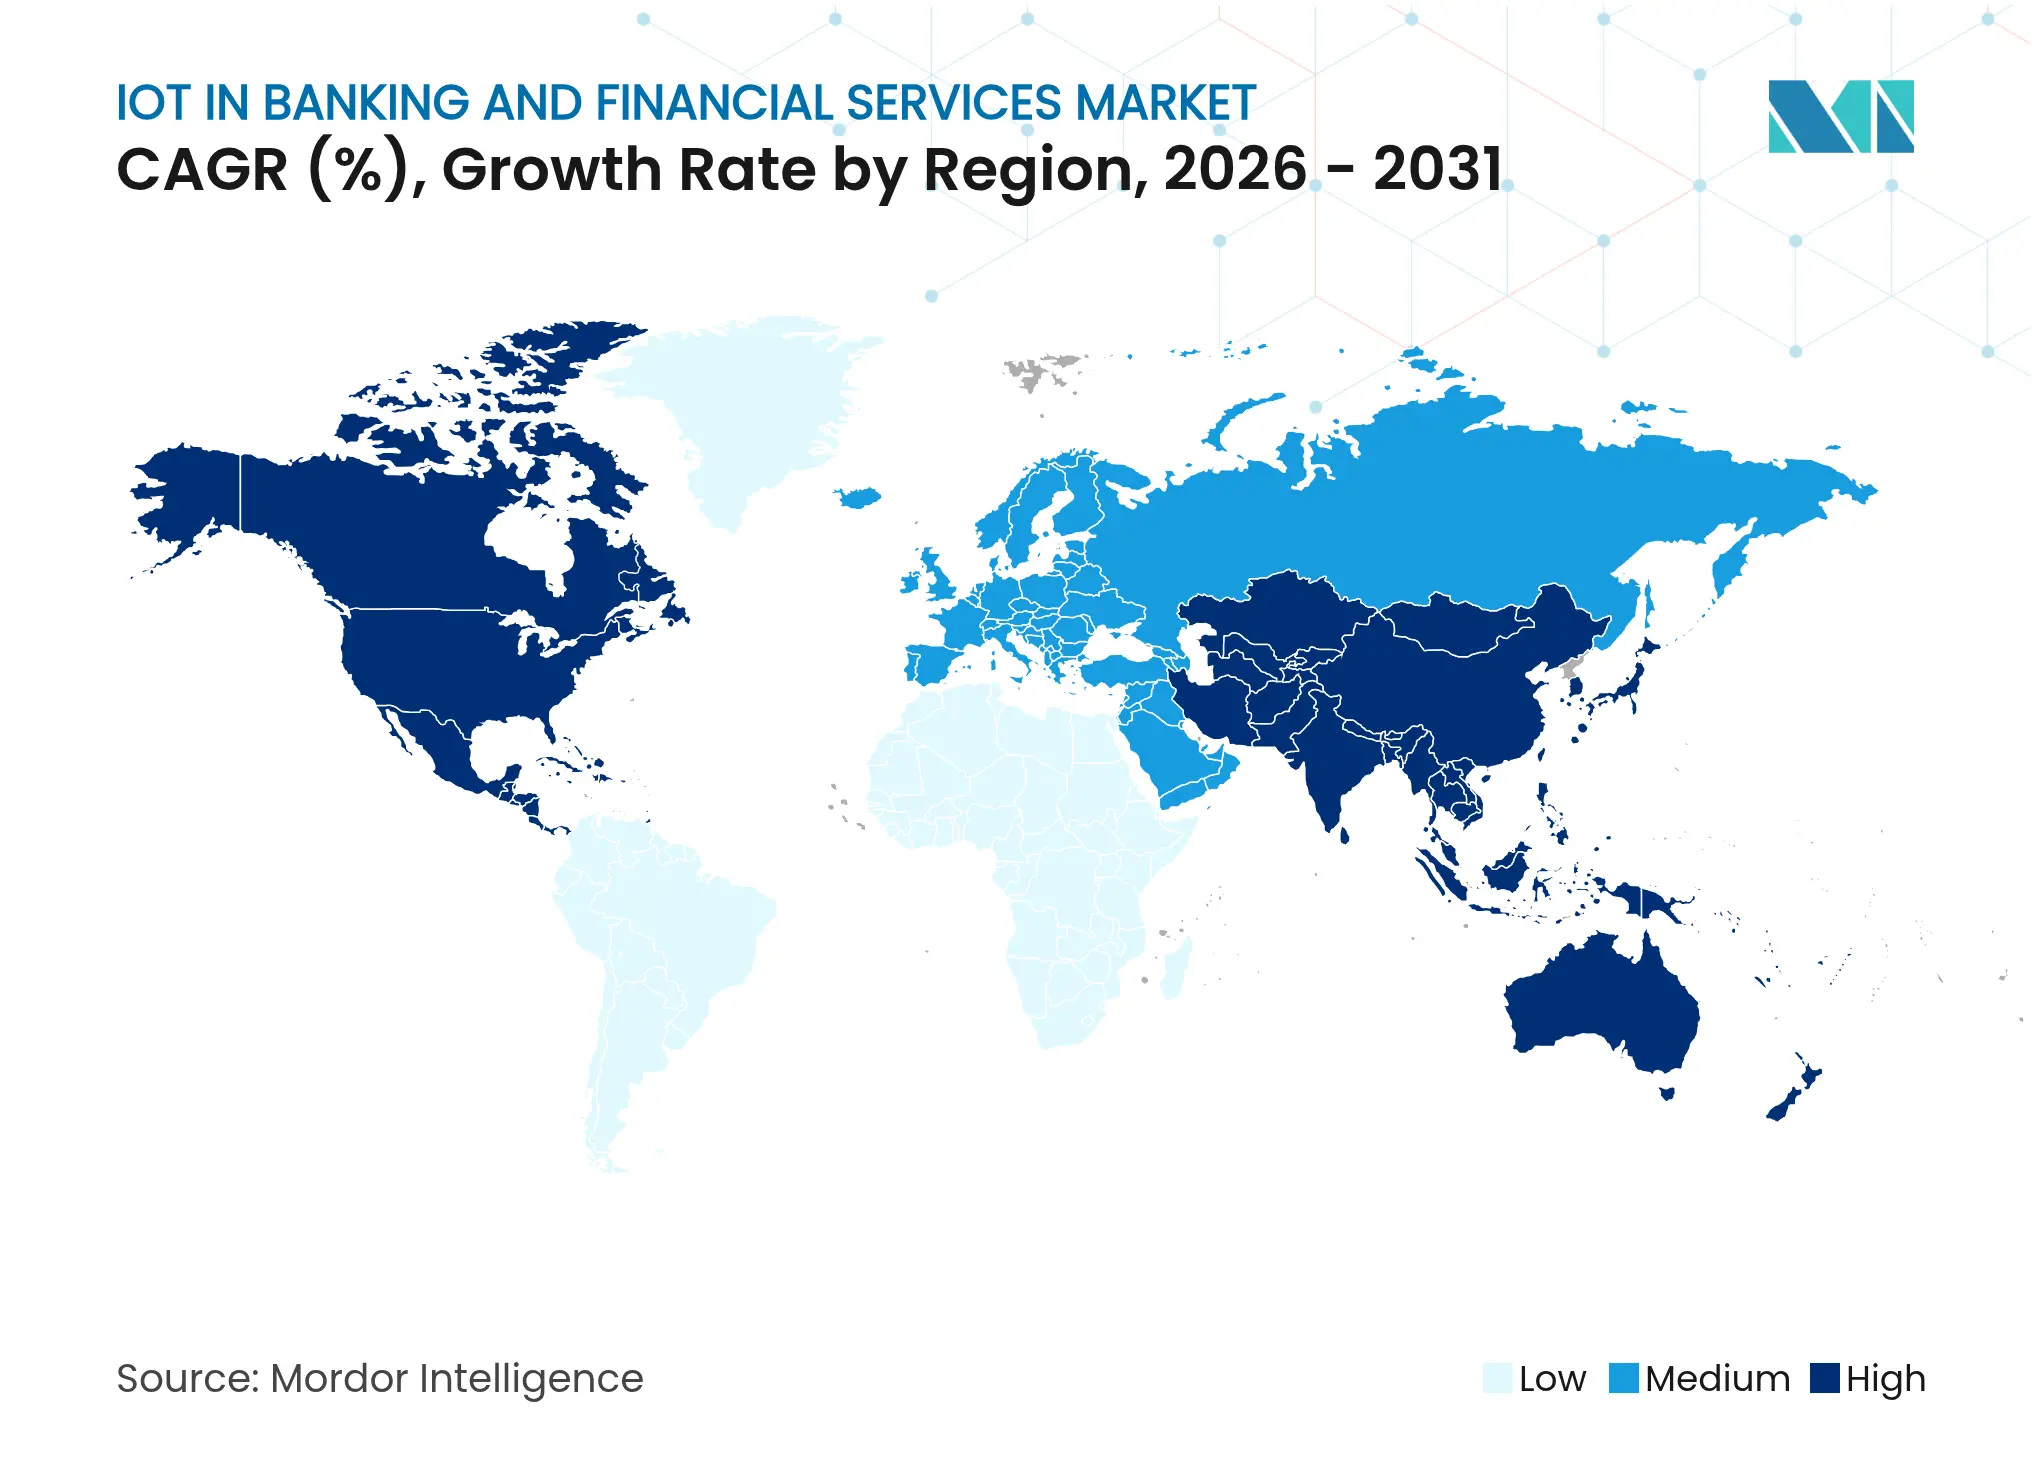
North America retained 37.05% IoT in Banking and Financial Services market share during 2025, anchored by FedNow’s real-time payment mandate, strict state cybersecurity statutes, and robust capital expenditure capacity. JPMorgan Chase’s USD 200 million branch-sensor retrofit typifies regional scaling efforts. Canadian banks advance interoperable digital-ID ecosystems through the Pan-Canadian Trust Framework, integrating biometric devices into KYC workflows. Mexico’s fintech law catalyzes smart-ATM rollouts to serve cash-reliant populations while meeting anti-fraud directives.
Asia-Pacific is surging at 27.58% CAGR toward 2031. China’s mobile payments already power nearly 70% of e-commerce spend, creating fertile ground for embedded IoT banking. Digital banks such as WeBank and KakaoBank leverage AI, cloud, and IoT to service customers at scale, skipping physical branches completely. Singapore’s MAS and Malaysia’s BNM issue tailored digital-bank licenses that embed device-level security requirements. India’s Unified Payments Interface supports billions of daily transactions, pushing banks to deploy IoT observability for uptime and fraud control.
Europe balances compliance and innovation, guided by PSD2, GDPR, and Instant Credit Transfers obligations that escalate demand for real-time monitoring. Banks integrate IoT gateways to derive instant SEPA settlement status while feeding audit logs into cloud SIEM systems. Middle East and Africa witness IoT-enabled financial-inclusion pilots; Ghana and Rwanda automate consumer-protection hotlines via AI chatbots connected to regulator dashboards. South America’s open-finance reforms, led by Brazil, entice fintechs to deploy IoT-native micro-POS terminals in underserved locales, further broadening the IoT in Banking and Financial Services market footprint.
Market Concentration
The IoT in Banking and Financial Services market is moderately fragmented. IBM, Microsoft, and Cisco ship horizontal platforms that bundle device management, AI analytics, and security, catering to tier-1 institutions needing enterprise-grade scale. KORE Wireless, InHand Networks, and Aeris specialize in LTE/5G connectivity, offering turnkey SIM lifecycle services that simplify global rollouts. Parabit’s access-control hardware protects 24 of the top 25 US retail banks, spotlighting depth over breadth.
Fintech disruptors exploit niche opportunities. Thought Machine’s cloud-native core pairs with Mastercard to speed real-time settlement APIs, edging into traditional vendor territory. Volante Technologies teams with Standard Bank to deliver Payments-as-a-Service across Africa, levering IoT telemetry to optimize uptime. Strategic alliances are multiplying: Citi inked a multi-year Google Cloud pact covering IoT observability, while Deutsche Bank joined Mastercard to power Request-to-Pay channels.
Pricing pressure keeps barriers moderate. Vendors differentiate through regulatory toolkits, AI model libraries, and managed-service SLAs rather than hardware specs. The top five suppliers collectively control roughly 60-65% of global revenue, leaving room for vertical specialists, suggesting steady but not overwhelming consolidation within the IoT in Banking and Financial Services market.

*Disclaimer: Major Players sorted in no particular order
1. INTRODUCTION
2. RESEARCH METHODOLOGY
3. EXECUTIVE SUMMARY
4. MARKET LANDSCAPE
5. MARKET SIZE AND GROWTH FORECAST (VALUE)
6. COMPETITIVE LANDSCAPE
7. MARKET OPPORTUNITIES AND FUTURE OUTLOOK
Market Definitions and Key Coverage
Segmentation Overview
Detailed Research Methodology and Data Validation
Primary Research
Desk Research
Market-Sizing & Forecasting
Data Validation & Update Cycle
Why Mordor's IoT In Banking And Financial Services Baseline Commands Reliability
Benchmark comparison
| Market Size | Anonymized source | Primary gap driver | ||
|---|---|---|---|---|
USD 61.23 B (2025) | Mordor Intelligence | - | Anonymized source:Mordor Intelligence | Primary gap driver:- |
USD 68.15 B (2024) | Regional Consultancy A | Adds IoT security spending from all industries and inflates forward via linear extrapolation | ||
USD 2.61 B (2024) | Trade Journal B | Counts hardware endpoints only and omits platform and analytics revenue | ||
USD 8.93 B (2024) | Industry Association C | Derives value from device counts multiplied by list prices, ignoring service contracts and cloud fees |
Pricing Strategy for Semiconductor Components
3 Min Read
Accelerating Additive Manufacturing Adoption in India
3 Min Read
US Market Entry for Taiwanese Machine Tool Manufacturers
5 Min Read
When decisions matter, industry leaders turn to our analysts. Let’s talk.