AI In IoT Market Size and Share
Market Overview
| Study Period | 2020 - 2031 |
|---|---|
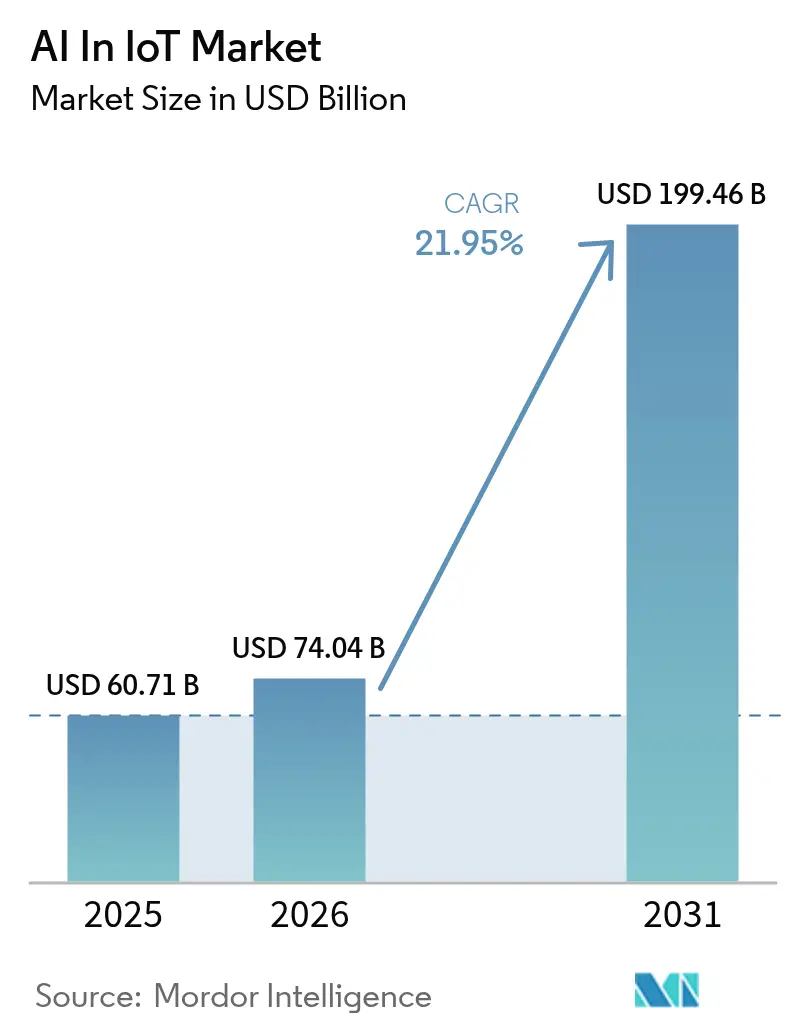
| Market Size (2026) | USD 74.04 Billion |
| Market Size (2031) | USD 199.46 Billion |
| Growth Rate (2026 - 2031) | 21.95% CAGR |
| Fastest Growing Market | Asia Pacific |
| Largest Market | North America |
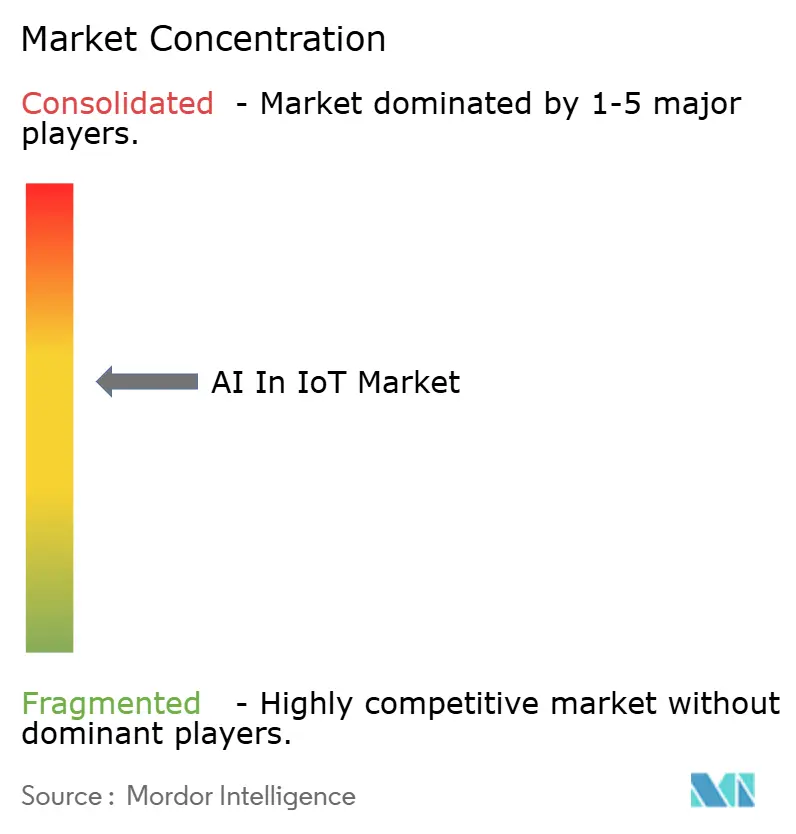
| Market Concentration | Medium |
Major Players *Disclaimer: Major Players sorted in no particular order Image © Mordor Intelligence. Reuse requires attribution under CC BY 4.0. | |
AI In IoT Market Analysis by Mordor Intelligence
The AI in IoT market size was valued at USD 60.71 billion in 2025 and estimated to grow from USD 74.04 billion in 2026 to reach USD 199.46 billion by 2031, at a CAGR of 21.95% during the forecast period (2026-2031). Growth reflects enterprises embedding artificial intelligence directly into connected devices to automate decisions at the edge, easing bandwidth pressures and enabling millisecond-level responses. Commercial 5G roll-outs and satellite extensions are removing latency barriers while tightening energy-efficiency rules in major economies push companies to deploy AI-optimised resource management. Predictive-maintenance programs are expanding as manufacturers seek resilient supply chains that avoid unplanned shutdowns. Competitive dynamics now hinge on edge-native software stacks and domain-specific models rather than raw cloud capacity, with mergers, such as Qualcomm’s March 2025 purchase of Edge Impulse for USD 1.4 billion, tightening the field[1]Qualcomm Technologies, “QCC730 Ultra-Low Power Wi-Fi SoC Launch,” qualcomm.com.
Key Report Takeaways
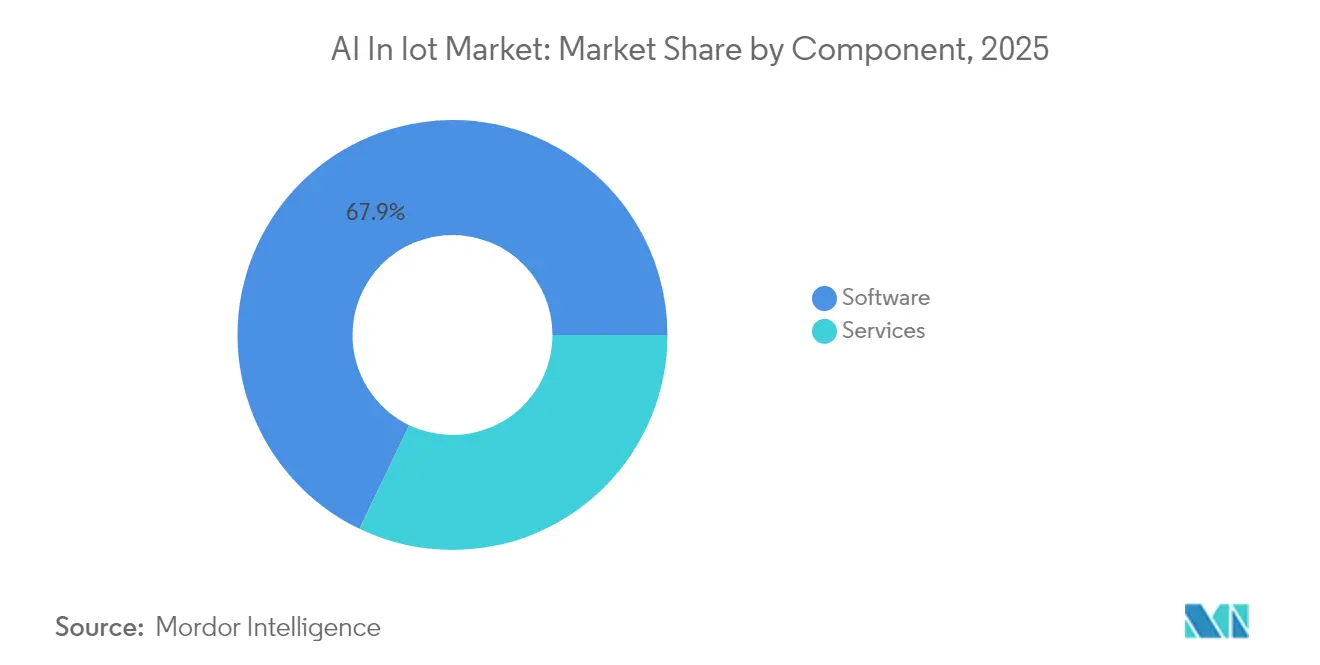
- By component, Software captured 67.88% of AI in IoT market share in 2025, while Services is projected to expand at a 23.6% CAGR to 2031.
- By deployment mode, On-premises deployments held 70.65% of the AI in IoT market size in 2025, whereas Cloud solutions register the fastest expected CAGR at 23.9% through 2031.
- By technology, Machine Learning and Deep Learning commanded 44.10% of total revenue in 2025; Natural Language Processing is forecast to grow quickest at 22.9% CAGR.
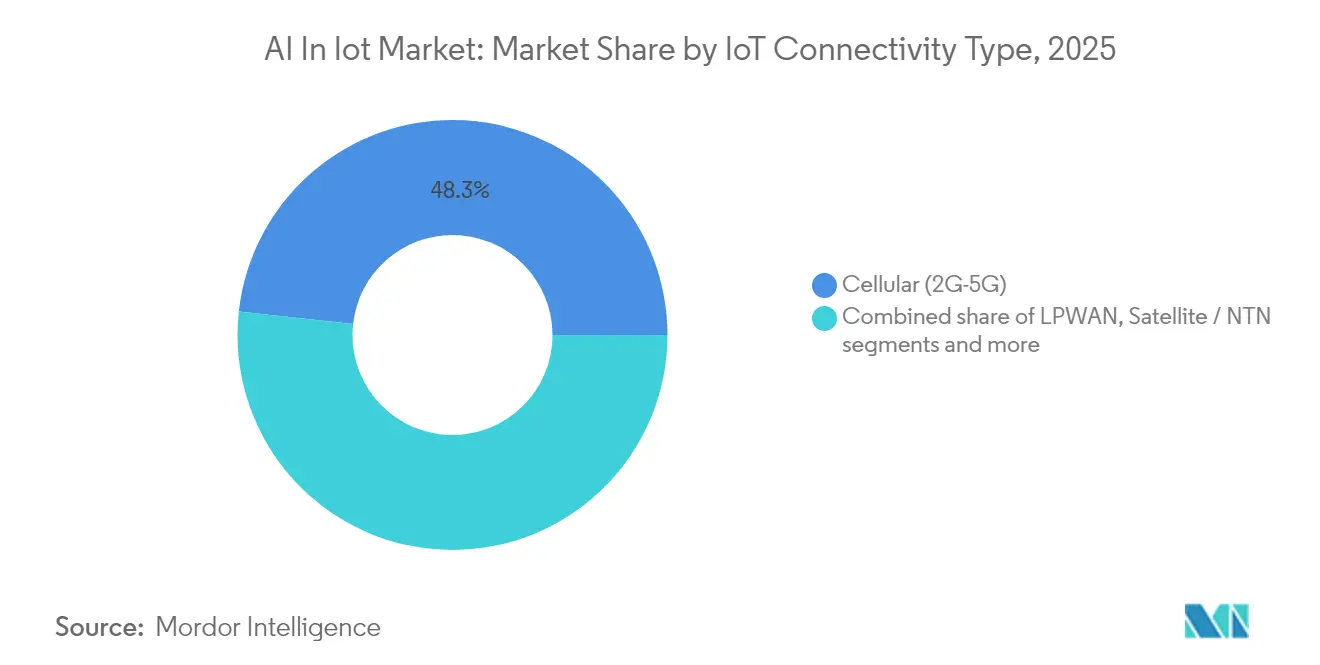
- By IoT connectivity type, Cellular networks accounted for 48.25% of the AI in IoT market size in 2025, while Satellite/NTN links are set to advance at a 23.1% CAGR.
- By end-user vertical, Manufacturing captured 23.85% of AI in IoT market share in 2025, whereas Healthcare is projected to expand at a 22.6% CAGR to 2031.
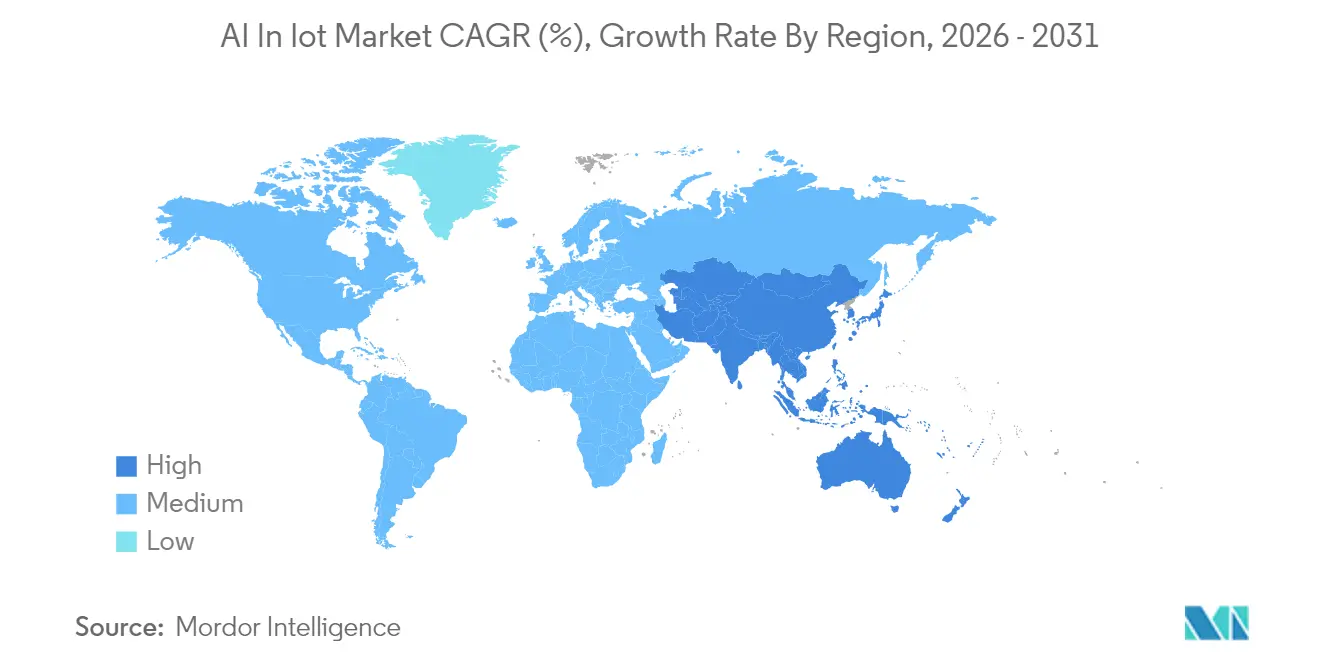
- By geography, North America led with 41.60% revenue share in 2025; Asia-Pacific is poised for the highest growth at 23.0% CAGR through 2031.
Note: Market size and forecast figures in this report are generated using Mordor Intelligence’s proprietary estimation framework, updated with the latest available data and insights as of 2026.
Global AI In IoT Market Trends and Insights
Drivers Impact Analysis*
| Driver | (~) % Impact on CAGR Forecast | Geographic Relevance | Impact Timeline |
|---|---|---|---|
| Rising big-data volumes generated by connected devices | +4.2% | Global, APAC lead | Medium term (2-4 years) |
| Demand for real-time AI analytics to monetise IoT data | +5.1% | North America and EU | Short term (≤ 2 years) |
| Edge-AI chipsets lowering latency and energy use | +3.8% | Global, manufacturing hubs | Medium term (2-4 years) |
| 5G-NTN convergence unlocking remote AIoT deployments | +2.9% | APAC core, spill-over to MEA | Long term (≥ 4 years) |
| Sustainability-linked regulations driving AI-optimised energy use | +3.4% | EU lead, North America next | Long term (≥ 4 years) |
| Predictive-maintenance push for supply-chain resilience | +2.8% | Global manufacturing corridors | Medium term (2-4 years) |
| Source: Mordor Intelligence | |||


Rising Big-Data Volumes Generated by Connected Devices
IoT end-points will create about 80 zettabytes of data in 2025, with industrial sensors contributing 73.1 zettabytes[2]Thales Group, “Massive IoT Analysis 2025,” thalesgroup.com. Processing this torrent in the cloud alone strains bandwidth budgets, so manufacturers are adopting edge AI that compresses and analyses streams on-site, trimming network costs and meeting sub-second response targets for quality control. Early movers report double-digit productivity gains after shifting critical analytics to smart controllers embedded in production lines. The pattern is spreading across logistics hubs and utilities where local inference prevents expensive back-haul of raw sensor feeds.
Demand for Real-Time AI Analytics to Monetise IoT Data
Retail banks, power traders and city transit operators note that insight loses value with every second of delay. Deployments now focus on turning live sensor readings into instant price optimisation, routing changes or safety alerts that directly lift revenue or cut penalties. Generative algorithms embedded on gateways are guiding warehouse staff, adjusting robotic paths and fine-tuning inventory in minutes instead of days. The emphasis on time-sensit¬ive monetisation is accelerating pilot-to-production cycles for edge AI platforms across developed economies.
Edge-AI Chipsets Lowering Latency and Energy Use
Purpose-built processors such as Qualcomm’s QCC730 Wi-Fi SoC cut power draw by 88% while running neural inference locally. These gains let battery-powered nodes handle vibration analysis or voice commands for years without maintenance. Neuromorphic designs move further, mimicking brain-like event-driven spikes that recognise patterns with minimal energy. Siemens’ Industrial Copilot for Operations demonstrates near-instant anomaly detection on the shop floor, shrinking reaction windows from seconds to milliseconds.
5G-NTN Convergence Unlocking Remote AIoT Deployments
Standardised 5G IoT-NTN links enable sensors to connect directly to satellites, extending coverage from forests to ocean lanes. Farmers now deploy autonomous drones that analyse crop stress in real time, while offshore rigs stream equipment health metrics to mainland control rooms without expensive microwave relays. Ericsson and Supermicro’s 2025 alliance integrates private 5G cores with edge servers so enterprises can bring AI workloads to isolated mines and ports[3]Ericsson, “Ericsson and Supermicro to Accelerate AI at the Edge,” ericsson.com.
Restraints Impact Analysis*
| Restraint | (~) % Impact on CAGR Forecast | Geographic Relevance | Impact Timeline |
|---|---|---|---|
| Data-security and privacy gaps across heterogeneous IoT nodes | -2.1% | Global, stricter EU rules | Short term (≤ 2 years) |
| Scarcity of AIoT-skilled talent and high integration costs | -1.8% | North America and EU | Medium term (2-4 years) |
| Fragmented standards limiting model portability | -1.4% | Worldwide | Medium term (2-4 years) |
| Looming post-quantum threats to device cryptography | -0.9% | Global critical infrastructure | Long term (≥ 4 years) |
| Source: Mordor Intelligence | |||
Data-Security and Privacy Gaps Across Heterogeneous IoT Nodes
Diverse device capabilities leave weakest-link gaps that adversaries exploit. A ScienceDirect review shows legacy sensors often lack secure boot or hardware roots of trust, exposing AI models to tampering. The EU Artificial Intelligence Act compels risk audits and encryption upgrades, adding compliance delays and budget overruns. Vendors respond with zero-trust frameworks and on-device anomaly detection, yet lifecycle patching remains arduous for fleets exceeding millions of assets.
Scarcity of AIoT-Skilled Talent and High Integration Costs
Full-stack expertise covering embedded firmware, networking, data science and domain process knowledge is rare. Integration projects frequently uncover unforeseen middleware work, inflating budgets and stretching timelines. Enterprises increasingly outsource to managed-service specialists, but ramp-up cycles for staff re-skilling still span almost two years. The talent gap restrains roll-outs despite clear return-on-investment cases.
*Our forecasts treat driver/restraint impacts as directional, not additive. The impact forecasts reflect baseline growth, mix effects, and variable interactions.
Segment Analysis
By Component: Software Platforms Anchor Growth
Software commanded 67.88% revenue in 2025, confirming that algorithms, middleware, and analytics engines drive most value creation within the AI in IoT market. Services expand at a 23.6% CAGR because enterprises outsource model tuning, device onboarding, and lifecycle monitoring. This surge fosters ecosystem consolidation around hyperscale platforms that bundle streaming analytics, edge orchestration, and zero-trust security. The AI in IoT market size for services-linked offerings is projected to expand quickly as companies prioritise managed uptime commitments. Meanwhile, licensing models for specialised inference engines are shifting toward subscription bundles aligned with device counts rather than perpetual fees, smoothing budgets yet locking customers into vendor roadmaps.
Second-generation application-management suites now automate model retraining based on concept drift while device-management portals push differential updates that limit downtime. Security layers grow more sophisticated, adding automated threat hunting that cross-correlates anomalies across fleets. These trends encourage hardware-agnostic architectures so customers can mix gateway brands without rewriting analytics pipelines. Commercial open-source cores joined with proprietary optimisation libraries balance transparency with performance, meeting stringent audit requirements.


By Deployment Mode: Hybrid Architectures Gain Momentum
On-premises deployments held a 70.65% share in 2025 because manufacturers and hospitals safeguard sensitive data and guarantee deterministic latency. Still, cloud workloads scale faster at 23.9% CAGR, reflecting a swing toward hybrid patterns where local inference feeds anonymised summaries to cloud clusters for heavy training tasks. The AI in IoT market benefits when enterprises keep personally identifiable data inside regulated facilities, yet exploit elastic graphics processing in hyperscale regions for seasonal retraining. Such dual-tier topologies reduce capital expense on local servers while preserving compliance objectives.
Edge gateways increasingly host containerised microservices that tunnel securely to public clouds for orchestration. This set-up lets operators update vision models nightly without halting production lines. Financial services firms adopt similar blueprints, storing individual transaction details on-site but leveraging cloud-resident large-language models to analyse aggregate trends. Cloud providers encourage the shift with private-link offerings that avoid the public internet and supply hardware-rooted confidential-computing enclaves.
By Technology: Machine Learning Foundations Prevail
Machine learning and deep learning together held 44.10% revenue in 2025, forming the backbone of predictive-maintenance, asset-tracking, and optimisation use cases. Natural language processing advances at 22.9% CAGR as voice interfaces enter smart factories and hospitals. Computer vision scales into quality inspection and worker-safety monitoring, while context-aware computing stitches sensor inputs with location, time, and user identity to personalise responses. The AI in IoT market size for computer-vision subsystems grows as high-resolution cameras pair with edge tensor accelerators.
Microcontroller-class TinyML unlocks inferencing for wearables and microclimate monitors that run on coin cells. Federated-learning frameworks train models across device swarms without centralising data, aligning with stricter privacy statutes. Vendors increasingly blend modalities; for instance, warehouse bots combine vision for obstacle detection, natural language for commands, and classical optimisation to schedule routes, lowering integration burden for operators.
By IoT Connectivity Type: Cellular Leads, Satellite Surges
Cellular links covering 2G through 5G owned a 48.25% share in 2025, owing to network ubiquity and new ultra-reliable low-latency 5G slices. Satellite and NTN connections post the fastest 23.1% CAGR, opening green-field opportunities in offshore wind farms, open-pit mines, and wildlife preserves. The AI in IoT market relies on short-range Wi-Fi, BLE, and Zigbee inside factories for dense sensor clusters, while LPWAN remains ideal for long-range, low-bitrate telemetry. Private 5G campuses let owners guarantee quality of service and isolate critical traffic from public networks, simplifying regulatory audits.
Bandwidth tiers align with workload classes. High-frame-rate video analytics favour millimetre-wave 5G, while sparse soil-moisture readings suit LPWAN. Satellite links backhaul processed edge-inference summaries, not raw frames, keeping airtime costs contained. Emerging chipsets support multi-bearer roaming so that a single board can switch between terrestrial and orbital networks according to price and availability.
By End-User Vertical: Manufacturing Holds the Lead
Manufacturing captured 23.85% revenue in 2025 after embedding AI-guided predictive maintenance into robotic cells and conveyor systems, reducing unexpected downtime. Healthcare grows fastest at 22.6% CAGR, fuelled by remote patient monitoring and AI-assisted imaging that supports telemedicine. The AI in IoT market share for manufacturing remains strong yet faces disruption as hospitals roll out connected infusion pumps and wearable diagnostics. Energy suppliers deploy AI-driven grid balancing to integrate intermittent renewables, while mobility operators pilot autonomous shuttle fleets orchestrated by edge servers.
Return-on-investment clarity separates leaders from laggards. Plants with legacy PLCs add retrofit sensor kits tied to SaaS anomaly-detection dashboards, achieving payback inside one budget cycle. Hospitals prioritise continuous vitals capture that feeds into AI triage algorithms, cutting the average length of stay. Governments scale traffic-signal timing optimisation city-wide after pilots demonstrate congestion cuts without new asphalt.
Geography Analysis
North America controlled 41.60% of revenue in 2025, powered by robust venture backing, extensive 5G roll-outs, and favourable intellectual property regimes. AWS alone budgeted more than USD 100 billion for new AI infrastructure in 2025, ensuring customers have low-friction access to high-performance compute. Federal programmes that fast-track smart port and defence projects further stimulate demand. Nevertheless, wage inflation and talent shortages temper the regional growth rate compared with emerging markets.
Asia-Pacific records the highest 23.0% CAGR through 2031. Chinese vendors integrate vertically from device silicon to cloud dashboards, compressing costs and accelerating iteration cycles. Japan and South Korea pair world-class robotics with dense nationwide 5G to commercialise real-time industrial vision. Government-funded smart-city schemes from India to Indonesia channel subsidies toward start-ups building traffic-monitoring, waste-sorting, and flood-alert systems. The AI in IoT market size for Asia-Pacific eclipses other regions in unit volumes, even though average selling prices remain lower.
Europe advances steadily as the Artificial Intelligence Act clarifies obligations and unlocks capital budgets despite adding compliance steps. Germany spearheads predictive maintenance in automotive lines, while the Netherlands pilots edge AI to control canal water levels. Data-sovereignty rules push enterprises to adopt on-premises and edge configurations, stimulating demand for confidential-computing processors. Middle East and Africa see early traction in oil-field surveillance and smart irrigation, where satellite backhaul circumvents sparse terrestrial coverage. Implementation pace is modest while local skills pipelines build up.

Competitive Landscape
The AI in IoT market shows moderate fragmentation. Hyperscale cloud providers supply integrated stacks that bundle device software, orchestration, and AI accelerators. Amazon, Microsoft, and Google continue to enlarge their partner catalogues by absorbing niche startups. Cisco’s USD 28 billion buyout of Splunk in 2025 positions the firm as a cross-domain analytics powerhouse that unifies IT and operational data[4]Cisco Systems, “Cisco Completes Splunk Acquisition,” cisco.com. Qualcomm’s acquisition of Edge Impulse injects a 170,000-developer community into its silicon roadmap, boosting stickiness for OEMs building on Snapdragon and RB5 lines.
Industrial incumbents fight back by embedding AI into control systems familiar to plant engineers. Siemens pairs its Industrial Copilot with existing PLC engineering suites, while Honeywell rolls out Forge-based edge nodes that tie into building-management installations. Hardware makers partner with cloud firms to offer turnkey bundles; Ericsson teams with Supermicro to fuse 5G radios and GPU servers, slashing integration time for retailers spinning up grab-and-go stores. Emerging specialists focus on cryptography hardened for quantum attacks and on ultrasmall models optimised for ARM Cortex-M chips.
Differentiation now hinges on developer experience and vertical playbooks rather than generic API breadth. Vendors court solution integrators with low-code workflow builders, pretrained model libraries, and multi-tenant security blueprints. Pricing converges toward consumption-based metrics such as messages per second or inferences per month, encouraging experimentation but challenging revenue predictability.
AI In IoT Industry Leaders
Amazon Web Services Inc. (Amazon Inc.)
IBM Corporation
Google LLC (Alphabet Inc.)
Microsoft
NVIDIA
- *Disclaimer: Major Players sorted in no particular order

Recent Industry Developments
- June 2025: Cisco unveiled AI-ready data-centre solutions including AI Canvas workspace and unified Nexus Dashboard to streamline secure AIoT infrastructure.
- June 2025: Ericsson and Supermicro partnered to merge 5G connectivity with edge AI platforms for low-latency retail, healthcare and industrial deployments.
- May 2025: Qualcomm and HUMAIN signed an MoU to build advanced AI data centres and hybrid AI solutions in Saudi Arabia, supporting Vision 2030 goals.
- May 2025: Marubeni and Soracom formed a joint venture to deliver integrated wireless IoT services across global markets.
- April 2025: Toshiba expanded the ifLink open IoT platform to overseas markets, simplifying device onboarding for developers.
- March 2025: Qualcomm completed the USD 1.4 billion acquisition of Edge Impulse, strengthening edge AI developer tooling.


Research Methodology Framework and Report Scope
Market Definitions and Key Coverage
Mordor Intelligence defines the AI in IoT market as the worldwide revenue generated when artificial intelligence software, services, and enabling chipsets are embedded in connected endpoints or gateways to automate local or cloud decisions across industrial and consumer verticals.
Generic IoT devices that transmit data but run no AI inference and stand-alone enterprise AI platforms unlinked to IoT telemetry are kept outside this estimate.
Segmentation Overview
- By Component
- Software
- Application Management
- Connectivity Management
- Device Management
- Data Management
- Network Bandwidth Management
- Real-time Streaming Analytics
- Remote Monitoring
- Security
- Edge Solution
- Services
- Managed Services
- Professional Services
- Software
- By Deployment Mode
- On-premises
- Cloud
- By Technology
- Machine Learning and Deep Learning
- Natural Language Processing
- Computer Vision
- Context-Aware Computing
- By IoT Connectivity Type
- Cellular (2G-5G)
- LPWAN (LoRa, NB-IoT, Sigfox)
- Satellite / NTN
- Short-range (Wi-Fi, BLE, Zigbee)
- By End-user Vertical
- Manufacturing
- Energy and Utilities
- Healthcare
- BFSI
- IT and Telecom
- Transportation and Mobility
- Government
- Retail and e-Commerce
- Agriculture
- By Geography
- North America
- United States
- Canada
- Mexico
- Europe
- Germany
- United Kingdom
- France
- Italy
- Spain
- Russia
- Rest of Europe
- Asia-Pacific
- China
- Japan
- India
- South Korea
- ASEAN
- Australia and New Zealand
- Rest of Asia-Pacific
- South America
- Brazil
- Argentina
- Rest of South America
- Middle East and Africa
- Middle East
- Saudi Arabia
- UAE
- Turkey
- Rest of Middle East
- Africa
- South Africa
- Nigeria
- Rest of Africa
- Middle East
- North America
Detailed Research Methodology and Data Validation
Primary Research
We interviewed edge AI silicon designers, cloud IoT platform architects, and operations heads at manufacturers in North America, Europe, and Asia Pacific. Their feedback clarified typical gateway volumes, average selling prices, and the pace at which legacy nodes gain on-device inference, allowing us to tighten model assumptions that secondary data alone left broad.
Desk Research
Our analysts compiled foundational inputs from tier one public datasets, such as ITU device density trackers, GSMA Intelligence IoT connections, UN Comtrade sensor chip exports, and NIST edge AI standards, supplemented by company 10-Ks, quarterly earnings calls, and patent filings. Paid repositories like D&B Hoovers for vendor financial splits and Dow Jones Factiva for deal flow offered structured feeds that guided further inquiry. These sources illustrate the landscape yet remain illustrative, not exhaustive.
Market-Sizing & Forecasting
A top down demand pool was built from installed connected device counts and per node AI enablement rates, which are then cross checked with sampled chip shipment roll ups and software license surveys for bottom up reasonableness. Key variables include 5G penetration, edge AI accelerator ASP erosion, cloud egress fees, predictive maintenance uptake, regulatory latency mandates, and regional electricity tariffs. Multivariate regression paired with scenario analysis projects their influence through 2030, and gaps in granular shipment data are bridged using validated industry penetration ratios.
Data Validation & Update Cycle
Outputs undergo variance scans against independent shipment tallies and macro indicators before senior analyst sign off. Models refresh each year, with interim revisions triggered by material M&A or policy shifts; a final pre publication sweep ensures clients always see the newest baseline.
Why Our AI In IoT Baseline Commands Reliability
Published figures often diverge because firms adopt different device mixes, valuation layers, and refresh cadences. When definitions stretch to all IoT hardware or, conversely, shrink to cloud licenses, totals swing widely.
Key gap drivers include: 1) whether ancillary edge hardware is monetized, 2) how aggressively future AI attach rates are assumed, 3) currency conversion timing, and 4) cadence of primary validation. Mordor's scope tracks only endpoints running active inference in the base year, applies region specific ASP curves vetted with practitioners, and updates annually, yielding a balanced view.
Benchmark comparison
| Market Size | Anonymized source | Primary gap driver |
|---|---|---|
| USD 60.71 B (2025) | Mordor Intelligence | - |
| USD 87.51 B (2024) | Global Consultancy A | Includes all IoT hardware spend and counts predictive AI software twice, inflating value. |
| USD 33.3 B (2023) | Industry Publisher B | Restricts scope to platform licenses, excludes edge AI silicon and services, and relies on older base year. |
The comparison shows that wider hardware bundling or narrower software only lenses drive most variance, whereas Mordor's disciplined scope and yearly refresh deliver a transparent, repeatable baseline suited for confident decision making.


Key Questions Answered in the Report
What is the current value of the AI in IoT market?
The market stands at USD 74.04 billion in 2026 and is forecast to reach USD 199.46 billion by 2031.
Which segment holds the largest share of spending?
Software dominates with 67.88% revenue share, reflecting the importance of analytics and platform software.
Which deployment model is growing fastest?
Cloud-based AIoT solutions are projected to rise at a 23.9% CAGR as firms balance scalability with data-sovereignty.
Where is regional growth most rapid?
Asia-Pacific leads future expansion with a 23.0% CAGR, driven by manufacturing digitisation and 5G roll-outs.
Which end-user vertical offers the greatest revenue upside?
Healthcare is forecast to grow at 22.6% CAGR, fuelled by telemedicine and remote-patient monitoring.
How concentrated is the competitive landscape?
Market concentration is moderate—top five vendors control roughly 60% of revenue—so specialist providers still find room to differentiate.
Page last updated on:


