IoT Devices Market Size and Share
Market Overview
| Study Period | 2020 - 2031 |
|---|---|
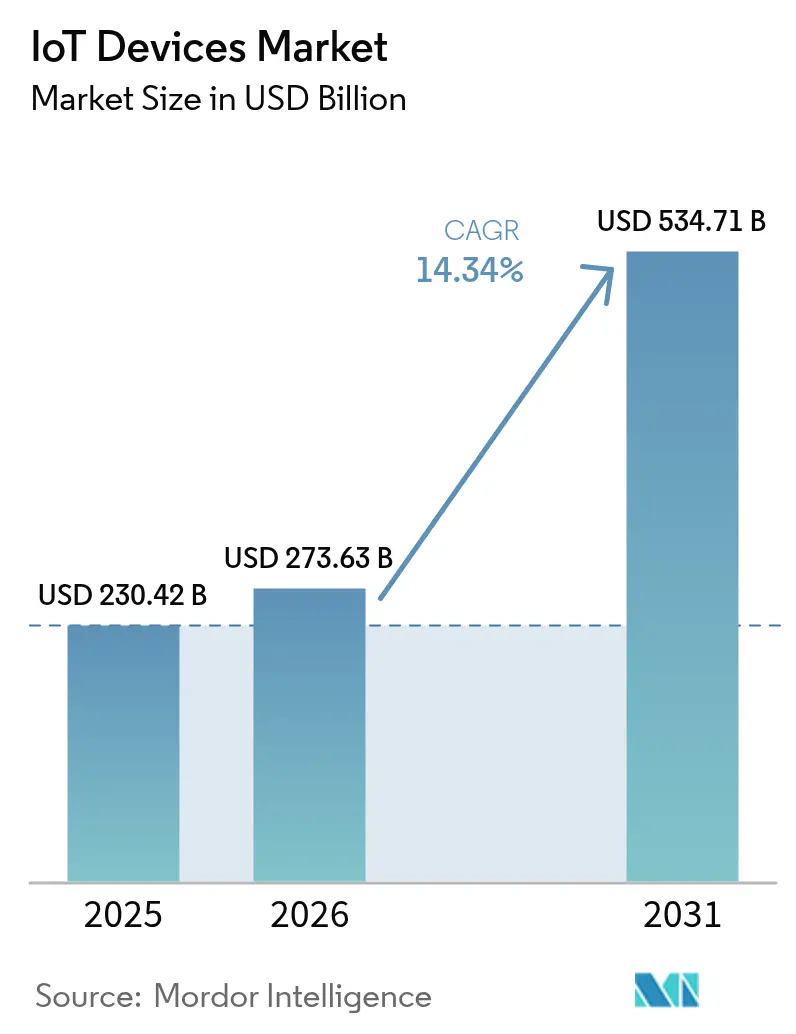
| Market Size (2026) | USD 273.63 Billion |
| Market Size (2031) | USD 534.71 Billion |
| Growth Rate (2026 - 2031) | 14.34% CAGR |
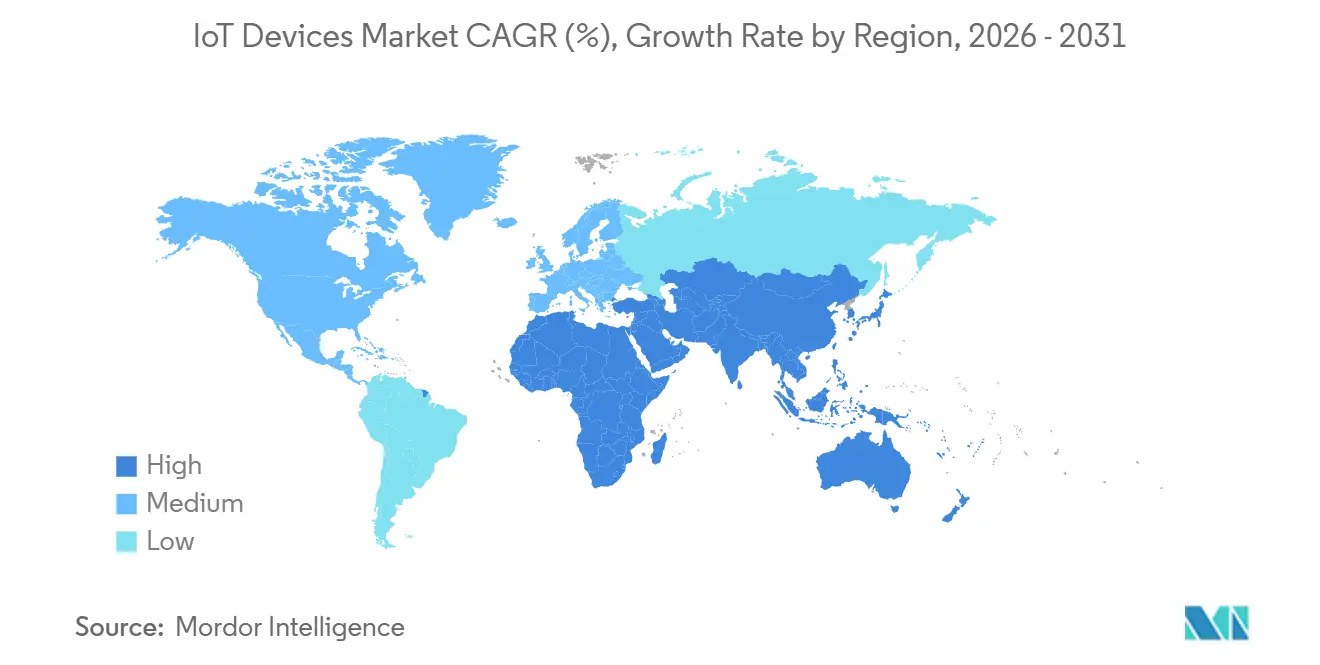
| Fastest Growing Market | North America |
| Largest Market | Asia Pacific |
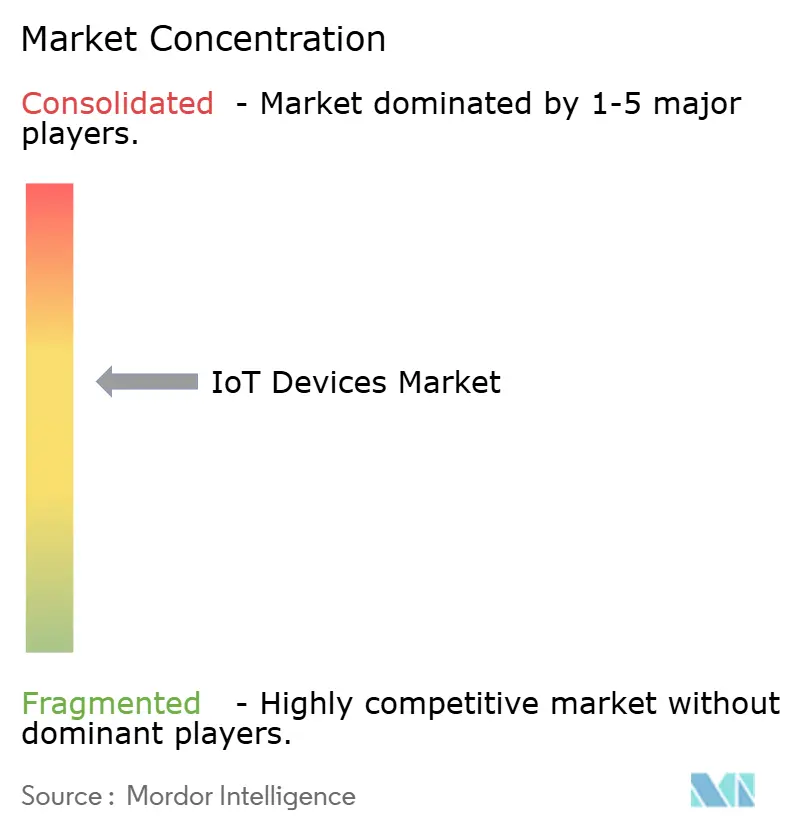
| Market Concentration | Medium |
Major Players *Disclaimer: Major Players sorted in no particular order Image © Mordor Intelligence. Reuse requires attribution under CC BY 4.0. | |
IoT Devices Market Analysis by Mordor Intelligence
The IoT devices market size is expected to increase from USD 230.42 billion in 2025 to USD 273.63 billion in 2026 and reach USD 534.71 billion by 2031, growing at a CAGR of 14.34% over 2026-2031. Adoption is rising because enterprises now deploy interoperable device fleets that combine edge intelligence, low-power wide-area connectivity, and cloud orchestration. Federal and European reimbursement reforms for remote patient monitoring are stimulating medical hardware orders, while vehicle-to-everything regulations in North America, the European Union, and China are embedding connectivity into new vehicles at scale. Sovereign data-residency rules are also pushing machine-learning inference onto device silicon, lifting demand for microcontrollers that include neural engines. At the same time, spectrum alignment for LPWAN in Asia is cutting roaming fees and enabling logistics firms to track assets across borders. These shifts are translating into double-digit shipment growth across consumer, industrial, and infrastructure verticals.
Key Report Takeaways
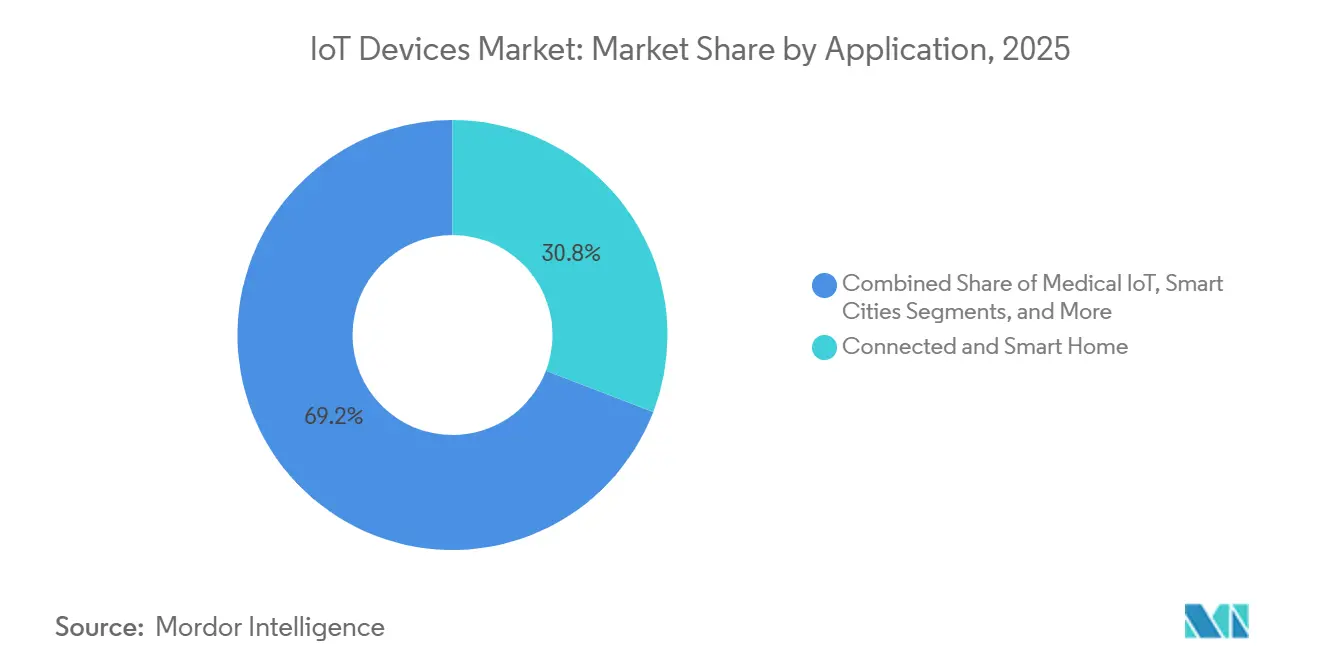
- By application, Connected and Smart Home held 30.82% of IoT devices market share in 2025, while Smart Agriculture is projected to expand at a 14.39% CAGR through 2031.
- By device category, Smart Speakers and Displays captured 26.61% of IoT devices market share in 2025; Connected Consumer Appliances are forecast to grow at a 14.43% CAGR to 2031.
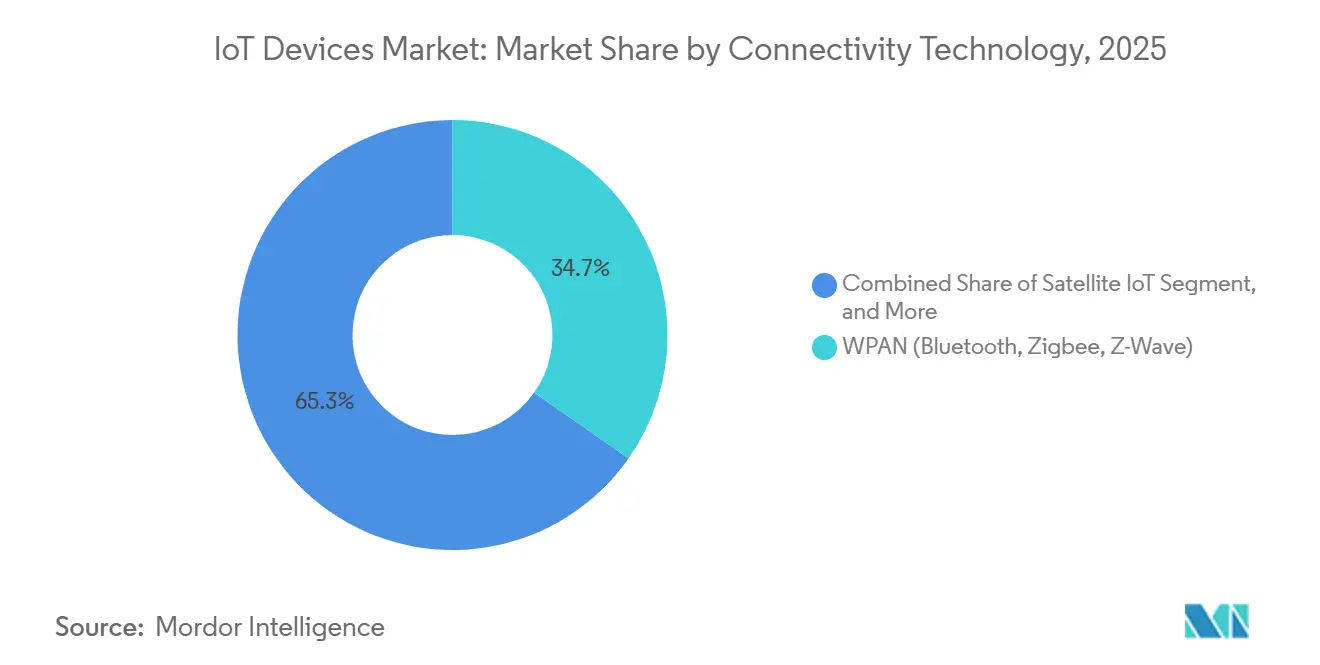
- By connectivity technology, WPAN protocols accounted for 34.74% of the IoT devices market size in 2025, whereas Satellite IoT is set to advance at a 14.48% CAGR during 2026-2031.
- By power source, Battery-powered units commanded 61.53% of the IoT devices market size in 2025, and Energy-harvested solutions are expected to post a 14.53% CAGR through 2031.
- By geography, Asia-Pacific led with 41.72% of IoT devices market share in 2025, while North America is on track for a 14.62% CAGR during 2026-2031.
Note: Market size and forecast figures in this report are generated using Mordor Intelligence’s proprietary estimation framework, updated with the latest available data and insights as of 2026.
Global IoT Devices Market Trends and Insights
Drivers Impact Analysis*
| Driver | (~) % Impact on CAGR Forecast | Geographic Relevance | Impact Timeline |
|---|---|---|---|
| 5G and LPWAN Roll-Outs Accelerating Massive-IoT Shipments | +2.4% | Global, with early concentration in China, South Korea, North America, and Western Europe | Medium term (2-4 years) |
| Edge-AI Silicon Cost Decline Expanding Vision-Enabled Industrial IoT | +2.1% | APAC manufacturing hubs, North America and Europe industrial corridors | Medium term (2-4 years) |
| Reimbursement Policies Boosting Remote-Patient Monitoring Devices | +1.8% | North America, Western Europe, with pilot programs in Japan and Australia | Short term (≤ 2 years) |
| V2X Regulations Catalyzing Connected-Car Hardware Installations | +1.6% | North America, European Union, China | Medium term (2-4 years) |
| AI-Native Chiplets Enabling Sub-USD 1 Secure Micro-Controllers | +1.5% | Global, with design leadership in North America and APAC fabrication | Long term (≥ 4 years) |
| Smart-Meter Mandates Driving Connected-Energy Devices | +1.9% | European Union, India, select U.S. states, Middle East smart-city projects | Short term (≤ 2 years) |
| Source: Mordor Intelligence | |||


5G and LPWAN Roll-Outs Accelerating Massive-IoT Shipments
RedCap 5G networks launched in 27 countries during 2025, offering mid-tier bandwidth that fits cameras, wearables, and industrial sensors without the high energy draw of enhanced mobile broadband.[1]Ericsson, “Mobility Report 2025,” ericsson.com Operators priced annual data plans below USD 2 per device, making nationwide deployments economical. Parallel growth in LoRaWAN and NB-IoT, especially in India and Brazil where utilities replaced legacy meters, boosted unit volumes past 180 million in 2025. Harmonized 900 MHz spectrum in ASEAN now lets logistics providers use one hardware design across multiple countries. These developments lower connectivity costs, remove roaming barriers, and unlock long-tail use cases that require billions of low-throughput links.
Edge-AI Silicon Cost Decline Expanding Vision-Enabled Industrial IoT
Microcontrollers with on-board neural engines fell below USD 3 at million-unit scale in 2025, allowing manufacturers to add real-time defect detection to cameras without sending images to the cloud.[2]Synaptics, “Investor Day 2025 Presentation,” synaptics.com Automotive suppliers deployed these systems on paint lines and reduced scrap rates by up to 18% in German and Japanese plants. Local inference also satisfies European data-sovereignty rules and keeps latency under 10 milliseconds, a threshold required for safety-critical tasks. Vendors now bundle hardware encryption with neural engines, helping factories meet IEC 62443 cybersecurity benchmarks. Lower silicon prices, regulatory pressure, and security features are driving rapid penetration of vision-enabled sensors on the factory floor.
Reimbursement Policies Boosting Remote-Patient Monitoring Devices
The U.S. Centers for Medicare and Medicaid Services extended billing codes in January 2026 to cover connected glucose monitors, blood-pressure cuffs, and oximeters prescribed for chronic care.[3]U.S. Centers for Medicare and Medicaid Services, “Remote Patient Monitoring Final Rule 2026,” cms.gov Private insurers in Germany and the United Kingdom mirrored the move, provided devices carry CE marking and integrate with EHR systems via HL7 FHIR interfaces. These changes turn connected devices into reimbursable expenses, expanding the U.S. addressable market by USD 1.2 billion. Device approvals accelerated, with 14 remote-monitoring products cleared by the FDA in 2025, up from eight a year earlier. Japan adopted tiered payments favoring wearables that transmit data twice daily, pushing suppliers toward cellular rather than Bluetooth designs to ensure compliance.
V2X Regulations Catalyzing Connected-Car Hardware Installations
The U.S. Federal Communications Commission ruled that all new light-duty vehicles sold after January 2027 must embed 5.9 GHz C-V2X modules. Europe enacted a parallel directive for commercial vehicles above 3.5 tonnes in 2025. China imposed C-V2X requirements in 12 mega-cities by end-2026, covering Beijing, Shanghai, and Shenzhen. Chip vendors shipped over 4 million automotive-grade modems during 2025 to meet these timelines. Automakers are consolidating around global platforms that support multiple standards, increasing the bill of materials but enabling insurance discounts and fleet-efficiency gains that offset the extra hardware cost.
Restraints Impact Analysis*
| Restraint | (~) % Impact on CAGR Forecast | Geographic Relevance | Impact Timeline |
|---|---|---|---|
| Fragmented Firmware-Update Ecosystems Creating Cyber-Risk | -1.3% | Global, with acute exposure in industrial IoT and legacy building-automation systems | Short term (≤ 2 years) |
| Semiconductor Supply Volatility for Ultra-Low-Power MCUs | -1.1% | Global, with bottlenecks in 40 nm and 28 nm process nodes | Medium term (2-4 years) |
| Absence of Energy-Harvesting Standards Hindering Battery-Less Sensors | -0.8% | North America and Europe industrial deployments, APAC pilot projects | Long term (≥ 4 years) |
| Grey-Market LPWAN Modules Undermining Type-Approval Compliance | -0.7% | Emerging markets in South America, Africa, and Southeast Asia | Medium term (2-4 years) |
| Source: Mordor Intelligence | |||
Fragmented Firmware-Update Ecosystems Creating Cyber-Risk
Around 40% of installed IoT controllers lack reliable over-the-air update paths, keeping known vulnerabilities unpatched for months. In 2025 CISA published 18 advisories targeting industrial gear whose owners faced expensive on-site visits to install fixes. Proprietary bootloaders and competing update protocols block enterprises from adopting a single patch workflow. Cyber-insurance providers reacted by raising premiums 15-25% unless quarterly updates are proven. Without a universal standard akin to automotive UNECE WP.29, firms accrue technical debt that eventually forces costly retrofits or early device replacement.
Semiconductor Supply Volatility for Ultra-Low-Power MCUs
Lead times for 40 nm and 28 nm microcontrollers stretched to 26 weeks in 2025, as foundries prioritized advanced nodes for smartphones and AI accelerators. Some OEMs absorbed USD 1 per unit extra to redesign boards for 22 nm alternatives, while others delayed launches and lost design wins. Governments pledged USD 52 billion to expand mature-node capacity, but new fabs will not reach volume production before 2028. Until then, supply uncertainty will keep prices elevated and favor incumbents with long-term wafer contracts.
*Our forecasts treat driver/restraint impacts as directional, not additive. The impact forecasts reflect baseline growth, mix effects, and variable interactions.
Segment Analysis
By Application: Smart Agriculture Outpaces Saturated Smart-Home Adoptin
Smart Agriculture is set to rise at a 14.39% CAGR during 2026-2031 on the back of precision irrigation and livestock-health monitors in water-stressed zones such as California’s Central Valley and India’s Punjab. The IoT devices market size for smart-home applications climbed to 30.82% share in 2025, but growth is slowing because household penetration now exceeds one-third in North America and Western Europe.
Medical IoT accelerated after U.S. reimbursement reforms, taking 18% of the application pie in 2025. FDA approvals rose 40% year over year, shortening product launch cycles and making connected health gear a rising revenue source. Connected-car deployments track V2X deadlines yet still face long homologation cycles that defer revenue recognition. Industrial IoT remains the largest enterprise opportunity, as vibration and thermal sensors cut downtime by up to 30% in pilot plants.


By Device Category: Appliances Gain Momentum Under Energy Mandates
Smart Speakers and Displays delivered 26.61% of IoT devices market share in 2025, but replacement windows have extended to four years, slowing further gains. Connected Consumer Appliances are forecast to grow at 14.43% through 2031 because European and Californian rules now oblige refrigerators and thermostats to report real-time power use.
Wearables sustain double-digit expansion as pulse-oximetry and atrial-fibrillation detection receive FDA clearance, positioning devices for health savings account reimbursement. Industrial sensors post the highest average selling price, reflecting ruggedized enclosures and explosion-proof certifications. GPS trackers for scooters and e-bikes are scaling after London and Paris mandated live-location feeds to enforce parking rules.
By Connectivity Technology: Satellite Links Extend Reach to Remote Assets
WPAN retained 34.74% share in 2025 thanks to Bluetooth and Zigbee dominance in homes and wearables, yet satellite IoT is projected to post a 14.48% CAGR as constellations provide global coverage without terrestrial gaps. Cellular RedCap modules shipped at prices 30% below 5G eMBB alternatives, opening mid-bandwidth markets such as retail kiosks and job-site cameras.
LPWAN remains pivotal for metering and logistics, while hybrid modules that fuse cellular and LoRa cut design complexity and route traffic based on coverage. The Matter standard unifies WPAN and Wi-Fi at the application layer, easing multi-brand setups and spurring replacement purchases.
By Power Source: Energy Harvesting Squeezes Battery Dependence
Battery packs powered 61.53% of shipments in 2025, but energy-harvested nodes are forecast to grow 14.53% through 2031 as factories adopt vibration harvesters that end costly shutdowns for battery swaps. Photovoltaic cells already sustain parking sensors and outdoor air-quality monitors in sunny regions, while piezoelectric transducers feed accelerometers on rotating equipment.
Mains-powered devices stay relevant in fixed locations, yet lithium primary cells now last five to ten years in low-duty-cycle gear like door sensors, narrowing the use-case gap. Standards for harvested power remain unsettled, forcing suppliers to craft bespoke interfaces and limiting scale.
Geography Analysis
North America is projected to grow at 14.62% between 2026 and 2031, outpacing other regions. U.S. Farm Bill grants worth USD 800 million fund sensor-driven irrigation, and V2X mandates compel automakers to add connectivity by 2027. Utilities in Texas and Ontario installed 12 million smart meters in 2025 to support time-of-use tariffs. Mexico’s factories are adding predictive-maintenance sensors to meet export quality standards, driving local demand for rugged industrial modules.
Asia-Pacific held 41.72% share in 2025, fueled by China’s smart-city procurements, India’s metering mandates, and factory automation in ASEAN. Domestic suppliers shipped 450 million modules, giving the region strong local ecosystems. Japan and South Korea rolled out more than 50 enterprise 5G networks each to service semiconductor and automotive plants that need sub-millisecond latency.
Europe continues to scale IoT under the Green Deal, mandating connected thermostats, occupancy sensors, and smart chargers. Germany, France, and Italy are adding predictive-maintenance devices in heavy industries to curb downtime. The Middle East is using IoT in megaprojects such as NEOM, where autonomous vehicles and drone logistics are embedded from day one. Africa remains early stage, with pilot smart-meter and agriculture programs in South Africa and Nigeria. South America is expanding satellite IoT to monitor cattle and grain silos across remote farmland.

Competitive Landscape
Roughly 45% of 2025 revenue accrued to the top ten vendors, indicating moderate concentration. Consumer segments are price-competitive, with Amazon, Apple, Samsung, and Alphabet relying on ecosystem stickiness as hardware margins fall into single digits. Industrial and automotive domains have higher barriers because ISO 26262 and IEC 61508 certifications deter rapid supplier churn, favoring Siemens, Honeywell, Bosch, and NXP.
Startups exploit open hardware and chiplet architectures to slash development cycles from a year to eight weeks, attracting mid-tier OEMs that lack RF design skills. Technology differentiation is moving toward edge AI and multiyear battery life. Patent filings in 2025 focused on wake-up radios and secure boot, with Qualcomm, Ericsson, and Huawei each adding more than 200 IoT patents. Participation in standards such as Matter and 5G RedCap lets contributors shape reference designs and win early silicon sockets.
IoT Devices Industry Leaders
Apple Inc.
Cisco Systems Inc
Google Inc. (Alphabet)
Samsung Electronics Co. Limited
Huawei Technologies Co. Ltd.
- *Disclaimer: Major Players sorted in no particular order

Recent Industry Developments
- January 2026: CMS broadened reimbursement to cover connected glucose monitors, blood-pressure cuffs, and oximeters, enlarging the U.S. remote-monitoring device market by USD 1.2 billion.
- December 2025: Qualcomm crossed 4 million automotive C-V2X chipset shipments, supplying tier-one electronic control unit makers in three regions.
- November 2025: Siemens won a USD 22 million project to install industrial IoT sensors across eight Indian auto plants, aiming to cut downtime by one-quarter.
- October 2024: Amazon launched Matter-compatible Echo devices that double as Thread border routers, reducing smart-home setup friction.


Global IoT Devices Market Report Scope
IoT is a network of internet-connected objects. These objects collect and exchange data using sensors embedded within them. IoT systems connect specialized devices designed for specific purposes with limited programmability and customizability. Moreover, IoT systems also store and process data in a distributed manner.
The IoT Devices Market Report is Segmented by Application (Connected and Smart Home, Medical IoT, Connected Car, Smart Cities, Industrial IoT, Personal IoT, Smart Agriculture, Other Applications), Device Category (Smart Speakers and Displays, Wearables, Connected Consumer Appliances, Smart Energy and Utility Devices, Industrial Sensors and Actuators, Connected Cameras and Security Devices, Micro-mobility Trackers, Self-powered Environmental Sensors), Connectivity Technology (WPAN, WLAN, LPWAN, Cellular, Satellite IoT, Hybrid Multi-band Modules), Power Source (Battery-powered, Energy-harvested, Mains-powered), and Geography (North America, South America, Europe, Asia-Pacific, Middle East, Africa). The Market Forecasts are Provided in Terms of Value (USD).
| Connected and Smart Home |
| Medical IoT |
| Connected Car |
| Smart Cities |
| Industrial IoT |
| Personal IoT |
| Smart Agriculture |
| Other Applications |
| Smart Speakers and Displays |
| Wearables (Watches, Bands, Hearables) |
| Connected Consumer Appliances |
| Smart Energy and Utility Devices (Meters, Thermostats) |
| Industrial Sensors and Actuators |
| Connected Cameras and Security Devices |
| Micro-mobility Trackers |
| Self-powered Environmental Sensors |
| WPAN (Bluetooth, Zigbee, Z-Wave) |
| WLAN (Wi-Fi 4/5/6/6E/7) |
| LPWAN (NB-IoT, LTE-M, LoRa, Sigfox) |
| Cellular (4G, 5G, C-V2X) |
| Satellite IoT |
| Hybrid Multi-band Modules |
| Battery-powered |
| Energy-harvested |
| Mains-powered |
| North America | United States |
| Canada | |
| Mexico | |
| South America | Brazil |
| Argentina | |
| Rest of South America | |
| Europe | Germany |
| United Kingdom | |
| France | |
| Italy | |
| Rest of Europe | |
| Asia Pacific | China |
| Japan | |
| India | |
| South Korea | |
| Rest of Asia Pacific | |
| Middle East | Saudi Arabia |
| United Arab Emirates | |
| Rest of Middle East | |
| Africa | South Africa |
| Nigeria | |
| Rest of Africa |
| By Application | Connected and Smart Home | |
| Medical IoT | ||
| Connected Car | ||
| Smart Cities | ||
| Industrial IoT | ||
| Personal IoT | ||
| Smart Agriculture | ||
| Other Applications | ||
| By Device Category | Smart Speakers and Displays | |
| Wearables (Watches, Bands, Hearables) | ||
| Connected Consumer Appliances | ||
| Smart Energy and Utility Devices (Meters, Thermostats) | ||
| Industrial Sensors and Actuators | ||
| Connected Cameras and Security Devices | ||
| Micro-mobility Trackers | ||
| Self-powered Environmental Sensors | ||
| By Connectivity Technology | WPAN (Bluetooth, Zigbee, Z-Wave) | |
| WLAN (Wi-Fi 4/5/6/6E/7) | ||
| LPWAN (NB-IoT, LTE-M, LoRa, Sigfox) | ||
| Cellular (4G, 5G, C-V2X) | ||
| Satellite IoT | ||
| Hybrid Multi-band Modules | ||
| By Power Source | Battery-powered | |
| Energy-harvested | ||
| Mains-powered | ||
| By Geography | North America | United States |
| Canada | ||
| Mexico | ||
| South America | Brazil | |
| Argentina | ||
| Rest of South America | ||
| Europe | Germany | |
| United Kingdom | ||
| France | ||
| Italy | ||
| Rest of Europe | ||
| Asia Pacific | China | |
| Japan | ||
| India | ||
| South Korea | ||
| Rest of Asia Pacific | ||
| Middle East | Saudi Arabia | |
| United Arab Emirates | ||
| Rest of Middle East | ||
| Africa | South Africa | |
| Nigeria | ||
| Rest of Africa | ||


Key Questions Answered in the Report
What is the projected value of the IoT devices market by 2031?
The IoT devices market size is expected to increase from USD 230.42 billion in 2025 to USD 273.63 billion in 2026 and reach USD 534.71 billion by 2031, growing at a CAGR of 14.34% over 2026-2031.
Which device category is gaining most from energy-efficiency mandates?
Connected consumer appliances, especially networked refrigerators and thermostats, are forecast to grow at a 14.43% CAGR because new rules require real-time power reporting.
What share did Asia-Pacific hold in 2025?
Asia-Pacific accounted for 41.72% of the IoT devices market share, driven by large smart-city and metering programs.
How are 5G RedCap modules changing connectivity economics?
RedCap chips ship at prices about 30% lower than traditional 5G modules, making cellular viable for mid-bandwidth sensors and retail terminals.
What is the primary cyber-risk facing industrial IoT fleets today?
Fragmented firmware-update mechanisms leave 40% of fielded devices unpatched, raising ransomware exposure and increasing insurance premiums.
When will new mature-node semiconductor fabs ease MCU shortages?
Government-backed fabs will not reach volume production until at least 2028, so supply tightness is expected to persist for several more years.
Page last updated on:


