Consumer IoT Market Size and Share
Market Overview
| Study Period | 2020 - 2031 |
|---|---|
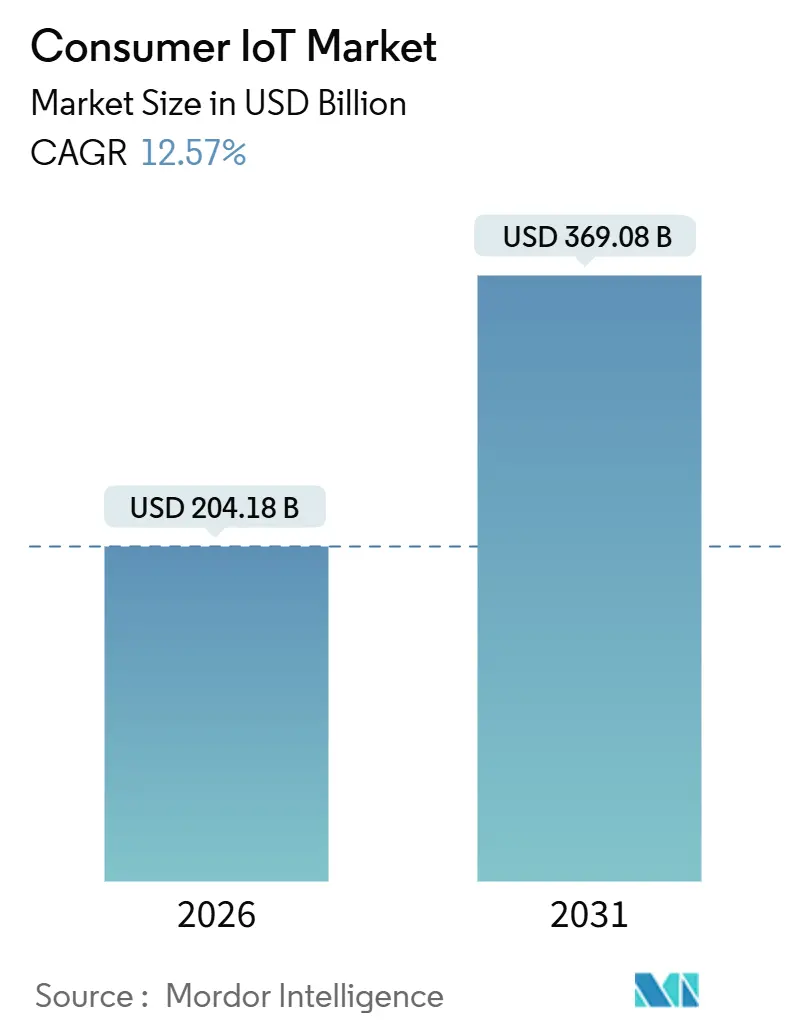
| Market Size (2026) | USD 204.18 Billion |
| Market Size (2031) | USD 369.08 Billion |
| Growth Rate (2026 - 2031) | 12.57% CAGR |
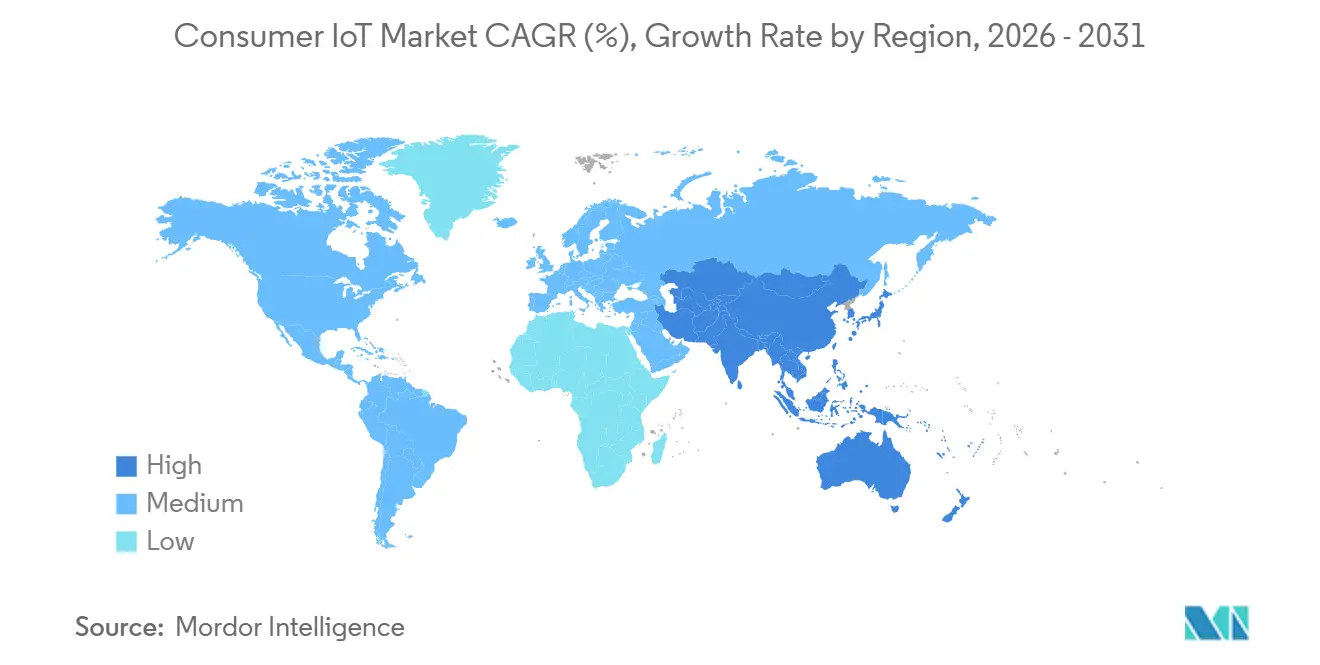
| Fastest Growing Market | Asia Pacific |
| Largest Market | North America |
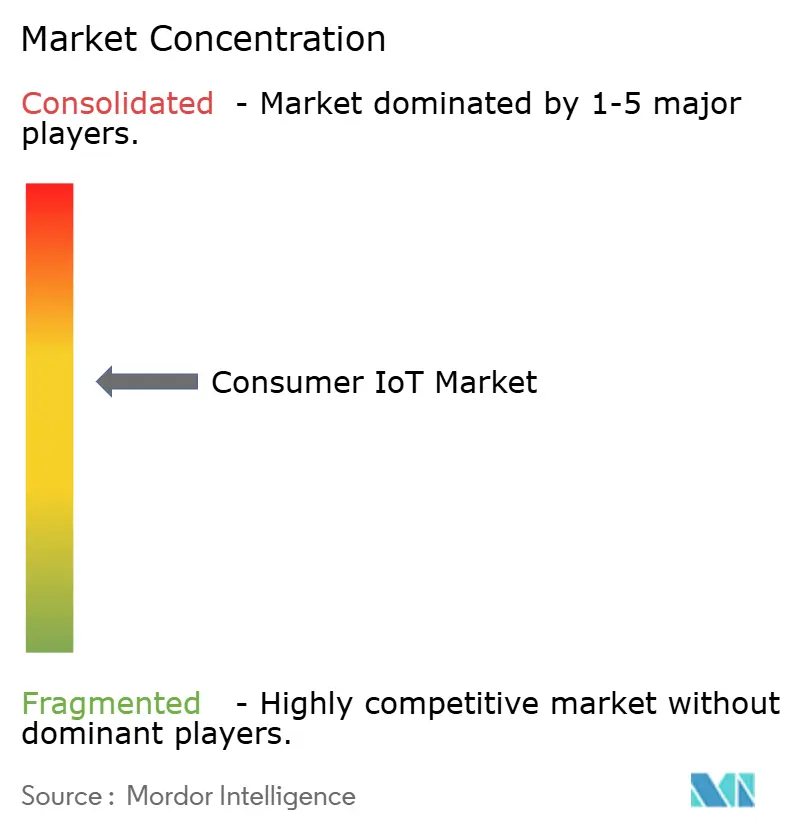
| Market Concentration | Medium |
Major Players
*Disclaimer: Major Players sorted in no particular order Image © Mordor Intelligence. Reuse requires attribution under CC BY 4.0. |
|
Consumer IoT Market Analysis by Mordor Intelligence
The Consumer IoT market stood at USD 204.18 billion in 2026 and is projected to reach USD 369.08 billion by 2031, reflecting a 12.57% CAGR across the period and confirming a strong upward trajectory in both current market size and future value. Growth is fueled by satellite-connectivity integrations that push device coverage beyond terrestrial networks, regulatory pressure for energy efficiency that embeds smart devices into building codes, and the arrival of Matter 1.5 which at last introduces cross-brand camera interoperability. Competitive positioning has shifted toward platform control, with Amazon, Google, Apple and Samsung embedding on-device large-language-model inference that locks users into branded ecosystems. Hardware commoditization, falling sensor prices below USD 0.50, and ISO-based reference architectures have tilted value capture toward software and services, while chip-foundry expansions in Arizona and Texas improve supply resilience. Insurance-linked discounts, 5G and LPWAN rollouts, and energy-price volatility are additional catalysts that expand adoption in homes, wearables, and connected vehicles.
Key Report Takeaways
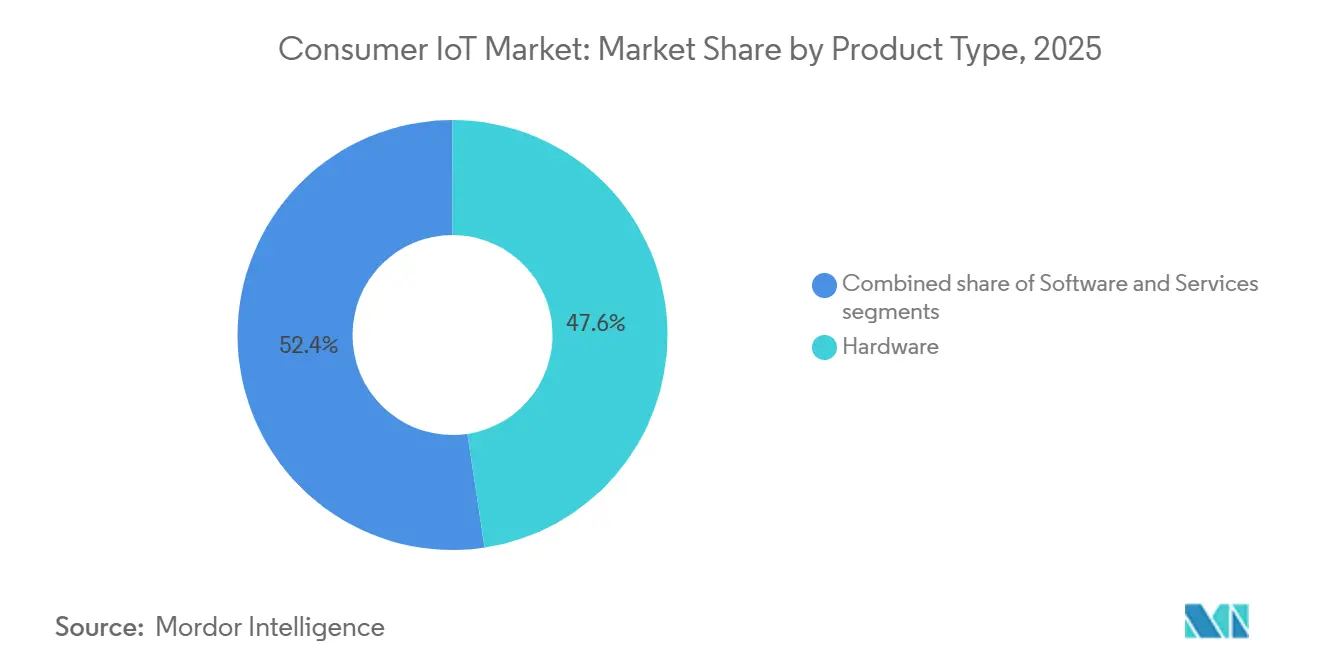
- By product type, Hardware led with 47.62% revenue share in 2025, while Services are advancing at a 13.21% CAGR through 2031.
- By connectivity technology, Wi-Fi commanded 43.44% of deployments in 2025, whereas Ultra-Wideband is forecast to register a 13.62% CAGR through 2031.
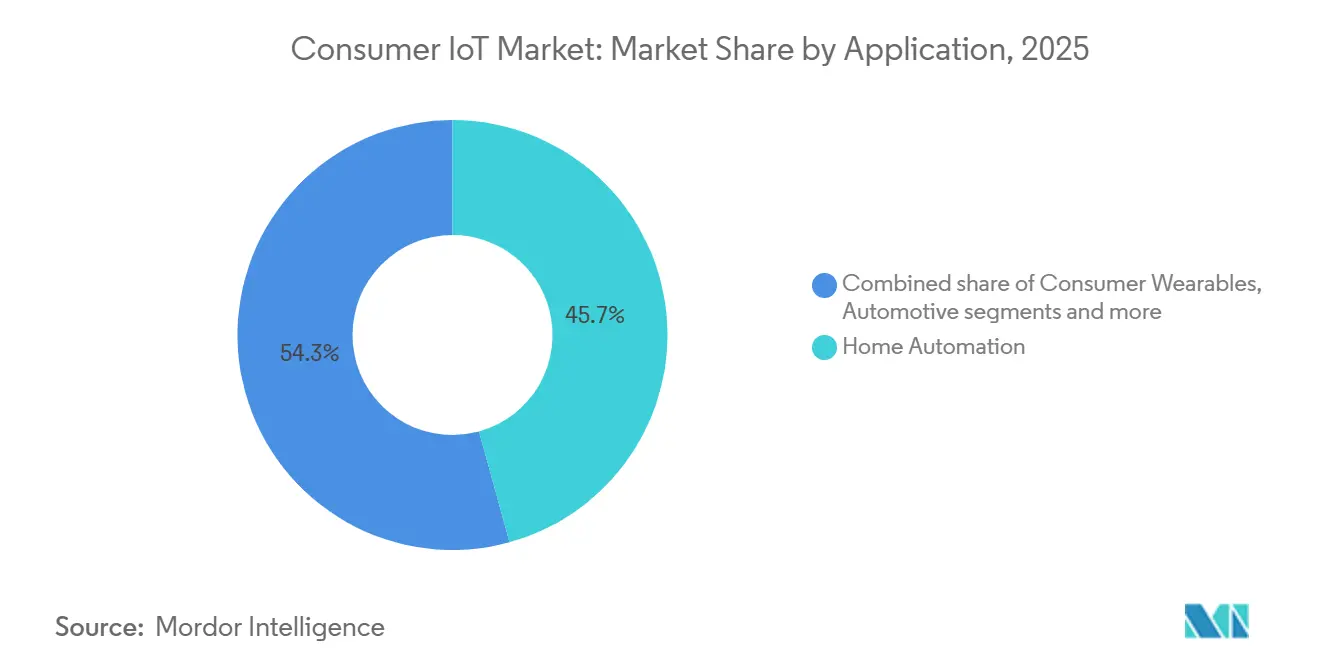
- By application, Home Automation accounted for 45.73% of revenue in 2025, while Healthcare Devices are projected to rise at a 13.93% CAGR through 2031.
- By distribution channel, Online sales captured 56.91% share in 2025 and are poised to increase at a 13.08% CAGR through 2031.
- By geography, North America held 37.89% of global revenue in 2025, while Asia-Pacific is set to expand at a 14.11% CAGR between 2026 and 2031.
Note: Market size and forecast figures in this report are generated using Mordor Intelligence’s proprietary estimation framework, updated with the latest available data and insights as of January 2026.
Global Consumer IoT Market Trends and Insights
Drivers Impact Analysis*
| Driver | (~) % Impact on CAGR Forecast | Geographic Relevance | Impact Timeline |
|---|---|---|---|
| Proliferation of Connected Consumer Devices and Falling Sensor Prices | +2.1% | Global, with APAC core manufacturing hubs | Medium term (2-4 years) |
| Roll-out of 5G and LPWAN Connectivity | +2.4% | North America, Europe, APAC urban centers | Short term (≤ 2 years) |
| Rapid Smart-Home Ecosystem Adoption | +2.3% | North America and EU lead, APAC catching up | Medium term (2-4 years) |
| AI-Driven Voice-Assistant Integration | +1.8% | Global, concentrated in English and Mandarin markets | Short term (≤ 2 years) |
| Insurance-Linked Incentives for Risk-Mitigating IoT Devices | +1.2% | North America, emerging in EU | Long term (≥ 4 years) |
| Energy-Price-Driven Demand for Smart Home Energy Management | +1.9% | EU regulatory push, North America incentive-driven | Medium term (2-4 years) |
| Source: Mordor Intelligence | |||
Connected Device Proliferation and Falling Sensor Prices
The number of Thread-certified products exceeded 1,100 by late 2025, pushing unit costs for motion, temperature, and humidity sensors below USD 0.50, which supports sub-USD 20 retail prices for basic smart plugs and door sensors. Foundry ramps by TSMC, Intel and Samsung in Arizona and Texas collectively added more than 1 million wafer starts per year, stabilizing microcontroller lead times and widening supply access. Bosch Sensortec’s BHI360 and BHI380 sensor hubs integrate on-chip machine learning that reduces external processor load and lengthens battery life in wearables and nodes. These cost efficiencies, coupled with ISO/IEC 30141 reference architectures, reduce engineering overhead and reposition differentiation toward software-based services.
Roll-out of 5G and LPWAN Connectivity
GSMA counted 1.6 billion 5G connections globally by early 2024, while Ericsson projected 60% population coverage by the end of 2025, delivering sub-10 millisecond latency necessary for real-time health monitoring and immersive applications.[1]GSMA, "5G Connection and Statistics," gsma.comSkylo partnerships with Qualcomm, Samsung, Google, and Garmin embed satellite messaging into premium smartphones and wearables, closing terrestrial gaps and supporting emergency communication. Orange Europe added satellite SMS services in November 2025 for maritime and alpine regions.[2]Orange, “Satellite SMS Services Launch,” orange.com Semtech’s HL78 LoRa Edge module combines LPWAN with GNSS positioning to extend battery life beyond five years in asset trackers.[3]Semtech, “HL78 LoRa Edge Module Release,” semtech.com Thread 1.4 introduced sleepy end devices that cut energy draw by up to 40% compared with always-on Wi-Fi, benefiting rural and low-power deployments.
Rapid Smart-Home Ecosystem Adoption
Eurostat data showed that 71% of European internet users operated connected devices in 2024, and 63% used at least one smart-home product, surpassing 59% a decade earlier. Samsung became the first to support Matter 1.5 cameras in December 2025, enabling encrypted video across Apple, Google and Amazon ecosystems. Despite this, a Japanese survey revealed ownership rates of only 4.7% for robot vacuums and 1.2% for smart locks, with 41% of respondents citing no perceived need, underscoring cultural and regulatory factors that shape adoption. Berg Insight estimated 4.5 million home-energy-management systems in place by end-2024 and forecast a 22.3% CAGR to 12.3 million by 2029, driven by the EU Energy Performance of Buildings Directive. GDPR and local data-residency rules continue to influence vendor roadmaps and consumer confidence.
AI-Driven Voice-Assistant Integration
Amazon unveiled Alexa+ in September 2025, integrating generative-AI responses and proactive suggestions, while Google introduced Gemini for Home in October 2025, embedding large-language-model inference directly into Nest devices. Samsung partnered with Google to equip the Ballie companion robot with similar AI capabilities, eliminating wake-word friction and driving natural-language control. A Verizon survey found that 68% of U.S. smart-home owners issued voice commands daily in October 2025, eclipsing mobile-app usage for primary control. The forthcoming EU AI Act classifies certain voice-assistant functions as high-risk, compelling transparency and compliance that favor large incumbents with established legal resources.
Restraints Impact Analysis*
| Restraint | (~) % Impact on CAGR Forecast | Geographic Relevance | Impact Timeline |
|---|---|---|---|
| Data-Privacy and Cyber-Security Concerns | -1.6% | EU enforcement lead, global spillover | Short term (≤ 2 years) |
| Inter-operability Fragmentation Despite Matter Roll-out | -1.3% | Global, acute in APAC and emerging markets | Medium term (2-4 years) |
| Chip-Supply Volatility and Pricing Pressure | -0.9% | Global, with APAC manufacturing dependencies | Short term (≤ 2 years) |
| E-Waste, Right-to-Repair and Eco-Design Regulation Impact | -0.7% | EU regulatory core, spreading to North America | Long term (≥ 4 years) |
| Source: Mordor Intelligence | |||
Data-Privacy and Cyber-Security Concerns
The European Data Protection Board has imposed EUR 4.5 billion (USD 5.1 billion) in GDPR fines since 2018, including Meta’s EUR 1.2 billion (USD 1.36 billion) penalty in May 2023, prompting IoT vendors to localize data storage and refine permission frameworks. Eurostat recorded 7% of EU citizens citing security fears as a barrier to adoption in 2024, rising to 12% in lower-income households. The FDA’s TEMPO pilot, launched December 2025, obligates medical-device applicants to submit cybersecurity threat models and software bills of materials. Smaller vendors face disproportionate compliance costs, accelerating consolidation around platform operators that can absorb legal overhead.
Interoperability Fragmentation Despite Matter Roll-out
Although the Connectivity Standards Alliance had certified more than 1,100 Matter products by late 2025, Samsung’s claim of first-to-market support for Matter 1.5 cameras exposed multi-year gaps in the standard. Proprietary UWB implementations by Apple and Samsung remain partially siloed, limiting cross-brand digital-key use. Legacy Zigbee and Z-Wave installations demand costly bridge devices, adding latency and failure points. Fragmentation deters cost-sensitive buyers in Asia-Pacific and emerging markets, where local brands such as Xiaomi and Huawei maintain their own ecosystems. Policy incentives that subsidize installers or certify device interoperability are still nascent, prolonging consumer hesitation.
*Our forecasts treat driver/restraint impacts as directional, not additive. The impact forecasts reflect baseline growth, mix effects, and variable interactions.
Segment Analysis
By Product Type: Services Monetize the Installed Hardware Base
Services are expanding at a 13.21% CAGR from 2026 to 2031 as vendors pivot from one-time hardware sales to subscription bundles that include firmware updates, predictive maintenance, and usage analytics. The Consumer IoT market size for Services is rising faster than hardware even though Hardware maintained 47.62% Consumer IoT market share in 2025, indicating that recurring revenue is eclipsing upfront margin compression. Amazon’s premium Alexa+ tier and Google’s Gemini-based cloud storage for Nest cameras illustrate how platforms convert hardware owners into long-lived subscribers. EU energy-efficiency mandates drive dashboard software that aggregates consumption data and triggers automated load shedding, as seen in Schneider Electric’s Wiser Energy platform.
Hardware shipment volumes remain critical because device proliferation anchors any attach rate for services. Cost reductions from Bosch Sensortec’s integrated sensor hubs and wafer-capacity additions by U.S. foundries have kept entry-level prices low, yet commoditization squeezes margins. ISO/IEC 30141 accelerates reference-architecture alignment, lowering integration costs and channeling profit pools toward analytics, cloud hosting, and AI features that software and service providers supply.


By Connectivity Technology: Ultra-Wideband Challenges Wi-Fi Dominance
Wi-Fi accounted for 43.44% of deployments in 2025 due to legacy router bases and multi-gigabit upgrades to Wi-Fi 7. However, Ultra-Wideband is projected to post a 13.62% CAGR to 2031, scaling upward from automotive key fobs to smartphones that offer centimeter-level positioning. The Consumer IoT market size for UWB-enabled devices is accelerating particularly in digital-key, asset-tracking, and spatial-audio scenarios, and gains are eroding the once unassailable presence of Wi-Fi in indoor navigation. FCC Part 15 and ETSI compliance requirements set emission limits that vendors must address early in product design, but global members of the FiRa Consortium are pooling reference designs that lower certification hurdles.
Bluetooth and BLE sustain huge unit volumes in wearables and headphones, though always-on power draw constrains battery-sensitive endpoints. Low-power mesh standards such as Thread benefit sensors and door contacts, especially since Thread 1.4 introduced sleepy end devices that extend battery life markedly. Cellular NB-IoT and LTE-M serve mobility use cases, while Skylo’s satellite overlay pushes messaging beyond terrestrial coverage, expanding adoption in remote security devices and adventure wearables.
By Application: Healthcare Devices Outpace Consumer Electronics
Home Automation held 45.73% revenue in 2025, underlining thermostats, lighting, and security cameras as mature categories. Healthcare Devices are forecast to achieve a 13.93% CAGR through 2031, and this growth elevates their contribution to the overall Consumer IoT market size as FDA clearances pour in. Continuous glucose monitors from Dexcom, cuffless blood-pressure sensors from Aktiia, and ECG features from Whoop demonstrate an evolving pipeline in regulated wearables. The Consumer IoT market share for Healthcare Devices therefore widens as payers reimburse clinically validated gadgets, reinforcing adoption beyond fitness enthusiasts.
Consumer Wearables join the healthcare arc by adding satellite messaging for wilderness safety, while Consumer Electronics evolves through generative-AI embedded appliances such as Samsung’s Bespoke AI line. Automotive connectivity also rises, with Mercedes-Benz, BMW and Stellantis developing in-house operating systems that support over-the-air updates and third-party apps. Niche categories like pet trackers adopt UWB for precise geofencing, showing that even small segments follow the broader shift toward high-accuracy positioning.
By Distribution Channel: Direct-to-Consumer Models Dominate Online
Online channels captured 56.91% of revenue in 2025 and are tracking a 13.08% CAGR through 2031 as consumers value direct-to-consumer bundles that include firmware provisioning and subscription add-ons. E-commerce penetration, measured at 16.4% of U.S. retail sales in Q3 2025, underpins this shift as electronics and appliances top growth leaderboards. Detailed product reviews, installation videos, and one-click ecosystem bundling lower the perceived complexity of the Consumer IoT market, facilitating broader reach.
Brick-and-mortar stores still serve demonstrations and immediate fulfillment, yet margin compression pushes retailers to blend online ordering with in-store pickup. Samsung’s dual strategy for Bespoke AI appliances exemplifies omnichannel balancing. Regulatory obligations such as the EU Digital Services Act heighten compliance costs for smaller online marketplaces, consolidating volume with platforms that can maintain transparent return policies and data-privacy disclosures.
Geography Analysis
North America contributed 37.89% of global revenue in 2025, supported by insurance discounts that reach 15% for smart-home installations and by federal tax credits for smart thermostats under the U.S. Inflation Reduction Act. State mandates such as California’s Title 24 require load-management controls in new homes, further embedding intelligent devices. Canadian utilities mirror these incentives through rebates and time-of-use tariffs, while Mexico’s nearshoring boom and cross-border e-commerce invite mid-income households into the Consumer IoT market.
Asia-Pacific is projected to expand at a 14.11% CAGR to 2031, the fastest regional pace. Xiaomi shipped more than 100 million smart-home devices in 2024, using aggressive pricing to lower entry barriers in China. India’s Digital India program subsidizes broadband and nurtures local assembly lines, delivering wider access to connected devices. South Korea’s 5G coverage surpasses 95%, fostering rapid uptake of AI-enhanced appliances from domestic champions Samsung and LG. Japan exhibits high awareness but low ownership, with interoperability and perceived value hindering rollouts despite the spread of Matter certification.
Europe’s trajectory ties directly to the Energy Efficiency Directive 2023/1791, which mandates an 11.7% consumption reduction by 2030 and effectively requires smart meters in all new buildings. Right-to-Repair legislation adopted in 2024 extends device lifespans, encouraging software-update revenue more than replacement hardware sales. Nordic countries benefit from near-universal broadband and eco-conscious consumers, whereas Italy and Spain accelerate meter deployment through national energy plans. GDPR and forthcoming AI regulation sustain compliance demands that favor incumbents.
South America remains nascent but benefits from expanding urban middle classes in Brazil and Argentina. Middle East and Africa rely on sovereign smart-city megaprojects; the UAE allocated AED 11 billion (USD 3 billion) for 1,000 technology installations by 2031, including 600,000 smart meters already active in Abu Dhabi and Dubai. Saudi Arabia’s Vision 2030 and South Africa’s grid-modernization initiatives also spur localized demand. World Bank data shows Gulf Cooperation Council members enjoy more than 90% 5G coverage and mobile broadband speeds above 100 Mbps, underpinning future adoption.

Competitive Landscape
Market power clusters around ecosystem owners Apple, Amazon, Google, Samsung and Microsoft, whose proprietary assistants, app stores, and cloud services generate high switching costs. Amazon’s Alexa+ and Google’s Gemini for Home embed generative-AI features that harvest usage data while driving subscription revenue. Samsung’s Ballie robot links hardware with cloud intelligence to sustain user engagement. Matter certification surpassed 1,100 products by late 2025, but gaps surrounding cameras and energy devices allow first movers to extract interoperability premiums.
Satellite connectivity is an emerging white space. Skylo’s partnerships with Qualcomm, Samsung, Google and Garmin bring non-terrestrial messaging to mainstream devices, expanding the Consumer IoT market into remote, maritime and disaster-preparedness zones. Healthcare wearables carry regulatory hurdles yet promise high margins; FDA clearances in 2025 validate paths for smaller entrants. Xiaomi and Huawei pursue vertical integration in Asia, bundling routers, smartphones and appliances within closed ecosystems that circumvent Western cloud dependencies.
Technology differentiation is shifting to on-device AI and energy efficiency. Bosch Sensortec’s sensor hubs offload computation from higher-power processors, while Schneider Electric’s Wiser platform optimizes solar self-consumption at the circuit level. The upcoming EU AI Act will boost compliance budgets and likely consolidate share among incumbents. Patent filings in Ultra-Wideband positioning and satellite protocols underscore long-term bets on secure digital keys and ultra-precise indoor navigation.
Consumer IoT Industry Leaders
-
Apple Inc.
-
Amazon.com Inc.
-
Samsung Electronics Co. Ltd.
-
Alphabet Inc. (Google)
-
Huawei Technologies Co. Ltd.
- *Disclaimer: Major Players sorted in no particular order

Recent Industry Developments
- December 2025: Samsung SmartThings became the first platform to support Matter 1.5 cameras, enabling encrypted cross-brand video streams.
- December 2025: The U.S. FDA launched the TEMPO pilot program, requiring cybersecurity threat models and software bills of materials for medical-device clearance.
- October 2025: Amazon launched Alexa+ with generative-AI responses and a premium subscription tier.
- September 2025: Apple introduced Watch SE 3, Series 11 and Ultra 3 with two-way satellite messaging via Skylo.


Research Methodology Framework and Report Scope
Market Definitions and Key Coverage
Our study defines the consumer IoT market as the aggregate annual sales value of connected hardware, embedded software, and associated consumer-facing services that help individuals monitor, automate, or enhance day-to-day activities in homes, vehicles, wearables, and personal health settings. Devices must connect to the public internet directly or through a gateway and be purchased, owned, or subscribed to by private users; gray-market shipments are omitted.
Scope Exclusions: Enterprise and industrial IoT platforms, M2M modules sold through B2B channels, and revenue from pure data monetization plays are not covered.
Segmentation Overview
-
By Product Type
- Hardware
- Software
- Services
-
By Connectivity Technology
- Wi-Fi
- Bluetooth / BLE
- Zigbee / Z-Wave / Thread
- Cellular
- Ultra-Wideband (UWB)
-
By Application
- Home Automation
- Consumer Wearables
- Consumer Electronics
- Healthcare Devices
- Automotive
- Other Applications
-
By Distribution Channel
- Online
- Offline
-
By Geography
-
North America
- United States
- Canada
- Mexico
-
South America
- Brazil
- Argentina
- Rest of South America
-
Europe
- Germany
- United Kingdom
- France
- Italy
- Spain
- Rest of Europe
-
Asia-Pacific
- China
- Japan
- India
- South Korea
- Australia and New Zealand
- Rest of Asia-Pacific
-
Middle East and Africa
-
Middle East
- Saudi Arabia
- United Arab Emirates
- Turkey
- Rest of Middle East
-
Africa
- South Africa
- Egypt
- Nigeria
- Rest of Africa
-
Middle East
-
North America
Detailed Research Methodology and Data Validation
Primary Research
Mordor analysts interviewed chipset vendors, smart-home hub OEMs, regional telecom operators, and large electronics retailers across North America, Europe, and Asia-Pacific. These discussions clarified real-world sell-through ratios, ASP shifts post-Matter rollouts, and household penetration plateaus that raw shipment data cannot reveal.
Desk Research
We began by gathering baseline signals from government trade statistics (UN Comtrade, U.S. Census IoT tariff lines), telecom regulator device certification databases, and trade groups such as the Bluetooth SIG and Wi-Fi Alliance, which publish chipset and module shipment trends. Academic journals, including IEEE IoT and Sensors, supplied failure rate and lifecycle clues, while filings to the SEC and the European ESMA database helped us parse segment revenue for listed device makers. Premium inputs were pulled from D&B Hoovers for company financial splits and Dow Jones Factiva for deal flow. This list is illustrative; many other open and paid sources fed the desk phase.
Market-Sizing & Forecasting
We apply a top-down and bottom-up hybrid. National household counts, smartphone penetration, and average connected device ownership per household recreate a demand pool, which is then benchmarked against customs import volumes and selected supplier roll-ups to validate totals. Key variables, including 5G/Wi-Fi 6 rollout rates, median sensor ASP erosion, disposable income growth, data privacy index scores, and connected health adoption, feed a multivariate regression forecast. Gaps where retailer scans are sparse are bridged by region-specific device failure replacement cycles derived from warranty data.
Data Validation & Update Cycle
Outputs pass a three-layer review: automated variance checks against historical series, peer analyst audits, and final lead analyst sign-off. We refresh every twelve months and trigger an interim update when regulatory shifts or component shortages move the market materially.
Why Our Consumer IoT Baseline Commands Reliability
Published estimates often diverge because firms slice the market differently and refresh at unequal cadences.
Key gap drivers include: some studies fold enterprise devices into 'consumer' tallies, others embed service revenue or adopt aggressive price deflation curves, and a few rely purely on technology spend allocations without primary validation, whereas Mordor anchors on verified unit flows and current ASPs.
Benchmark comparison
| Market Size | Anonymized source | Primary gap driver |
|---|---|---|
| USD 181.38 B (2025) | Mordor Intelligence | |
| USD 240.94 B (2023) | Global Consultancy A | Combines prosumer and enterprise endpoints; two-year older baseline; limited primary checks |
| USD 272.07 B (2023) | Industry Research Provider B | Adds installation services and overlaps industrial IoT; uses macro tech spend ratios |
| USD 73.44 B (2024) | Regional Consultancy C | Narrow focus on hardware only; excludes cloud subscriptions and aftermarket services |
In sum, by aligning scope strictly with consumer-owned connected devices, validating inputs through sector specialists, and updating models annually, Mordor delivers a balanced, transparent baseline that decision-makers can trace back to clear variables and repeatable steps.


Key Questions Answered in the Report
What is the projected value of the Consumer IoT market in 2031?
It is expected to reach USD 369.08 billion, representing a 12.57% CAGR during 2026-2031.
Which region is forecast to grow the fastest through 2031?
Asia-Pacific, supported by China’s Xiaomi ecosystem and India’s Digital India program, is projected to expand at a 14.11% CAGR.
Which connectivity technology is gaining ground on Wi-Fi?
Ultra-Wideband is set for a 13.62% CAGR, fueled by smartphone integrations that enable centimeter-level positioning.
Why are Services becoming more important than Hardware?
Falling sensor costs commoditize devices, so vendors shift to subscription models that monetize firmware updates and analytics, driving Services at a 13.21% CAGR.
How do data-privacy regulations impact Consumer IoT growth?
GDPR and similar frameworks add compliance costs that slow smaller vendors and concentrate market share among large platforms with robust legal resources.
Page last updated on:


