
GPU Interposer Market Size and Share
Market Overview
| Study Period | 2020 - 2031 |
|---|---|
| Market Size (2026) | USD 2.57 Billion |
| Market Size (2031) | USD 9.41 Billion |
| Growth Rate (2026 - 2031) | 29.64 % |
| Fastest Growing Market | Asia-Pacific |
| Largest Market | North America |
| Market Concentration | High |
Major Players *Disclaimer: Major Players sorted in no particular order Image © Mordor Intelligence. Reuse requires attribution under CC BY 4.0. | |
GPU Interposer Market Analysis by Mordor Intelligence
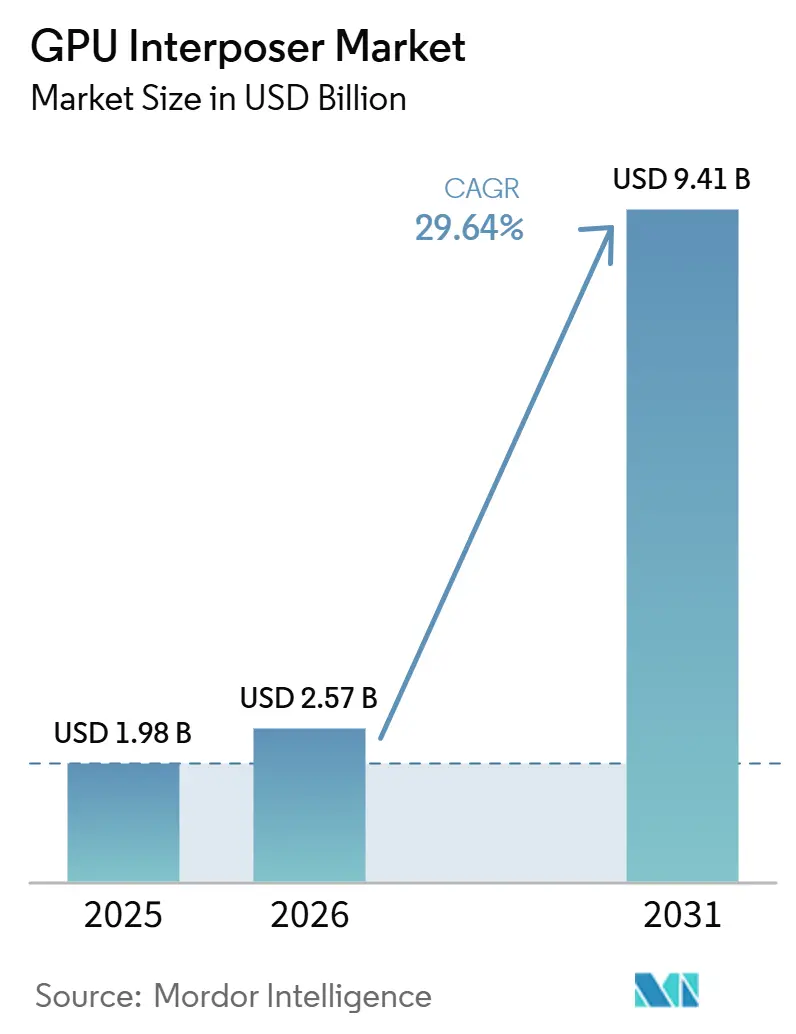
The GPU interposer market size is expected to increase from USD 1.98 billion in 2025 to USD 2.57 billion in 2026 and reach USD 9.41 billion by 2031, growing at a CAGR of 29.64% over 2026-2031. The GPU interposer market is expanding because advanced accelerator packages now depend on dense die-to-die routing, high bandwidth memory integration, and larger package footprints that conventional approaches cannot support at the same level. The delay in next-generation glass-substrate commercialization keeps silicon interposer platforms in a stronger position for longer, which extends investment visibility across the current packaging stack. Capacity expansion remains active across foundries, substrate suppliers, and outsourced assembly providers, yet utilization stays tight because large AI deployments are moving faster than packaging line additions. Competitive activity in the GPU interposer market is centered on securing substrate supply, adding advanced packaging lines, and offering lower-cost alternatives such as RDL-based and bridge-based designs. Opportunity in the GPU interposer market is widening beyond flagship training systems as inference hardware, sovereign compute programs, and heterogeneous chiplet designs create a broader set of package requirements.
Key Report Takeaways
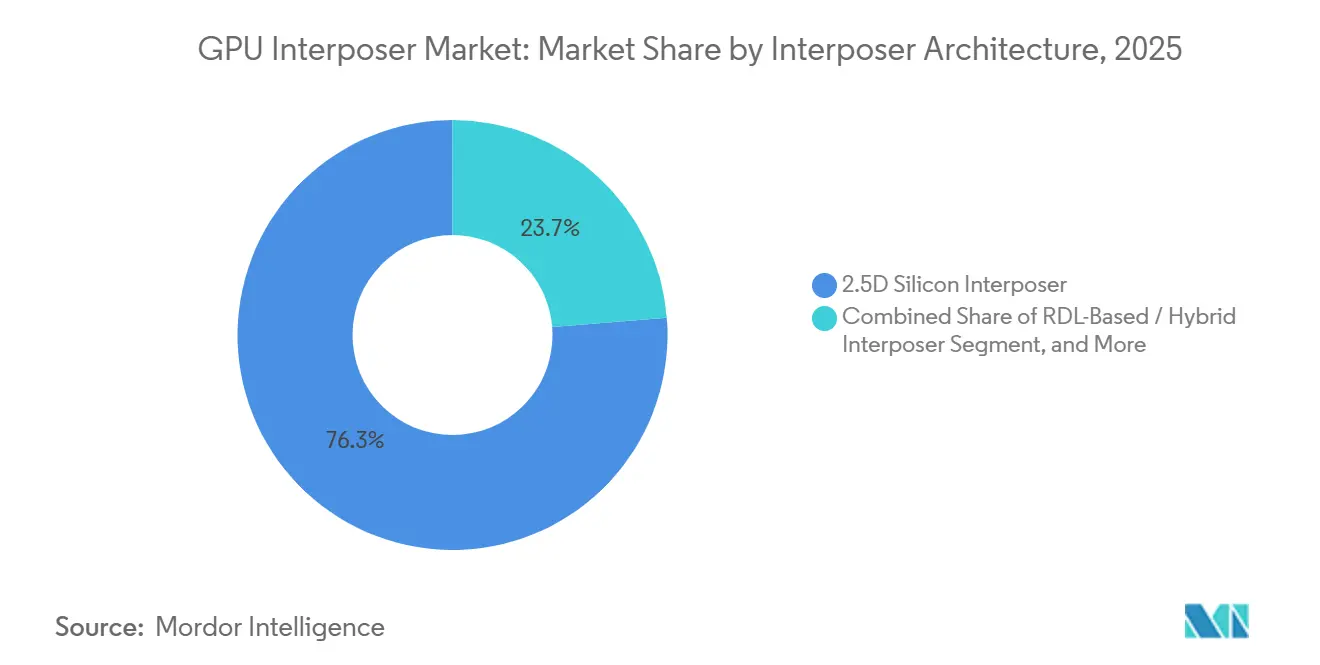
- By interposer architecture, 2.5D silicon interposer led with a 76.28% revenue share of the GPU interposer market in 2025, while RDL-based and hybrid interposer is projected to expand at a 29.99% CAGR through 2031.
- By application, AI training accelerators accounted for 75.79% of revenue of the GPU interposer market in 2025, while AI inference accelerators are projected to record the fastest CAGR at 30.14% through 2031.
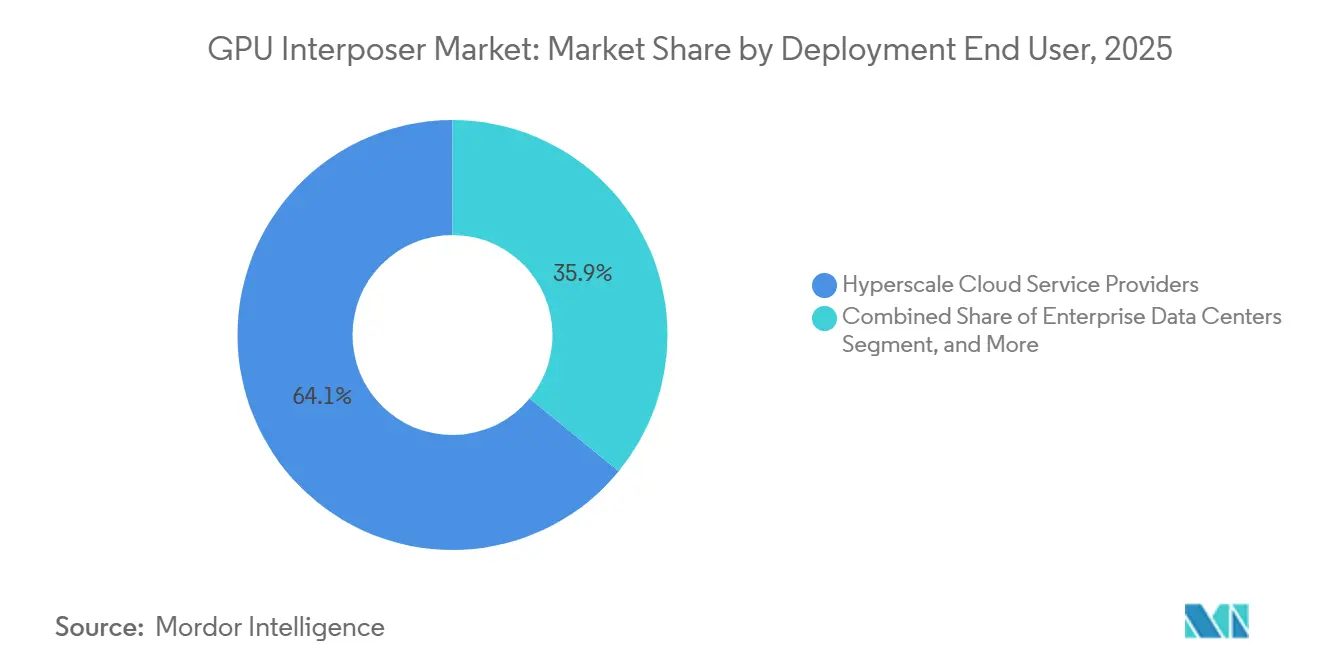
- By deployment end user, hyperscale cloud service providers held 64.07% of revenue in 2025, while GPU cloud, colocation, and managed-service providers are projected to advance at a 30.42% CAGR through 2031.
- By geography, North America represented 56.71% of the GPU interposer market in 2025, while Asia-Pacific is projected to post the fastest regional CAGR at 30.56% through 2031.
Note: Market size and forecast figures in this report are generated using Mordor Intelligence’s proprietary estimation framework, updated with the latest available data and insights as of January 2026.
Market Trends and Insights
Drivers Impact Analysis of GPU Interposer Market*
| Driver | (~) % Impact on CAGR Forecast | Geographic Relevance | Impact Timeline |
|---|---|---|---|
| Rapid Proliferation Of Generative AI GPU Clusters | +8.5% | Global, with North America and Asia-Pacific as primary demand centers | Short term (≤ 2 years) |
| Escalating HBM Stack Counts Per GPU Package | +7.2% | Global, concentrated in Taiwan and South Korea supply chain | Short term (≤ 2 years) |
| Transition Toward Chiplet-Based GPU Architectures | +5.8% | Global, with R&D centers in North America and fab execution in Taiwan and South Korea | Medium term (2-4 years) |
| Sovereign AI Build-Outs And Local Packaging Localization | +3.9% | North America, Europe, South and Southeast Asia, Middle East | Medium term (2-4 years) |
| Co-Packaged Memory Roadmaps Requiring Fine-Pitch Interconnects | +2.7% | Global, with Taiwan as the primary execution node | Long term (≥ 4 years) |
| Design Rule Convergence Around Open Die-To-Die Standards | +1.8% | Global, with early gains in North America and East Asia chiplet ecosystems | Long term (≥ 4 years) |
| Source: Mordor Intelligence | |||
Rapid Proliferation Of Generative AI GPU Clusters
The GPU interposer market is moving in line with the build-out of generative AI clusters because each advanced accelerator package needs a dense interposer layer to connect compute dies and memory stacks. NVIDIA’s Vera Rubin platform was introduced as a rack-scale system built around tightly integrated GPU packages, which keeps demand focused on advanced package formats rather than simpler assemblies. AMD also positioned its next AI system roadmap around large accelerator deployments, which supports the same packaging direction in the GPU interposer market.[1]AMD, “AMD Instinct MI350 Series and Beyond, Accelerating the Future of AI and HPC,” AMD, amd.com TSMC stated in April 2026 that CoWoS capacity is fully utilized through 2027, which shows that package demand is staying ahead of near-term supply even as new lines are added.[2]TSMC, “Q1 2026 Earnings Conference Call Transcript,” TSMC Investor Relations, investor.tsmc.com This matters because the GPU interposer market is now shaped by system-level procurement, not just by individual chip launches. Once a cluster order is placed, the packaging requirement follows directly, and that keeps utilization high across the current cycle.
Escalating HBM Stack Counts Per GPU Package
Higher HBM content is raising the physical demands placed on each package in the GPU interposer market. NVIDIA disclosed that Vera Rubin uses 8 HBM4 stacks, 288 GB of memory, and 22 TB/s of aggregate bandwidth, which points to a larger and more demanding interposer footprint than earlier designs. AMD stated that its Instinct MI455X adopts 12 HBM4 stacks, 432 GB of memory capacity, and 19.6 TB/s of bandwidth, which increases routing density and package complexity further. In practical terms, more memory stacks require more interposer area, more wiring layers, and tighter assembly control. Samsung’s March 2026 collaboration update with AMD also showed how memory suppliers are now more closely tied to the package roadmap, which reinforces the interdependence between HBM and the GPU interposer market.[3]Samsung Electronics, “Samsung and AMD Expand Strategic Collaboration on Next-Generation AI Memory Solutions,” Samsung Newsroom Canada, news.samsung.com As HBM roadmaps advance, package design becomes a larger part of product differentiation, which keeps advanced interposer demand elevated.
Transition Toward Chiplet-Based GPU Architectures
The move toward chiplet-based designs is widening the long-term scope of the GPU interposer market. The UCIe Consortium released the 3.0 specification in August 2025 with support for 48 GT/s and 64 GT/s data rates and longer sideband reach, which makes more complex multi-die package layouts practical across vendors. NVIDIA’s Rubin platform pairs compute and I/O functions across separate elements, which aligns with the broader direction toward modular package design. A 2026 IEEE Journal of Solid-State Circuits paper also demonstrated a UCIe advanced package link on a 2.5-D CoWoS interposer with 0.29 pJ/bit efficiency and 5.27 Tb/s/mm bandwidth density, which confirms that high-density die-to-die communication is already commercially relevant at the package level. The GPU interposer market, therefore, benefits from a broader design shift because heterogeneous integration is no longer limited to a single GPU vendor’s packaging flow. As open die-to-die standards mature, more package programs can move into interposer-based formats with less interface risk.
Sovereign AI Build-Outs And Local Packaging Localization
Government-backed compute programs are adding a localization layer to the GPU interposer market. Canada opened applications in 2025 for its AI Compute Access Fund under a broader national compute push, which links public support to domestic AI infrastructure development. In the United States, Executive Order 14179 in January 2025 directed agencies to support AI infrastructure siting and permitting, which strengthens the domestic pipeline for advanced packaged accelerator demand. This changes the way the GPU interposer market develops because supply chain location starts to matter alongside performance and cost. Packaging may still be concentrated in Asia, but buyers with sovereignty requirements are pushing for more local assembly, qualification, and substrate traceability. The result is a steadier case for regional OSAT and packaging investment even when front-end wafer fabrication remains globally concentrated.
Restraints Impact Analysis of GPU Interposer Market*
| Restraint | (~) % Impact on CAGR Forecast | Geographic Relevance | Impact Timeline |
|---|---|---|---|
| Limited Foundry Capacity For Large-Area Interposers | -1.8% | Global, most acute in Taiwan, with expansion in the United States and ASEAN | Short term (≤ 2 years) |
| High Build-Up Substrate Costs Offsetting Interposer Gains | -1.4% | Global, with upstream materials concentrated in Japan and Taiwan | Medium term (2-4 years) |
| Thermal And Warpage Limits In Dense Multi-Die Packages | -0.9% | Global, most visible at advanced packaging lines in Taiwan and South Korea | Medium term (2-4 years) |
| Qualification Risk In Cross-Vendor Chiplet Ecosystems | -0.6% | Global, particularly in Europe and North America chiplet consortium programs | Long term (≥ 4 years) |
| Source: Mordor Intelligence | |||
Limited Foundry Capacity For Large-Area Interposers
Capacity remains the clearest near-term constraint on the GPU interposer market. TSMC confirmed in April 2026 that CoWoS lines are fully utilized through 2027, which means demand is still ahead of qualified supply despite ongoing expansion. The same update also showed that CoPoS is still in pilot mode and commercial production remains a couple of years away, which delays a major alternative path for larger and denser package formats. This keeps silicon interposer lines under pressure because new GPU generations continue to rely on currently available package methods. The GPU interposer market, therefore, faces a timing mismatch, where line additions are real but qualification and volume ramp take longer than customer demand expects. That mismatch limits how quickly second-tier chip designers can secure advanced packaging slots, even when end demand is present.
High Build-Up Substrate Costs Offsetting Interposer Gains
Substrate cost inflation is another meaningful brake on the GPU interposer market. Unimicron said in 2026 that it was lifting capital expenditure to NTD 34 billion (USD 1.13 billion), with nearly 70% directed to ABF capacity expansion and process upgrades, which reflects ongoing tightness in critical substrate inputs. Ibiden also approved a JPY 500 billion investment plan in February 2026 for high-performance IC package substrates, with new production scheduled from fiscal 2027 onward, which shows how capital-intensive relief remains. When substrate supply stays tight, package costs remain high even if interposer demand is strong. That cost burden matters most for buyers without top-tier pricing power, because premium package formats become harder to justify across a wider product portfolio. The GPU interposer market can therefore grow quickly while still facing adoption resistance in cost-sensitive design programs.
*Our forecasts treat driver/restraint impacts as directional, not additive. The impact forecasts reflect baseline growth, mix effects, and variable interactions.
GPU Interposer Market Segment Analysis
By Interposer Architecture:
Silicon Retains Scale While Alternatives Gain RelevanceThe 2.5D silicon interposer segment held 76.28% of revenue in 2025, which kept it in the lead across the GPU interposer market. That position reflects strong alignment with current high-volume accelerator packages, where fine routing pitch, dimensional stability, and process maturity remain hard to match at scale. The 2.5D silicon interposer segment also represented the largest share of GPU interposer market size in 2025 because it remained the default choice for flagship GPU programs. Silicon’s process compatibility matters because high-density redistribution layers need consistent tolerances, especially when large compute dies are paired with multiple HBM stacks. The GPU interposer market continues to rely on this architecture because today’s leading package lines are already optimized around it.
TSMC’s April 2026 update showed that CoWoS remains fully utilized through 2027, which reinforces the installed-base strength behind silicon interposer use. At the same time, the GPU interposer industry is not standing still because RDL-based and hybrid interposer formats are projected to grow at 29.99% through 2031. Intel promoted EMIB-T as a route toward larger package support on an organic substrate base, which gives customers a cost and scale alternative where full silicon interposer performance is not essential. Samsung also outlined a 3.3D packaging direction that uses an RDL interposer and stacked logic, which shows that major suppliers want to reduce dependence on pure silicon-based approaches. The GPU interposer industry therefore remains led by silicon today, but future gains are likely to be shaped by designs that lower cost, increase package area, or improve scalability across broader accelerator portfolios.



By Application:
Training Leads Revenue While Inference Accelerates FasterAI training accelerators accounted for 75.79% of application revenue in 2025, which made them the core demand base in the GPU interposer market. Training systems remain the largest packaging consumer because they require dense interposer layouts, large package areas, and multiple HBM stacks to support high-throughput model development. This segment also captured the biggest share of the GPU interposer market size in 2025 because hyperscale deployments were still centered on building out training clusters. NVIDIA’s Rubin roadmap and AMD’s advanced AI accelerator roadmap both point to continued use of high-bandwidth memory-rich package designs, which support training package demand. The training segment, therefore, remains central to the GPU interposer market even as the workload mix begins to broaden.
AI inference accelerators are projected to expand at a 30.14% CAGR through 2031, which makes them the fastest-growing application in the GPU interposer market. The shift matters because inference systems still need advanced package integration when they serve large language models at production scale, even if procurement patterns differ from the earlier training wave. As inference deployments spread across cloud platforms and enterprise environments, demand becomes less concentrated around a narrow set of initial model builders. HPC and scientific computing remain a stable middle layer because buyers in those fields value reliability and validated performance over the fastest packaging transitions. Professional visualization and technical computing are moving more gradually, but these workloads still benefit from stripped-down interposer configurations where memory and bandwidth needs are above mainstream levels. Other specialized GPU compute uses, including robotics, edge inference, and autonomous simulation, remain smaller today, yet they widen the addressable scope of the GPU interposer market over the forecast period.
By Deployment End User:
Hyperscalers Dominate Current Demand While Service Models ExpandHyperscale cloud service providers commanded 64.07% of deployment end-user revenue in 2025, giving them the largest buying role in the GPU interposer market. Their share was high because they were the first customers able to absorb the cost, scale, and lead-time pressure tied to advanced AI package procurement. In 2025, hyperscalers effectively set the operating rhythm for the GPU interposer market share at the package level because early capacity was drawn toward the largest cloud and platform orders. This also explains why leading packaging lines stayed tight even as capacity expansions were announced. The GPU interposer market still depends heavily on hyperscaler visibility because these buyers influence memory sourcing, substrate commitments, and packaging priority at the same time.
GPU cloud, colocation, and managed-service providers are projected to grow at a 30.42% CAGR through 2031, which makes them the fastest-rising end-user group in the GPU interposer market. These providers address customers that need access to advanced GPU systems but do not want the full balance sheet burden of direct ownership. Their growth adds a second path for demand, because package-intensive hardware can now be monetized through service delivery rather than only through hyperscale internal deployment. Enterprise data centers remain more selective and cost aware, which may increase interest in hybrid and RDL-based package options as those designs mature. Research, academic, and government HPC centers continue to provide steady procurement through institutional programs, while defense and sovereign AI buyers add stricter requirements around packaging provenance and local qualification. The end-user mix is therefore broadening, and that gives the GPU interposer market a more diversified demand base than it had during the first phase of the AI build-out.
Geography Analysis
North America GPU Interposer Market
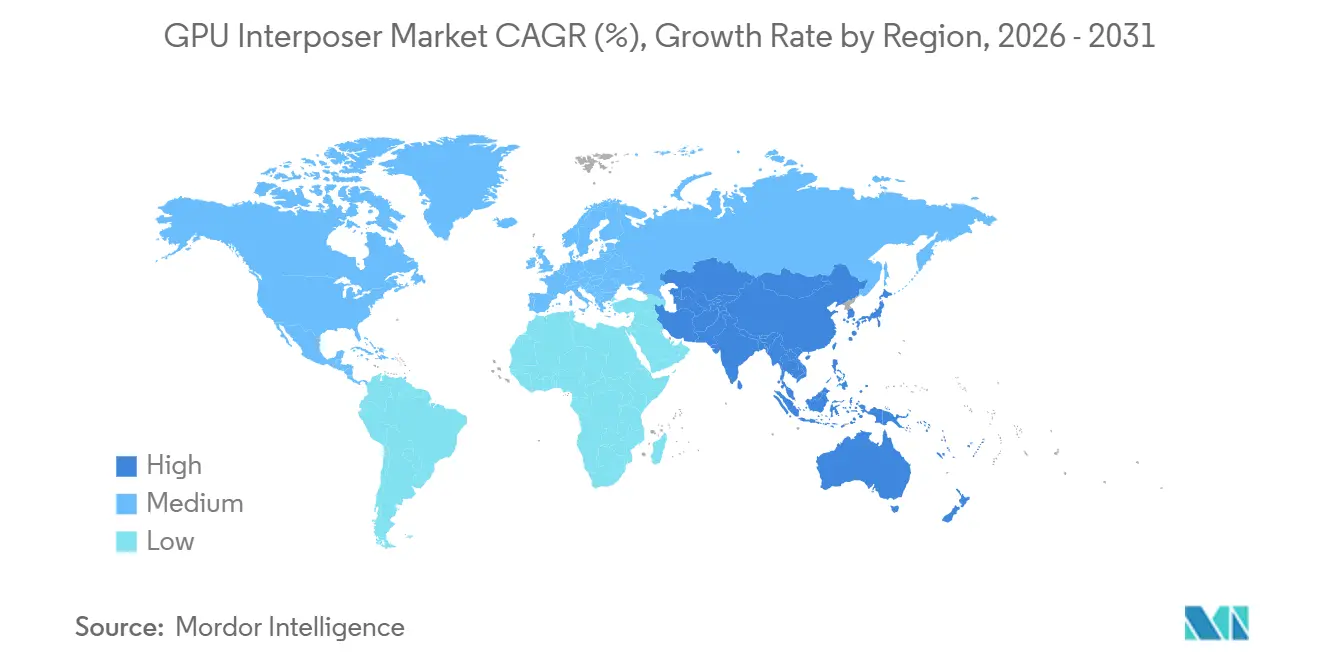
North America held 56.71% of revenue in 2025, which made it the largest regional contributor to the GPU interposer market. This lead came from the concentration of cloud platforms, AI system buyers, and advanced semiconductor customers in the United States and Canada. The United States also strengthened the policy backdrop in January 2025 through Executive Order 14179, which supported AI infrastructure development and faster siting activity. Canada added another layer of support through its national AI compute funding push, which reinforced sovereign demand for advanced packaged accelerator systems. North America also accounted for the largest share of the GPU interposer market size in 2025 because leading buyers there moved first and purchased at scale.
APAC GPU Interposer Market
Asia-Pacific is projected to expand at a 30.56% CAGR through 2031, which makes it the fastest-growing region in the GPU interposer market. The region’s importance is tied not only to demand but also to execution, because Taiwan, South Korea, Japan, and China sit close to core packaging, substrate, and memory supply chains. TSMC remains central to this structure because its CoWoS and related packaging ecosystem anchors a large part of the current AI accelerator assembly. Japan’s Ibiden and Taiwan’s Unimicron are also expanding substrate capacity, which supports the region’s role in keeping the GPU interposer market supplied during the next phase of growth. Asia-Pacific therefore combines the fastest expansion outlook with the strongest manufacturing leverage in the GPU interposer market.
EMEA and South America GPU Interposer Market
Europe remains a meaningful demand center because regional AI investment and packaging-related supply chain activity are both rising in the GPU interposer market. Demand in Europe is supported by cloud infrastructure expansion and a wider push for more locally resilient semiconductor capability. South America and the Middle East and Africa remain smaller contributors to the GPU interposer market, but they are becoming more relevant as sovereign compute programs move from planning to procurement. The geographic pattern is therefore uneven, with North America leading today, Asia-Pacific scaling the fastest, and Europe building a more strategic role across packaging and infrastructure. This mix keeps regional growth from depending on only one end market, which is favorable for long-term demand resilience in the GPU interposer market.

Competitive Landscape
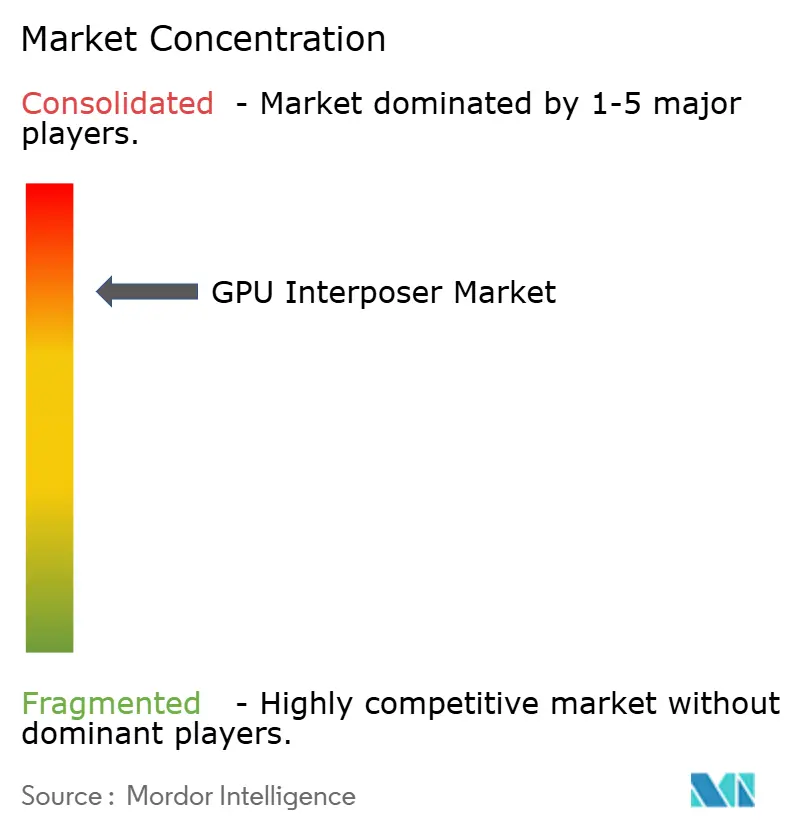
The GPU interposer market is highly concentrated at the advanced silicon interposer layer, while the wider packaging chain is more distributed across OSATs, substrate suppliers, and adjacent technology providers. TSMC remains the central manufacturing anchor because current high-performance GPU package flows are still tied closely to CoWoS and related advanced packaging capabilities. This gives the company a strong structural position, since customers who need proven high-volume output still have limited fully qualified alternatives. The GPU interposer market, therefore, shows intense competition in supporting layers, but much less room for disruption at the core manufacturing point. That dynamic keeps pricing power, customer scheduling, and expansion timing concentrated in a small part of the supply chain.
The first major competitive response is capacity expansion around the existing ecosystem. Amkor broke ground in Arizona in October 2025 on a new advanced packaging and test campus with planned investment rising to USD 7 billion, which signals the push to add domestic high-volume packaging capacity in the United States. Ibiden approved a large substrate investment program in February 2026, which shows that competitive positioning is increasingly tied to upstream material availability as much as final assembly scale. Unimicron also raised capital spending in 2026 to expand ABF capacity and upgrade processes, which supports the same effort to relieve bottlenecks. These moves matter because the GPU interposer market cannot expand smoothly if supporting materials remain constrained even while package demand stays strong.
The second competitive response is technology substitution. Intel is promoting EMIB-T as a larger-format and potentially lower-cost path for heterogeneous integration, which gives buyers an option outside pure silicon interposer scaling. Samsung is positioning RDL-interposer-based 3.3D packaging as another alternative, which could attract designs that value lower cost or different package geometry. Synopsys added another enabling layer in 2026 by completing a 64G UCIe IP tape-out on 2-nm technology, which lowers integration risk for advanced multi-die package programs. The competitive picture in the GPU interposer market is therefore not defined by many equal peers, but by a dominant manufacturing base, a limited set of scaling partners, and a small number of challengers trying to change the package architecture itself.
GPU Interposer Industry Leaders
Taiwan Semiconductor Manufacturing Company Limited
Samsung Electronics Co., Ltd.
ASE Technology Holding Co., Ltd.
Amkor Technology, Inc.
Intel Corporation
- *Disclaimer: Major Players sorted in no particular order
GPU Interposer Market Companies Covered in this Report
- Taiwan Semiconductor Manufacturing Company Limited
- Samsung Electronics Co., Ltd.
- ASE Technology Holding Co., Ltd.
- Amkor Technology, Inc.
- Intel Corporation
- NVIDIA Corporation
- Advanced Micro Devices, Inc.
- Broadcom Inc.
- Marvell Technology, Inc.
- Siliconware Precision Industries Co., Ltd.
- JCET Group Co., Ltd.
- Unimicron Technology Corp.
- Shinko Electric Industries Co., Ltd.
- AT&S Austria Technologie & Systemtechnik AG
- UMC (United Microelectronics Corporation)
- Powertech Technology Inc.
- Murata Manufacturing Co., Ltd.
- Toppan Inc.
- NGK Insulators, Ltd.

Recent Industry Developments in GPU Interposer Market
- June 2026: Synopsys completed tape-out of its 64G UCIe IP on 2-nm process technology, delivering a production-ready die-to-die interconnect solution with full UCIe 3.0 standard support for multi-source chiplet integration in advanced packages.
- March 2026: TSMC's CEO C.C. Wei confirmed during the Q1 2026 earnings call that CoWoS capacity is fully utilized through 2027, with the company targeting approximately 120,000-130,000 wafer starts per month by end-2026 through a combination of internal line expansion at the Tainan AP8 facility and outsourcing to OSAT partners.
- February 2026: Ibiden Co., Ltd. resolved at its Board of Directors meeting a JPY 500 billion (USD 3.3 billion) capital investment plan over fiscal 2026-2028, targeting expansion of high-performance IC package substrate production capacity for AI and high-performance servers across its Gama and Ono plants, with operations commencing sequentially from fiscal 2027.
- February 2026: Unimicron Technology set a record 2026 capital expenditure of NTD 34 billion (USD 1.0 billion), with approximately 70% allocated to ABF substrate capacity expansion and process upgrades; the company guided AI-related revenue to account for over 60% of total 2026 revenue, reflecting a structural shift in the business mix toward AI GPU and ASIC substrates.


Global GPU Interposer Market Report Scope
The GPU Interposer Market refers to the market for interposer substrates used to connect GPU dies, memory, and other chips within advanced semiconductor packages. Interposers act as a high-density wiring layer that enables faster data transfer, lower latency, and improved power efficiency between components.
The GPU Interposer Market Report is Segmented by Interposer Architecture (2.5D Silicon Interposer, RDL-Based/Hybrid Interposer, and 3D Active Base-Die / Interposer Integration), Application (AI Training Accelerators, AI Inference Accelerators, HPC and Scientific Computing, and Professional Visualization and Technical Computing), Deployment End User (Hyperscale Cloud Service Providers, GPU Cloud, Colocation, and Managed-Service Providers, Enterprise Data Centers, Research, Academic, and Government HPC Centers, and Defense and Sovereign AI Programs), and Geography (North America, Europe, Asia-Pacific, South America, Middle East and Africa). The Market Forecasts are Provided in Terms of Value (USD).
| 2.5D Silicon Interposer |
| RDL-Based / Hybrid Interposer |
| 3D Active Base-Die / Interposer Integration |
| AI Training Accelerators |
| AI Inference Accelerators |
| HPC and Scientific Computing |
| Professional Visualization and Technical Computing |
| Other Specialized GPU Compute Applications |
| Hyperscale Cloud Service Providers |
| GPU Cloud, Colocation, and Managed-Service Providers |
| Enterprise Data Centers |
| Research, Academic, and Government HPC Centers |
| Defense and Sovereign AI Programs |
| North America | United States |
| Canada | |
| Mexico | |
| Europe | Germany |
| United Kingdom | |
| France | |
| Italy | |
| Rest of Europe | |
| Asia-Pacific | China |
| Japan | |
| South Korea | |
| India | |
| Southeast Asia | |
| Rest of Asia-Pacific | |
| South America | |
| Middle East and Africa |
| By Interposer Architecture | 2.5D Silicon Interposer | |
| RDL-Based / Hybrid Interposer | ||
| 3D Active Base-Die / Interposer Integration | ||
| By Application | AI Training Accelerators | |
| AI Inference Accelerators | ||
| HPC and Scientific Computing | ||
| Professional Visualization and Technical Computing | ||
| Other Specialized GPU Compute Applications | ||
| By Deployment End User | Hyperscale Cloud Service Providers | |
| GPU Cloud, Colocation, and Managed-Service Providers | ||
| Enterprise Data Centers | ||
| Research, Academic, and Government HPC Centers | ||
| Defense and Sovereign AI Programs | ||
| By Geography | North America | United States |
| Canada | ||
| Mexico | ||
| Europe | Germany | |
| United Kingdom | ||
| France | ||
| Italy | ||
| Rest of Europe | ||
| Asia-Pacific | China | |
| Japan | ||
| South Korea | ||
| India | ||
| Southeast Asia | ||
| Rest of Asia-Pacific | ||
| South America | ||
| Middle East and Africa | ||


Key Questions Answered in the Report
What is the current and forecast value of the GPU interposer space?
The GPU interposer market size is expected to increase from USD 1.98 billion in 2025 to USD 2.57 billion in 2026 and reach USD 9.41 billion by 2031, at a 29.64% CAGR over 2026-2031.
Which interposer architecture currently leads revenue?
2.5D silicon interposer led revenue with a 76.28% share in 2025 because it remains the preferred format for current high-volume AI accelerator packages.
Which application is growing the fastest in GPU packaging demand?
AI inference accelerators are projected to grow at a 30.14% CAGR through 2031 as production AI deployments spread across cloud and enterprise environments.
Who buys most of the advanced GPU packages today?
Hyperscale cloud service providers led deployment end-user demand with a 64.07% revenue share in 2025 because they moved first at scale and absorbed the highest package costs.
Which region shows the strongest growth outlook?
Asia-Pacific is projected to expand at a 30.56% CAGR through 2031 because it combines rising demand with strong foundry, substrate, and packaging capacity.
What is the main near-term constraint on supply?
The clearest near-term constraint is advanced packaging capacity, especially large-area interposer availability, because CoWoS lines remain fully utilized and supporting substrate supply is still tight.
Page last updated on:





