
GPU Power Infrastructure Market Size and Share
Market Overview
| Study Period | 2020 - 2031 |
|---|---|
| Market Size (2026) | USD 15.31 Billion |
| Market Size (2031) | USD 37.92 Billion |
| Growth Rate (2026 - 2031) | 19.89 % |
| Fastest Growing Market | Asia-Pacific |
| Largest Market | North America |
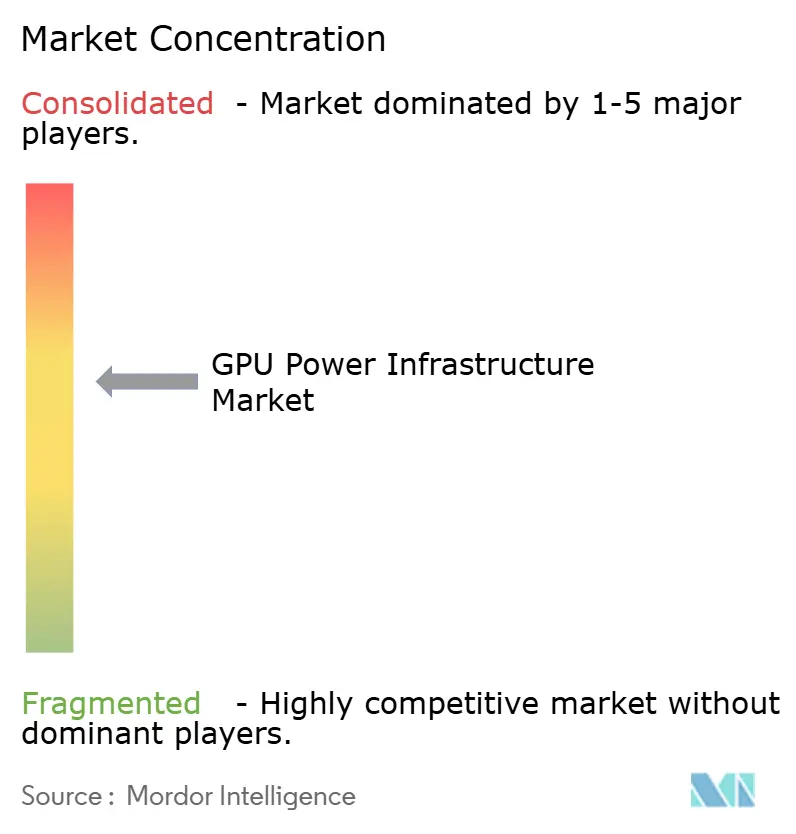
| Market Concentration | Medium |
Major Players *Disclaimer: Major Players sorted in no particular order Image © Mordor Intelligence. Reuse requires attribution under CC BY 4.0. | |
GPU Power Infrastructure Market Analysis by Mordor Intelligence
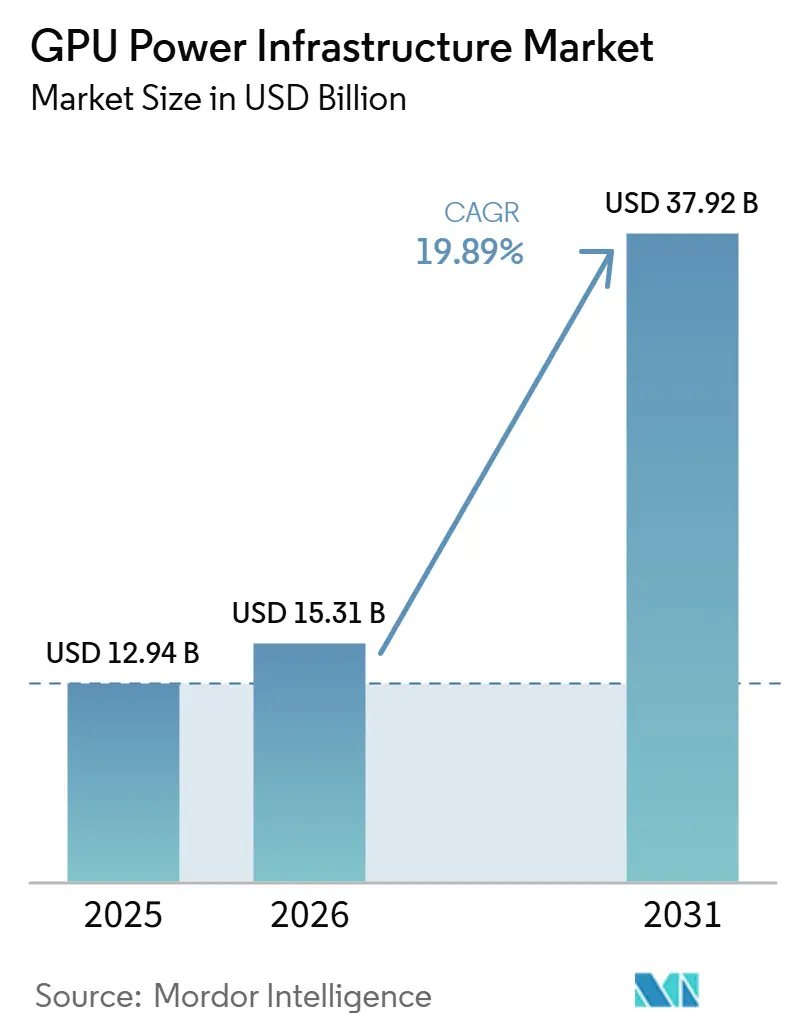
The GPU power infrastructure market size is expected to increase from USD 12.94 billion in 2025 to USD 15.31 billion in 2026 and reach USD 37.92 billion by 2031, growing at a CAGR of 19.89% over 2026-2031. The GPU power infrastructure market is moving quickly because AI training and inference clusters now require electrical systems built for far higher rack densities than earlier server environments. This has raised spending on switchgear, UPS systems, transformers, rectifiers, busways, and power management platforms, especially in projects that combine new campuses with accelerated retrofits of existing sites. The GPU power infrastructure market is also being shaped by a shift in procurement behavior, since operators now favor vendors that can deliver integrated hardware, commissioning support, and repeatable designs rather than stand-alone equipment packages. Competitive positioning depends less on broad product catalogs and more on execution under tight build schedules, certification readiness for high-voltage designs, and the ability to support gigawatt-scale programs. The most attractive opportunities are concentrated where power density, interconnection pressure, and retrofit urgency are rising together, because those conditions lift infrastructure value per deployment and widen the role of specialist service providers.
Key Report Takeaways
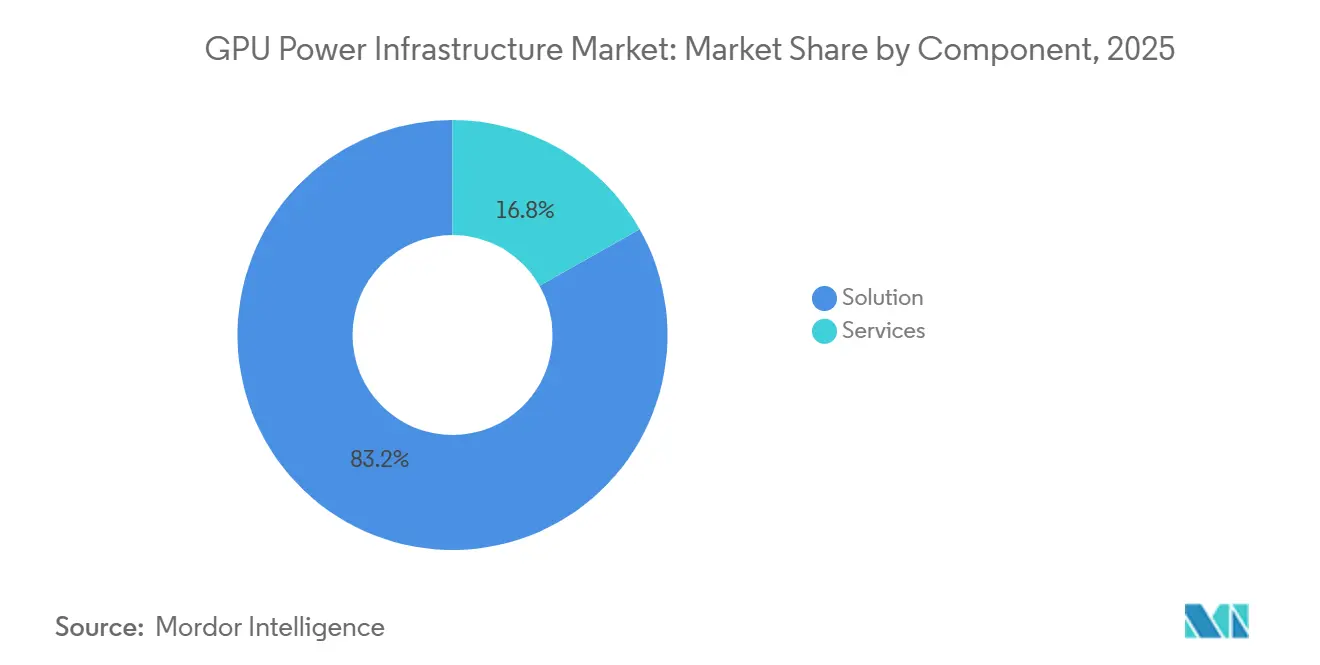
- By component, solutions held 83.19% of the GPU power infrastructure market share in 2025, while services are projected to expand at a 20.57% CAGR through 2031.
- By power architecture, infrastructure-level power accounted for 46.53% of the GPU power infrastructure market size in 2025, while rack-level power is projected to grow at a CAGR of 20.78% through 2031.
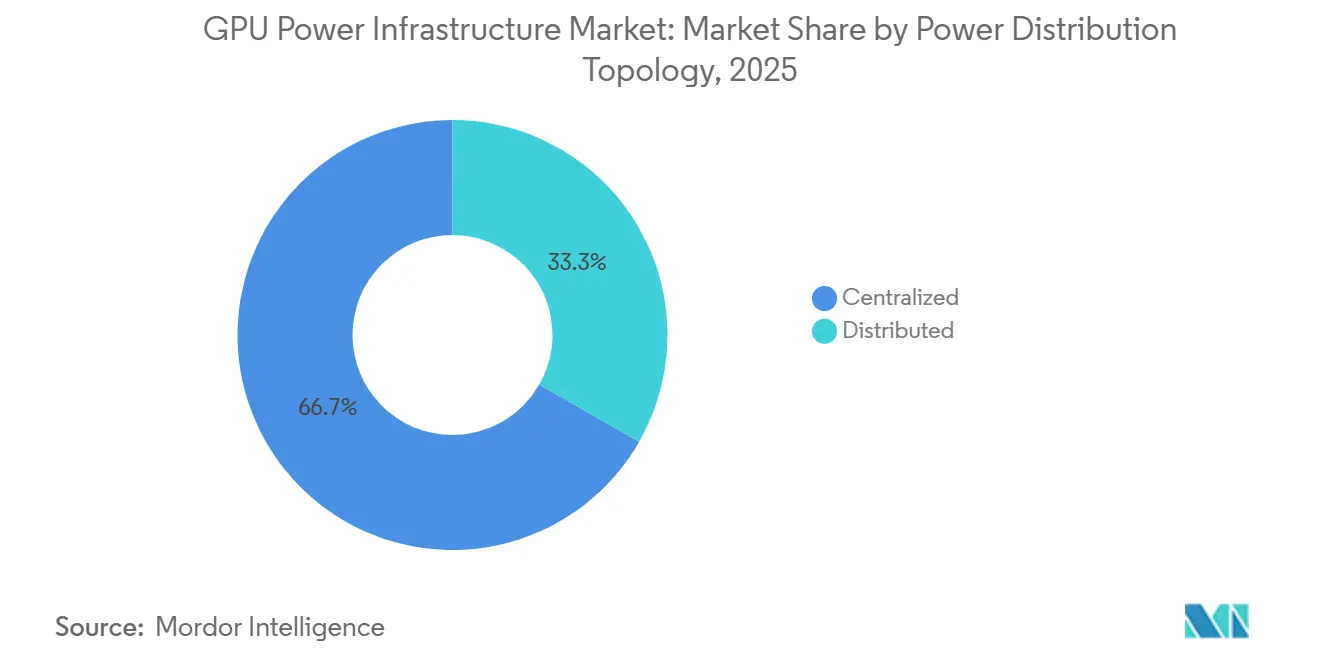
- By power distribution topology, centralized power distribution captured 66.74% of the GPU power infrastructure market share in 2025, while distributed power distribution is projected to grow at a 21.16% CAGR through 2031.
- By data center type, hyperscale data centers held 70.32% share in 2025, while edge data centers are projected to expand at a 20.65% CAGR through 2031.
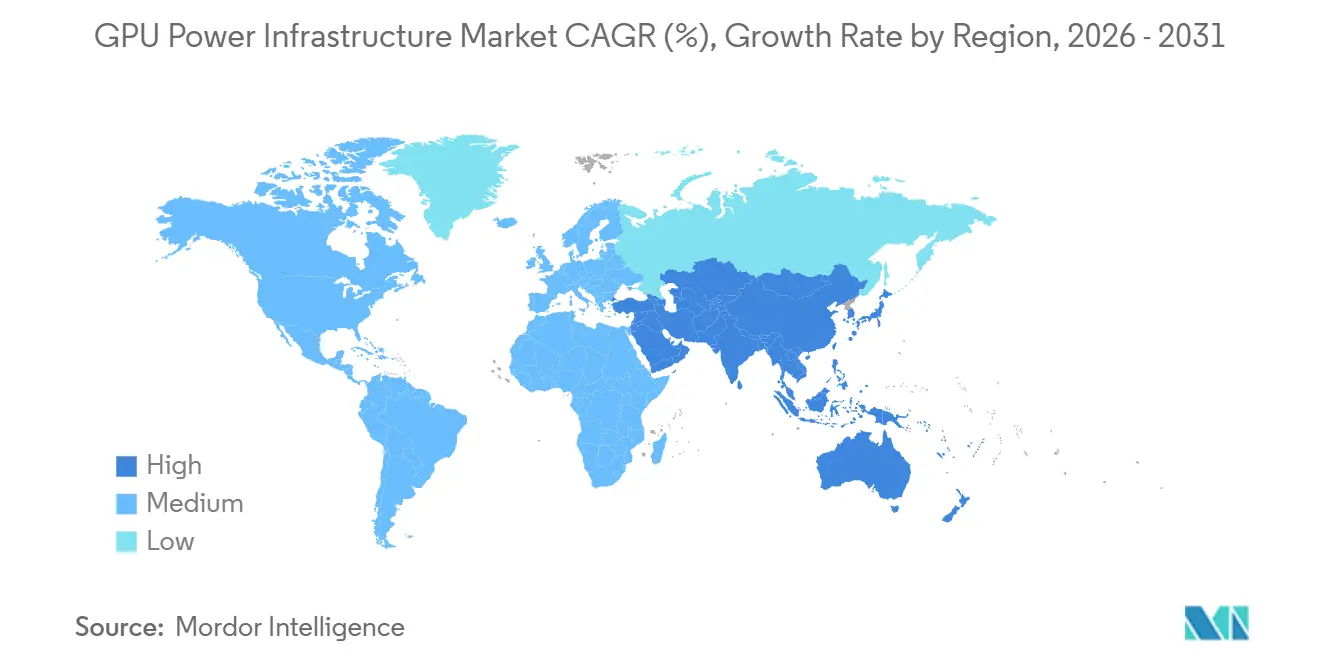
- By geography, North America held 43.91% share in 2025, while Asia-Pacific is projected to expand at a 21.46% CAGR through 2031.
Note: Market size and forecast figures in this report are generated using Mordor Intelligence’s proprietary estimation framework, updated with the latest available data and insights as of January 2026.
Market Trends and Insights
Drivers Impact Analysis of GPU Power Infrastructure Market*
| Driver | (~) % Impact on CAGR Forecast | Geographic Relevance | Impact Timeline |
|---|---|---|---|
| Rising AI cluster power density in GPU training halls | +5.5% | Global, concentrated in North America, China, and Japan | Short term (≤ 2 years) |
| Shift toward high-voltage rack-level power architectures | +4.2% | Global, led by North America and Asia-Pacific hyperscale operators | Medium term (2-4 years) |
| Expansion of hyperscale and colocation capacity built for accelerated computing | +3.8% | North America, Asia-Pacific, Europe | Short term (≤ 2 years) |
| Demand for modular, rapid-deploy power blocks in brownfield retrofits | +2.1% | North America and Europe, with spillover to the Middle East and Africa | Medium term (2-4 years) |
| Grid interconnection constraints are accelerating on-site power conditioning demand | +1.8% | North America, Europe, India, and Southeast Asia | Medium term (2-4 years) |
| Utility reliability risk increasing multi-layer redundancy investments | +1.2% | Global, with acute pressure in Texas, PJM, and high-load European regions | Long term (≥ 4 years) |
| Source: Mordor Intelligence | |||
Rising AI Cluster Power Density Drives Infrastructure Redesign
The GPU power infrastructure market is being pushed upward by the jump in rack power density between recent GPU generations, because the system-level increase has been much sharper than the rise in chip thermal design power alone. NVIDIA stated that its Vera Rubin VR200 NVL72 rack-scale systems draw 190-230 kW per rack, which is far above levels seen in the Hopper generation and well beyond the design point of older data center electrical rooms. That shift has changed the GPU power infrastructure market from a procurement category into a gating factor for project timing, because power delivery now determines whether large AI clusters can be energized on schedule. The next platform cycle keeps this pressure high, since Rubin Ultra Kyber has been specified at 600 kW per rack, and later platforms are moving toward 1 MW-class rack designs. Traditional 54 VDC distribution cannot support these densities without severe penalties in copper volume, cable bulk, and resistive losses, meaning even new facilities must redesign their electrical architecture rather than extend older layouts. The GPU power infrastructure market is therefore benefiting not only from higher server counts, but also from a structural increase in power infrastructure spend for every high-density rack that enters service.
Shift Toward High-Voltage Rack-Level Power Architectures
The GPU power infrastructure market is also being boosted by the shift toward 800 VDC high-voltage direct current designs, which eliminate several conversion stages that previously limited end-to-end efficiency. NVIDIA stated that an 800 VDC wire gauge can carry 157% more power than a 415 VAC equivalent, thereby reducing conductor weight, cable congestion, and conversion losses across dense AI deployments. This is expanding the GPU power infrastructure market across multiple layers, as centralized rectifiers, 800 VDC-rated busways, protection systems, and rack-level DC-DC conversion become higher-value parts of the electrical stack. Vertiv moved its 800 VDC platform from concept to engineering readiness in October 2025 and planned a commercial release in the second half of 2026, aligning vendor roadmaps with NVIDIA’s Rubin Ultra cycle.[1] The Open Compute Project Foundation also launched its Power Distribution Project in 2025 to define voltage, connector, and safety standards for 800 VDC systems, which reduces uncertainty around broad deployment. As standards and product availability move forward together, the GPU power infrastructure market gains a clearer path from early adoption to scaled rollouts across hyperscale and colocation facilities.
Hyperscale And Colocation Expansion Creates Structural Demand For GPU-Optimized Power
The GPU power infrastructure market is seeing structural demand from hyperscale and colocation expansion, as current AI build programs are planned in very large capacity blocks rather than through gradual additions. Microsoft announced in June 2026 that its new Pecos, Texas campus would add 2 GW of global capacity, making it one of the company’s largest single capacity additions and reinforcing the scale now associated with AI-ready campuses. CoreWeave reported more than 1 GW of active power in the first quarter of 2026, more than 3.5 GW of contracted power, and a path toward 8 GW by 2030, which shows how a small number of operators are concentrating future infrastructure demand. This matters to the GPU power infrastructure market because a narrow set of procurement relationships now accounts for a large share of the order flow in high-density electrical equipment and deployment services. The same concentration raises the value of suppliers that can deliver repeatable power blocks, validated interfaces, and field support across multi-campus expansion programs rather than one-off projects. Colocation providers are also reinforcing this cycle by offering GPU-ready halls with higher rack power thresholds, which broadens the customer base for AI-capable power systems without reducing the need for specialist integration.
Modular Rapid-Deploy Power Blocks Address Brownfield Retrofit Constraints
The GPU power infrastructure market is gaining support from modular power blocks, as a growing share of new GPU capacity is being placed in campuses originally designed for much lower rack densities. Many brownfield sites were sized for 8-12 kW per rack, yet AI developers now want much faster deployment than a full greenfield build would allow, which creates strong demand for prefabricated electrical solutions. Vertiv stated in 2025 that its SmartRun system enabled 85% faster on-site deployment than traditional stick-built methods and supported installations of 1 MW or more per day with a single crew. That operating model matters to the GPU power infrastructure market because it turns delivery speed into a source of competitive advantage for vendors that can package switchgear, UPS, busway, and cooling interfaces into repeatable modules. Modular power blocks also help operators work around interconnection delays by enabling smaller deployments at distribution-level connection points before larger transmission capacity becomes available. The result is a stronger retrofit pipeline, especially in locations where AI demand has arrived faster than utility, building, and electrical room upgrades can be completed through conventional methods.
Restraints Impact Analysis of GPU Power Infrastructure Market*
| Restraint | (~) % Impact on CAGR Forecast | Geographic Relevance | Impact Timeline |
|---|---|---|---|
| High upfront cost of high-density electrical rooms and backup architecture | -1.8% | Global, most acute in emerging markets and mid-tier operators with constrained balance sheets | Medium term (2-4 years) |
| Long lead times for switchgear, transformers, and high-capacity UPS systems | -1.5% | Global, with highest severity in North America, Europe, and Southeast Asia | Short term (≤ 2 years) |
| Limited availability of skilled commissioning and power-integration labor | -0.9% | North America, Europe, and selective Southeast Asian markets | Medium term (2-4 years) |
| Thermal and spatial constraints in existing facilities restricting GPU retrofit scale-up | -0.6% | Global, concentrated in Singapore, Frankfurt, London, and Tokyo | Short term (≤ 2 years) |
| Source: Mordor Intelligence | |||
High Upfront Capital Intensity Limits Participation Among Non-Hyperscale Operators
The GPU power infrastructure market faces a clear adoption limit among enterprise operators and mid-tier colocation providers because high-density GPU halls require a much heavier electrical investment than traditional server environments. The move toward 800 VDC architectures often means new centralized rectifiers, specialized busways, redundant battery systems, and protection equipment that do not fit easily into legacy upgrade cycles. NVIDIA indicated that the value of power infrastructure per AI server rack could rise by more than 1,000% as deployments shift from current GB200-class systems to Vera Rubin CPX-class systems, sharply raising the capital threshold for participation. In practice, that means a single 1 MW GPU hall can demand the kind of electrical spending that previously supported a much larger conventional footprint, which slows entry by non-top-tier cloud operators. Compliance with standards such as IEC 61439 and UL 857 adds more engineering and testing work, which further favors suppliers and buyers with deeper technical teams. The GPU power infrastructure market, therefore, has strong demand momentum, yet part of that demand stays concentrated because many potential buyers cannot absorb the upfront replacement cost of the new power stack.
Electrical Equipment Supply Chain Bottlenecks Constrain Deployment Timelines
The GPU power infrastructure market is also constrained by long lead times in transformers, switchgear, and related grid-facing equipment, because project schedules can only move as fast as the slowest electrical component. The input material showed large power transformer lead times averaging 128 weeks in 2026 and generator step-up unit lead times averaging 144 weeks, placing the energization risk well beyond the normal planning window for AI capacity additions. The same material noted that some custom high-voltage gear stretched to 36-48 months, meaning sites that secure land and funding can still miss deployment targets if electrical orders are not placed early enough. The International Energy Agency noted that 20% of planned data center projects face delay risk tied to grid limits and transformer bottlenecks, which supports the view that this is a structural rather than a temporary problem. EPRI’s 2024 assessments also pointed to labor constraints in distribution and substation engineering across major U.S. AI data center regions, which suggests that manufacturing additions alone may not remove the bottleneck quickly. As a result, the GPU power infrastructure market continues to grow, but order backlogs, labor shortages, and grid timing continue to shape when revenue can be recognized and when end users can bring capacity online.
*Our forecasts treat driver/restraint impacts as directional, not additive. The impact forecasts reflect baseline growth, mix effects, and variable interactions.
GPU Power Infrastructure Market Segment Analysis
By Component:
Solutions Lead, While Services Lift Lifecycle DemandSolutions held an 83.19% share of the GPU power infrastructure market in 2025, reflecting how much of the initial spending still goes toward UPS arrays, transformers, switchgear, PDUs, centralized rectifiers, and related hardware during facility buildout. This part of the GPU power infrastructure market remains dominant because each major GPU generation forces operators to refresh large sections of the electrical stack rather than bolt on higher loads to older systems. In that environment, equipment procurement remains the first and largest capital decision, especially for hyperscale campuses where the electrical room is designed for staged expansion across multiple halls. The solutions base is also supported by the fact that facility-level power architecture now captures a larger share of technical complexity as conversion stages are centralized and rack densities rise. That keeps hardware contracts large, multi-phase, and closely tied to site commissioning schedules.
Services are projected to grow at a 20.57% CAGR from 2026 to 2031, making them the fastest-growing component of the GPU power infrastructure market, even though they start from a smaller base. Operators increasingly need support with commissioning, dynamic power management, digital twin use, and high-density load balancing, as many internal teams were built for conventional data center operations rather than AI-powered behavior. Vertiv highlighted its 4,000-plus field service engineers in its March 2026 Vera Rubin DSX announcement, which shows how service capacity is becoming a direct selling point beside product depth. This shift suggests that the GPU power infrastructure industry is moving toward a lifecycle model, where buyers increasingly value validated deployment support and ongoing operational tuning along with the equipment itself. It also means vendors with strong field organizations can deepen customer relationships after hardware delivery and widen their revenue mix over the forecast period.
By Power Architecture:
Infrastructure-Level Dominance Faces a Rack-Level ChallengeInfrastructure-level power accounted for 46.53% of the GPU power infrastructure market in 2025, indicating that facility-edge systems still account for the largest share of value in current deployments. This layer includes medium-voltage switchgear, main distribution boards, facility-level UPS systems, generators, and the core conversion assets that anchor the entire electrical design. The GPU power infrastructure market has favored this architecture because every AI-ready data center must establish a reliable upstream power foundation before value can shift deeper into row or rack layers. The move toward 800 VDC reinforces that position by transferring more conversion and control responsibility into centralized rectifiers and busway-linked distribution systems. As a result, infrastructure-level power remains the primary design point and the main area where failure would affect the entire campus rather than a limited rack group.
Rack-level power is projected to grow at a 20.78% CAGR from 2026 to 2031, indicating how quickly value is also being built at the point of consumption within dense GPU clusters. NVIDIA’s Kyber rack architecture distributes high voltage to each compute node via a high-ratio 64:1 LLC converter, elevating the rack interface to a major engineering specification rather than a routine component choice. That change expands the GPU power infrastructure market for intelligent rack-level conditioning, in-rack buffering, and tightly coordinated control between upstream power systems and compute nodes. Eaton’s Beam Rubin DSX platform, introduced in March 2026, was framed as an end-to-end grid-to-chip power ecosystem, which reflects how vendors are responding to the need for coordinated design across all electrical layers.[2] The practical outcome is not a loss of relevance for infrastructure-level assets, but a broader architecture contest in which both the facility edge and the rack edge capture more value than they did in conventional server environments.
By Power Distribution Topology:
Centralized Baseline, With Distributed MomentumCentralized power distribution held a 66.74% share in 2025, making it the baseline topology across the GPU power infrastructure market. Hyperscale operators continue to favor centralized rectification, centralized UPS design, and uniform distribution across standardized rows because this structure simplifies commissioning and operational control at a large campus scale. The same topology also aligns naturally with the 800 VDC transition, since major conversion steps are moved to the facility edge before high-voltage power is delivered deeper into the white space. Centralized systems also make it easier to manage standards compliance for UPS and busway assemblies, which matters for operators who want repeatable designs across multiple halls and regions. That combination of scale efficiency, certification clarity, and design familiarity explains why centralized topology still leads the GPU power infrastructure market today.
Distributed power distribution is projected to expand at a 21.16% CAGR from 2026 to 2031, which makes it the fastest-growing topology in the GPU power infrastructure market. Growth is coming from edge data centers, modular campuses, and brownfield retrofits where operators cannot always devote enough electrical room space to a fully centralized design. The input material noted that operators of distributed training clusters are intentionally overprovisioning rack-level UPS capacity to absorb AI workload power spikes, which shows how distributed management logic is moving closer to the load. In those settings, localized resiliency and phased deployment can be more valuable than a single centralized architecture, especially when facilities are being expanded around site constraints rather than greenfield design freedom. The result is a dual-track market in which centralized topology remains dominant for hyperscale builds, while distributed topology grows faster in places where flexibility, retrofit practicality, and modular rollout matter more.
By Data Center Type:
Hyperscale Anchors Demand, While Edge Opens New Use CasesHyperscale data centers captured a 70.32% share in 2025, making them the core demand center for the GPU power infrastructure market. This reflects the simple fact that frontier model training still depends on clusters of tens of thousands of GPUs, all housed within a power envelope that supports high-density, synchronized electrical behavior. The report's content pointed to Meta’s 83,000-GPU GB200 AI supercomputer with a 150 MW IT load, and to xAI’s Colossus cluster at 770,000 GPUs and 1 GW of IT compute in the first quarter of 2026, which illustrates the current upper end of deployment scale. These projects keep the GPU power infrastructure market centered on large campuses because the supporting electrical systems must be planned as integrated platforms rather than incremental room-by-room additions. Colocation providers still matter in this structure, but their role is increasingly tied to offering pre-built high-density capacity that can attract AI tenants without matching hyperscaler ownership of the largest clusters.
Edge data centers are projected to grow at a 20.65% CAGR from 2026 to 2031, which makes them the fastest-growing data center type in the GPU power infrastructure market. Edge deployments are being driven by inference workloads that need lower latency near users, in industrial locations, and in telecom networks, and this changes the shape of power infrastructure demand more than its direction. In 2026, these projects typically operate in the 2-20 MW range, where site selection depends heavily on the ability to secure distribution-level grid access without long transmission delays. That dynamic raises the revenue value of compact UPS systems, prefabricated PDUs, modular generation, and tightly integrated power blocks because the electrical bill of materials is high relative to facility size. ECL’s FlexGrid platform, introduced in 2026 for GPU-ready capacity at 2-25 MW scale, reflects how suppliers are building around this need for dense infrastructure in smaller but still demanding footprints. Edge does not displace hyperscale in the GPU power infrastructure market, yet it widens the customer mix and creates a second growth lane with different design constraints and a higher emphasis on modularity.
Geography Analysis
North America GPU Power Infrastructure Market
North America held a 43.91% share of the GPU power infrastructure market in 2025, making it the largest regional base for current revenue. The region benefits from a dense cluster of hyperscale campuses, a strong presence of GPU cloud operators, and very large capital deployment programs centered on AI infrastructure. CoreWeave reported more than 1 GW of active power in the first quarter of 2026 and more than 3.5 GW of contracted power, underscoring the scale of current expansion pressure in the region. North America also faces the same conditions that are increasing demand for behind-the-meter support systems, as interconnection queue wait times have risen sharply over the past decade, and reform measures are still being implemented. That combination keeps the GPU power infrastructure market active across both campus-level buildouts and site-level investments in redundancy, power conditioning, and staged energization.
Europe GPU Power Infrastructure Market
Europe remains an important part of the GPU power infrastructure market because AI-capable data center expansion is now more closely linked to energy policy, efficiency rules, and national digital strategies. Germany is central to this regional picture, since the federal government adopted its data center strategy in March 2026 with a target to double general data center capacity and quadruple AI-specific capacity by 2030. The same country recorded data center electricity consumption rising from 20 TWh in 2024 to 21.3 TWh in 2025, which points to a growing power burden even before the next wave of AI projects is fully built out. Germany’s requirement for new data centers to source energy from renewables from 2027 adds another layer of infrastructure planning, because operators must align capacity growth with both power availability and compliance needs. These conditions support the GPU power infrastructure market in Europe, but they also make project timing and design choices more dependent on power sourcing strategy than in some other regions.
APAC, South America and MEA GPU Power Infrastructure Market
Asia-Pacific is projected to grow at a 21.46% CAGR through 2031, which makes it the fastest-growing regional segment in the GPU power infrastructure market. The region is being driven by sovereign AI programs, hyperscaler expansion, and a fast rise in per-rack power density across large data center markets. NTT stated in April 2026 that it plans to expand IT power capacity from 300 MW to 1 GW by fiscal year 2033, with its new AI-focused campus in Inzai and Shiroi targeting 250 MW of total IT capacity.[3] Equinix also opened its first AI-ready data center in Chennai in September 2025 with an initial investment of USD 69 million and liquid-cooling-ready infrastructure for high-density GPU workloads. South America and the Middle East and Africa remain earlier-stage markets in the GPU power infrastructure market, but recent framework agreements and early campus investments show that AI-ready electrical capacity is beginning to extend beyond the largest established regions.
Competitive Landscape
The GPU power infrastructure market is moderately consolidated; however, it remains broad because hyperscalers, neocloud providers, colocation operators, and server OEMs still make separate infrastructure choices based on site design, timing, and customer needs. This creates a market where no single supplier controls the full buying landscape, even though a small group of vendors has technical credibility in the most demanding power categories. Competition is now centered on who can certify end-to-end 800 VDC architectures, deliver validated reference designs, and shorten deployment time for very large AI campuses. The GPU power infrastructure market, therefore, rewards execution depth as much as product breadth, especially when customers are ordering for multi-hall or multi-campus programs rather than for isolated rooms.
Vertiv’s position in the GPU power infrastructure market is being strengthened by its unit-of-compute approach and its role in the NVIDIA Vera Rubin DSX ecosystem, where it is supplying simulation-ready digital power and cooling assets and repeatable infrastructure blocks. Schneider Electric is also reinforcing its role through large campus execution, including phased delivery of more than USD 290 million in AI infrastructure solutions at TeraWulf’s Lake Mariner site in New York.[4] Its June 2026 collaboration with Foxconn also shows a push toward integrated and ready-to-deploy AI data center systems that combine power expertise with GPU rack integration. Eaton has entered the same contest with Beam Rubin DSX, which it presented as a grid-to-chip offering designed to compress AI factory construction timelines from years to months. These moves show that the GPU power infrastructure market is shifting toward bundled execution models, where value comes from design coordination, factory readiness, and site delivery discipline.
White space in the GPU power infrastructure market is still visible in medium-voltage battery storage linked directly with UPS systems, in brownfield conversion kits that let legacy AC or 48 VDC systems coexist with 800 VDC islands, and in managed power services for operators with limited in-house commissioning depth. Those gaps matter because the next stage of growth is not only about new campuses, but also about making existing facilities usable for higher-density AI workloads without full replacement. The input content pointed to Vertiv’s work on multi-megawatt battery-backed blocks and to rising demand from buyers with very large capital plans, which suggests that service-led and modular offerings could widen faster than traditional catalog products. Standards work is also influencing competition, because the Open Compute Project’s 800 VDC initiative is helping shape vendor roadmaps across power equipment, semiconductor, and data center system providers. The GPU power infrastructure market is likely to stay competitive rather than winner-take-all, since technical leadership is becoming more important, yet customers still vary widely by geography, site condition, power availability, and deployment model.
GPU Power Infrastructure Industry Leaders
-
NVIDIA Corporation
-
Amazon Web Services, Inc.
-
Microsoft Corporation
-
Google LLC
-
Oracle Corporation
- *Disclaimer: Major Players sorted in no particular order
GPU Power Infrastructure Market Companies Covered in this Report
- NVIDIA Corporation
- Amazon Web Services, Inc.
- Microsoft Corporation
- Google LLC
- Oracle Corporation
- Advanced Micro Devices, Inc.
- Intel Corporation
- Dell Technologies Inc.
- Hewlett Packard Enterprise Development LP
- Super Micro Computer, Inc.
- Lenovo Group Limited
- CoreWeave, Inc.
- Lambda Labs, Inc.
- Alibaba Cloud
- Equinix, Inc.
- Digital Realty Trust, Inc.
- Vertiv Group Corp.
- Schneider Electric SE
Recent Industry Developments in GPU Power Infrastructure Market
- June 2026: Microsoft announced the development of a new data center campus in Pecos, Texas, adding 2 GW of global capacity. The campus is designed to support AI and cloud services at scale, with high-density GPU infrastructure as a primary workload.
- June 2026: Vertiv, Edge-Serve, IRCL, and PDC signed a framework agreement to deliver converged AI-ready data center infrastructure across the Gulf region, establishing a multi-party program to accelerate GPU-ready capacity across GCC high-growth markets.
- May 2026: Schneider Electric completed the phased delivery of more than USD 290 million in AI infrastructure solutions at TeraWulf’s Lake Mariner campus in Barker, New York, including Galaxy VX UPS systems, lithium-ion battery systems, and EcoStruxure IT software. The campus is targeting 750 MW of total power demand at full buildout.
- March 2026: Eaton and NVIDIA unveiled the Eaton Beam Rubin DSX platform at GTC 2026, providing an end-to-end AI factory power ecosystem integrated with the NVIDIA Vera Rubin DSX reference design. The platform scales from megawatts to hundreds of megawatts and is designed to compress AI factory construction timelines from years to months.
Global GPU Power Infrastructure Market Report Scope
The GPU power infrastructure market covers the systems, components, and solutions that support the efficient and reliable delivery, conversion, distribution, and management of power for graphics processing units (GPUs) used in data centers, high-performance computing environments, artificial intelligence workloads, gaming systems, professional visualization, and other GPU-intensive applications. The scope of the report includes power distribution units, power supplies, voltage regulators, cooling-related power systems, rack-level power infrastructure, and associated monitoring and management solutions across key end-user industries and regions.
The GPU Power Infrastructure Market Report is Segmented by Component (Solution, and Services), Power Architecture (Rack-Level Power, Row/Pod-Level Power, and Infrastructure-Level Power), Power Distribution Topology (Centralized, and Distributed), Data Center Type (Hyperscale Data Centers, Colocation Data Centers, Enterprise Data Centers, and Edge Data Centers), and Geography (North America, Europe, Asia-Pacific, South America, and Middle East and Africa). The Market Forecasts are Provided in Terms of Value (USD).
Segmentation Overview
| Solution |
| Services |
| Rack-Level Power |
| Row/Pod-Level Power |
| Infrastructure-Level Power |
| Centralized |
| Distributed |
| Hyperscale Data Centers |
| Colocation Data Centers |
| Enterprise Data Centers |
| Edge Data Centers |
| North America | United States |
| Canada | |
| Mexico | |
| Europe | Germany |
| United Kingdom | |
| France | |
| Italy | |
| Rest of Europe | |
| Asia-Pacific | China |
| Japan | |
| South Korea | |
| India | |
| Southeast Asia | |
| Rest of Asia-Pacific | |
| South America | |
| Middle East and Africa |
| By Component | Solution | |
| Services | ||
| By Power Architecture | Rack-Level Power | |
| Row/Pod-Level Power | ||
| Infrastructure-Level Power | ||
| By Power Distribution Topology | Centralized | |
| Distributed | ||
| By Data Center Type | Hyperscale Data Centers | |
| Colocation Data Centers | ||
| Enterprise Data Centers | ||
| Edge Data Centers | ||
| By Geography | North America | United States |
| Canada | ||
| Mexico | ||
| Europe | Germany | |
| United Kingdom | ||
| France | ||
| Italy | ||
| Rest of Europe | ||
| Asia-Pacific | China | |
| Japan | ||
| South Korea | ||
| India | ||
| Southeast Asia | ||
| Rest of Asia-Pacific | ||
| South America | ||
| Middle East and Africa | ||
Key Questions Answered in the Report
What is the current and forecast value of the GPU power infrastructure space?
The GPU power infrastructure market stood at USD 15.31 billion in 2026 and is expected to reach USD 37.92 billion by 2031, growing at a 19.89% CAGR over 2026-2031.
What is driving demand for power systems built for GPU clusters?
The main driver is the sharp rise in rack power density, which is forcing data center operators to redesign electrical rooms, conversion stages, and rack-level delivery systems for AI workloads.
Which component category leads to current revenue?
Solutions led in 2025 with an 83.19% share because initial buildouts still require heavy spending on UPS systems, transformers, switchgear, PDUs, and rectifiers.
Which segment is growing the fastest by topology?
Distributed power distribution is the fastest-growing topology, with a projected 21.16% CAGR through 2031, supported by edge deployments and brownfield retrofits.
Which region is expanding the fastest?
Asia-Pacific is projected to record the highest regional CAGR at 21.46% through 2031, supported by sovereign AI programs, hyperscaler expansion, and higher rack-density rollouts.
Why do supply chain issues matter so much in this space?
Long lead times in transformers, switchgear, and high-capacity UPS systems can delay energization by years, making electrical equipment availability a direct constraint on AI capacity deployment.