Automotive Market Size and Share
Market Overview
| Study Period | 2019 - 2030 |
|---|---|
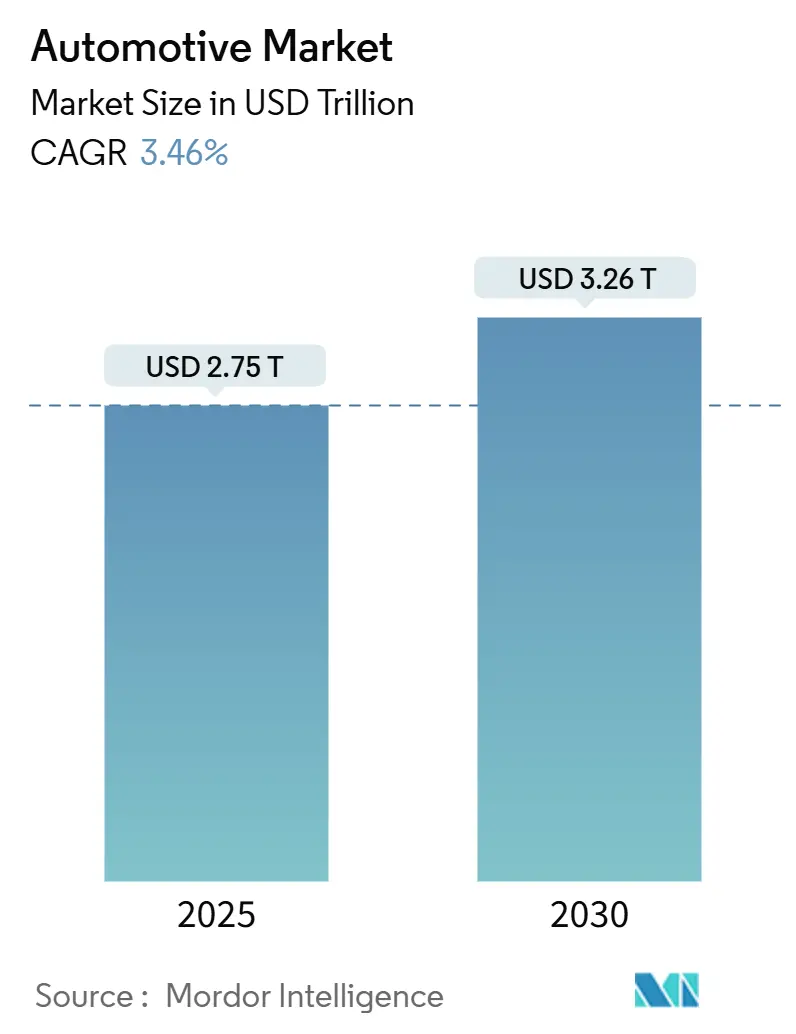
| Market Size (2025) | USD 2.75 Trillion |
| Market Size (2030) | USD 3.26 Trillion |
| Growth Rate (2025 - 2030) | 3.46% CAGR |
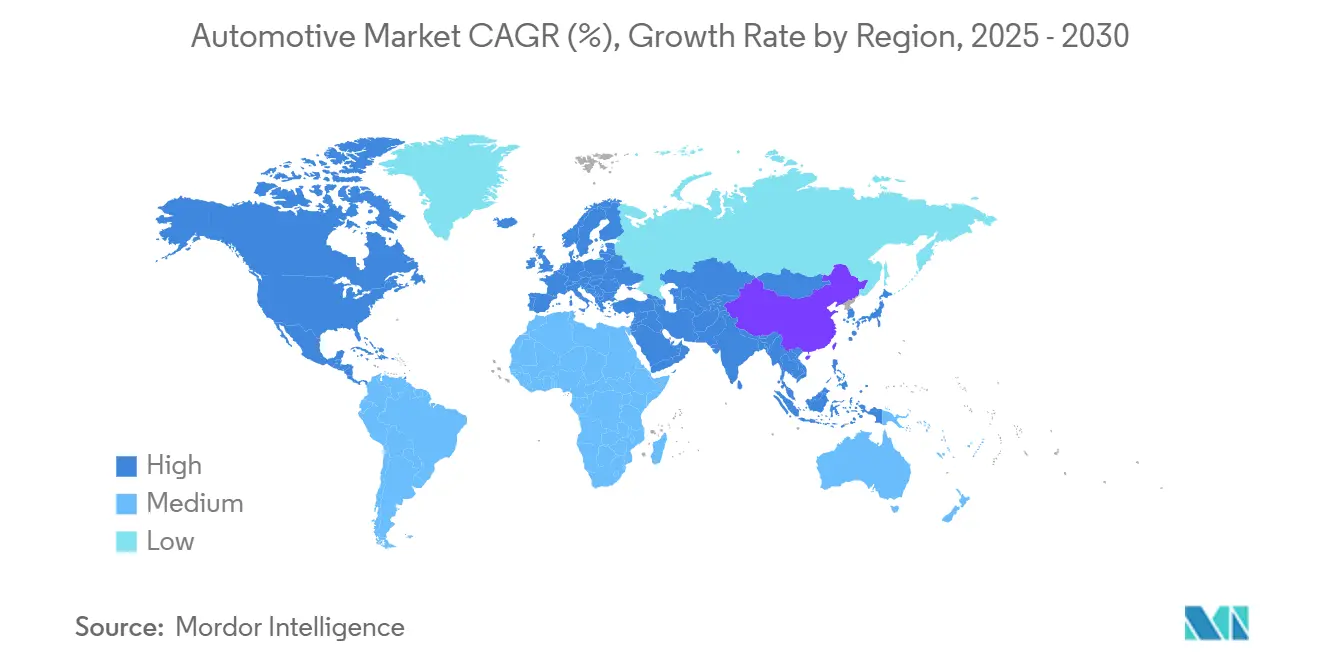
| Fastest Growing Market | Asia Pacific |
| Largest Market | Asia Pacific |
| Market Concentration | Medium |
Major Players *Disclaimer: Major Players sorted in no particular order Image © Mordor Intelligence. Reuse requires attribution under CC BY 4.0. | |
Automotive Market Analysis by Mordor Intelligence
The automotive market size reached USD 2.75 trillion in 2025 and is projected to hit USD 3.26 trillion by 2030, advancing at a 3.46% CAGR during the forecast period. Tightening emissions rules, rapid battery-cost deflation, and digitally enabled cockpit upgrades are steering demand toward electrified and connected vehicles. Automakers are a ccelerating platform consolidation to fund software and power-electronics roadmaps, while tier-1 suppliers expand vertically to secure semiconductors and critical-mineral feedstocks. Investor capital is tilting toward battery plants, silicon carbide fabrication, and advanced driver-assistance software, signaling confidence in long-run electrification payoffs. Meanwhile, capacity constraints in chips and cathode materials temper near-term production volumes yet reinforce pricing power for suppliers positioned at the top of the value chain.
Key Report Takeaways
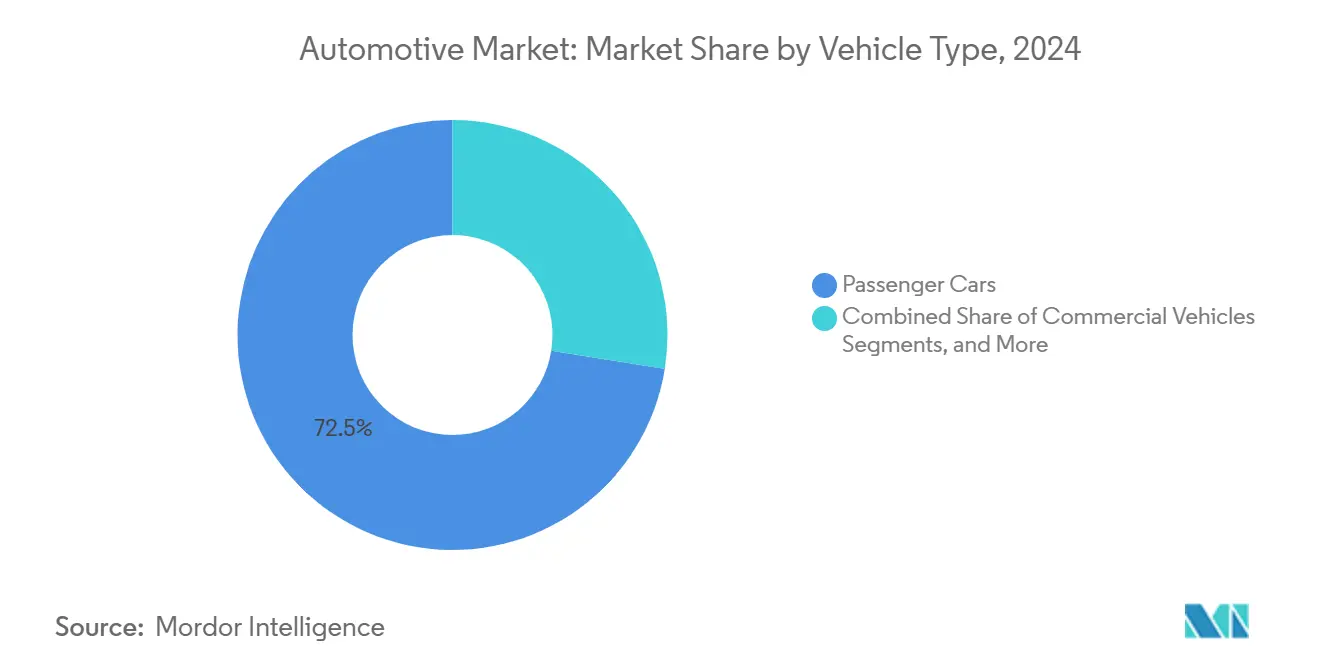
- By vehicle type, passenger cars led with 72.45% revenue share of the automotive market in 2024, while two-wheelers are forecast to expand at a 4.24% CAGR through 2030.
- By propulsion type, internal combustion engines held 85.13% of the automotive market size in 2024, while electric vehicles are advancing at a 6.85% CAGR through 2030.
- By application, personal use held 63.26% of the automotive market size in 2024, while public transport is advancing at a 5.11% CAGR through 2030.
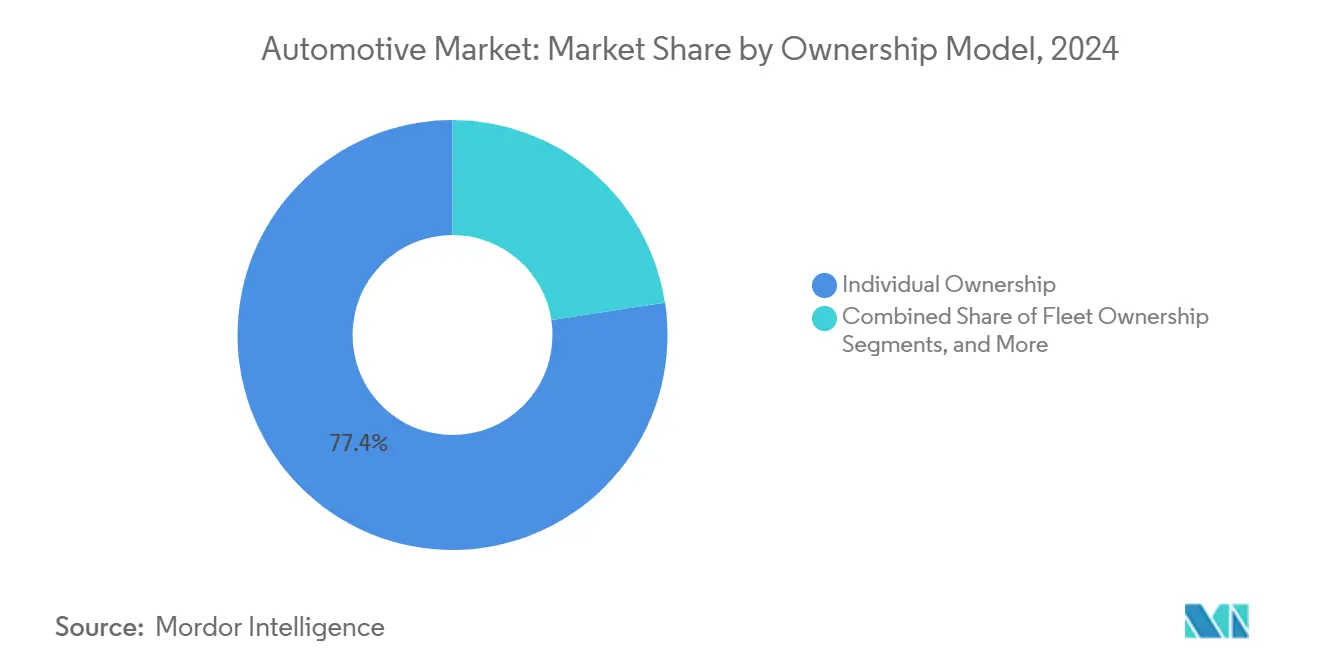
- By ownership model, individual ownership accounted for 77.35% of automotive market revenue in 2024, while subscription services are rising at a 5.84% CAGR to 2030.
- By sales channel, OEM dealers held 68.14% of the automotive market share in 2024, while online platforms are projected to grow at a 4.79% CAGR by 2030.
- By geography, Asia-Pacific captured a 53.11% share of the automotive market in 2024 and is growing at a 3.85% CAGR to 2030.
Global Automotive Market Trends and Insights
Drivers Impact Analysis*
| Driver | (~) % Impact on CAGR Forecast | Geographic Relevance | Impact Timeline |
|---|---|---|---|
| Rapid Electrification Momentum | +1.2% | Global, early gains in China, Europe, California | Medium term (2-4 years) |
| Urban Air-Quality Legislation | +0.9% | Global metros | Long term (≥ 4 years) |
| Digital Cockpit and Connected-Car Demand | +0.8% | North America, EU, Asia-Pacific core | Short term (≤ 2 years) |
| Supply-Chain On-Shoring Initiatives | +0.7% | North America, EU, Mexico, Eastern Europe | Long term (≥ 4 years) |
| Pay-Per-Use Ownership Models | +0.6% | North America, EU, spill-over to Asia-Pacific | Medium term (2-4 years) |
| Commercial-Grade Autonomy Adoption | +0.5% | North America, Europe | Long term (≥ 4 years) |
| Source: Mordor Intelligence | |||
Rapid Electrification Momentum
Global electric-vehicle sales were almost 14 million units in 2023, a 35% leap over 2022, and China supplied 60% of volume [1]International Energy Agency, “Global EV Outlook 2024,” iea.org. Fleet managers report under-three-year payback for light commercial EVs running fixed urban routes, accelerating purchase pipelines for courier, postal, and grocery segments. Capital markets favor pure-play EV firms, lowering the weighted-average cost of capital by 250 basis points relative to legacy peers. Incumbent brands redirect power-train budgets from combustion optimization to silicon-power modules, while cell manufacturers lock in offtake agreements that extend beyond 2030. These dynamics hard-wire an irreversible tilt toward electrification within the automotive market, compelling suppliers of anodes, cathode-active materials, and drive inverters to expand capacity aggressively.
Urban Air-Quality Legislation
Euro 7 tailpipe standards starting 2025 raise compliance cost per ICE vehicle by USD 1,400–1,900, closing the sticker-price gap against entry-level EVs [2]European Commission, “Euro 7 Regulation Explained,” ec.europa.eu. China’s National VI and India’s BS-VI frameworks impose parallel thresholds, while California mandates 100% zero-emission new-vehicle sales by 2035. Most global cities will implement zero-emission zones by 2027, restricting ICE access across core downtown districts. Municipal congestion-pricing pilots in London, Singapore, and Stockholm now offer discount tariffs for zero-emission plates, accelerating fleet rotation among ride-hail drivers. Regulators increasingly coordinate battery-recycling quotas with emissions policies, creating defensive moats for OEMs with end-of-life supply-chain integration. As regulations converge, the automotive market realigns capital expenditure toward battery, power electronics, and charging infrastructure, intensifying the strategic importance of clean propulsion.
Digital Cockpit and Connected-Car Demand
Semiconductor content per vehicle rose as artificial-intelligence voice assistants, augmented-reality head-up displays, and over-the-air upgrade pathways became mainstream. Automakers are launching software subscription bundles priced at USD 10–25 monthly, delivering incremental margins exceeding 40%, well above hardware averages. Digital cockpit ecosystems also feed anonymized telematics into predictive-maintenance algorithms, lowering warranty costs and enhancing customer retention. The revenue mix shift toward recurring software flows anchors higher lifetime value per vehicle, a vital cushion against shrinking ICE parts profit pools. These factors amplify unit economics for technology-forward models, lifting overall pricing power within the automotive market.
Supply-Chain On-Shoring Initiatives
The United States CHIPS and Science Act allocated fabrication incentives, prompting Intel, TSMC, and Samsung to add 300 mm lines aimed at automotive-grade microcontrollers. Volkswagen’s Tennessee battery facility targets 40 GWh capacity by 2025, which is enough cells for 500,000 midsize EVs each year. On-shoring curbs logistics exposure to the Red Sea and Taiwan Strait chokepoints, trimming lead times by two weeks and reducing working capital needs. Localized raw-material processing also satisfies rising environmental, social, and governance disclosure requirements from institutional investors. While multi-year build-out lags near-term demand, the strategy enhances long-run cost certainty and resilience for the automotive market.
Restraints Impact Analysis*
| Restraint | (~) % Impact on CAGR Forecast | Geographic Relevance | Impact Timeline |
|---|---|---|---|
| Critical-Mineral Supply Bottlenecks | -0.7% | Global, acute in battery chains | Long term (≥ 4 years) |
| Semiconductor Shortage Cyclicality | -0.5% | Global, Asia manufacturing hubs | Short term (≤ 2 years) |
| Legacy ICE Asset-Write-Down Risk | -0.4% | Europe, North America, Japan | Medium term (2-4 years) |
| Consumer ADAS Misuse Liability | -0.3% | North America, EU | Medium term (2-4 years) |
| Source: Mordor Intelligence | |||
Critical-Mineral Supply Bottlenecks
In 2024, lithium spot prices fluctuated, driven by persistent supply shortages and speculative stockpiling. The Democratic Republic of Congo's dominance in cobalt supply leaves OEMs vulnerable to sociopolitical upheavals and heightened ESG scrutiny. Environmental pushback in Indonesia and the Philippines is delaying nickel projects, extending payback periods, and driving up capital expenses. Automakers are turning to vertical integration to mitigate risks, as seen with Tesla's stake in a lithium refinery in Texas. However, it typically takes seven years for new supplies to transition from discovery to production. These challenges constrain the immediate rollout of electric vehicles (EVs), tempering growth in the broader automotive market.
Semiconductor Shortage Cyclicality
Taiwan, South Korea, and mainland China dominate the global supply of automotive-grade chips, posing a risk of disruption to vehicle assembly lines. The industry's reliance on just-in-time production faces challenges with fabrication lead times stretching from 12 to 26 weeks, resulting in occasional line stoppages. During capacity constraints, foundries tend to favor contracts from the higher-margin smartphone and data-center sectors, sidelining automakers in the allocation process. In response, original equipment manufacturers (OEMs) are now maintaining a buffer inventory equivalent to eight weeks of production and entering into long-term take-or-pay wafer contracts, heightening their working-capital demands. Until more diversified fabrication facilities become operational, the automotive market will grapple with the repercussions of chip supply volatility on its growth trajectory.
*Our forecasts treat driver/restraint impacts as directional, not additive. The impact forecasts reflect baseline growth, mix effects, and variable interactions.
Segment Analysis
By Vehicle Type: Passenger-Car Scale Meets Two-Wheeler Agility
Passenger cars generated 72.45 % of the automotive market revenue in 2024 within the automotive market size, underscoring their role as the default mobility in most regions. High saturation in Western economies tempers unit growth, yet rising middle-class purchasing power in Southeast Asia and Africa keeps the segment expanding modestly. Two-wheelers, despite lower ticket sizes, grow at a 4.24% CAGR thanks to densely populated Asian metros that value maneuverability and low running costs.
Consumer aspirations for personal mobility remain sticky, yet multi-modal transport ecosystems introduce competition from ride-hail, micro-mobility, and mass-transit upgrades. Delivery apps shift fleet mix toward cargo motorcycles, enhancing two-wheeler replacement cycles. Off-highway machinery anchors component supplier revenue with 6-year average replacement timelines. ICE dominance in heavy machinery persists because duty-cycle torque demands exceed current battery-energy densities. Over the forecast horizon, vehicle-type diversification sustains overall automotive market resilience.


By Propulsion Type: ICE Dominance Faces Electric Disruption
Internal combustion units retained 85.13% revenue share in 2024 across the automotive market size, reflecting a century of installed refueling infrastructure and cost amortization. Still, electric vehicles secure the fastest 6.85% CAGR on compelling total-cost-of-ownership economics and mounting policy mandates. Hybrids function as transitional technology, particularly in Japan and North America, where charge-point density lags urban demand. Fuel-cell electric vehicles stay niche amid hydrogen supply hurdles, yet pilots in heavy-duty freight suggest an opportunity for long-haul decarbonization.
Relative growth rates show EV penetration doubling between the 2019–2024 and 2025–2030 horizons as battery-cost curves steepen further. This swing reroutes supplier capital into permanent-magnet motors and wide-bandgap semiconductors, straining legacy gearbox and exhaust-system volumes.
By Application: Personal Use Dominates While Public Transport Accelerates
Personal-use vehicles accounted for a 63.26% share of the automotive market in 2024, mirroring cultural affinity for private transport in the United States, Germany, and Australia. Consumer teleworking reduced weekday commuting yet preserved weekend leisure travel, sustaining mileage per unit. Public-transport fleets post the highest 5.11% CAGR as municipalities electrify bus corridors to meet carbon-budget targets.
Commercial applications grow on surging direct-to-consumer logistics, with grocery and pharmacy chains dedicating fleet budgets to temperature-controlled vans. Industrial deployments such as mining haul trucks and agricultural tractors integrate hybrid drivelines where regenerative braking offsets high load factors. ISO 14001 adoption prompts corporate fleets to embed life-cycle emissions scoring into procurement, nudging demand toward battery-electric forklifts for warehouse operations. These diversified applications shield the automotive market from single-sector downturns.
By Ownership Model: Individual Holds Sway Amid Subscription Momentum
Individual possession maintained a 77.35% share of the automotive market in 2024, underscoring emotional attachments to ownership and the convenience of uncompromised availability. Suburban households prioritize utility for grocery runs and school trips, buffering demand against ride-hail substitution. Subscription services clock a 5.84% CAGR through 2030, accelerated by metro parking costs and remote-work flexibility.
Fleet ownership gains as parcel-delivery and municipal entities bulk-invest in electric vans that meet urban-access compliance and ESG disclosures. Shared mobility flattens due to pandemic-driven hygiene concerns but rebounds in 2024 on contactless payment and improved sanitization protocols. The ownership mosaic fragments conventional dealership profit pools and forces OEMs to build internal leasing entities to retain downstream revenue. These shifts require digital platforms for vehicle condition telemetry and predictive maintenance, embedding recurring software fees into the automotive market.
By Sales Channel: OEM Dealers Lead While Digital Gains Traction
OEM-affiliated showrooms captured 68.14% share of the automotive market in 2024, rooted in warranty servicing and financing brokerage that secures loyalty across the automotive market. Online platforms post a 4.79% CAGR as digital natives expect frictionless price transparency and doorstep delivery. Tesla’s direct-to-consumer blueprint validates margin scaling without franchise fees, prodding legacy OEMs to pilot factory-order portals with 10-day delivery promises.
Independent dealers focus on used vehicles and lower-credit buyers where underwriting expertise trumps brand power. Regulatory constraints in many United States regions still require point-of-sale dealer involvement, shaping hybrid click-and-collect models that merge e-commerce storefronts with local fulfillment centers. Meanwhile, emerging markets leverage WhatsApp commerce and QR-code payments for micro-dealer networks that reach peri-urban customers. The sales-channel evolution redistributes bargaining leverage across the automotive market, compelling cohesive omnichannel strategies.
Geography Analysis
Asia-Pacific retained 53.11% share of the automotive market in 2024, and is advancing at a 3.85% CAGR through 2030 as China deepens EV leadership, India scales compact-car volumes, and Southeast Asia urbanizes rapidly. India’s production-linked incentive scheme enhanced capex, catalyzing significant incremental jobs and widening small-car affordability. Japanese and South Korean automakers propel regional export surpluses yet face aging domestic demographics that cap home-market unit growth.
North America rebounded in light-vehicle sales in 2024 after chip shortages eased, supported by pent-up fleet replacement and federal EV tax credits that trim USD 7,500 from purchase prices. California’s mandate for 100% zero-emission sales by 2035 nudges OEM portfolio realignment, while Canada’s ZEV standard sets a 20% minimum share by 2026. The United States added public fast chargers, narrowing range-anxiety barriers. Europe contends with energy-price volatility yet advances electrification through Euro 7 limits and congestion-pricing rebates.
South America, the Middle East, and Africa contribute comparatively lower global shares but register outsized potential as income levels climb and infrastructure matures. Brazil produced 2.5 million vehicles in 2024 under a flexible-fuel framework, while Mexico exported 3.6 million units to North America, leveraging USMCA rules of origin [3]Associação Nacional dos Fabricantes de Veículos Automotores, “Brazil Production Statistics 2024,” anfavea.com. Gulf Cooperation Council states accelerate EV imports backed by carbon-neutral tourism pledges, installing more chargers across the United Arab Emirates by 2025. Africa witnesses modest yet rising assembly activity, buoyed by the African Continental Free Trade Agreement and localized CKD operations in Kenya, Nigeria, and Ghana. Infrastructure deficits and price sensitivity temper volume, but demographic tailwinds secure long-term relevance for the automotive market.
Mordor Intelligence provides coverage of the automotive market across other key regional markets. Detailed country-level analysis extends to Oman incorporating local coverage and market participation, as required.

Competitive Landscape
The automotive market exhibits moderate concentration, as disruptive entrants erode incumbent moats. Toyota, Volkswagen, and General Motors remain volume leaders, but Chinese contenders BYD, Geely, and SAIC unlock global share by exporting small crossovers with sub-USD 25,000 sticker prices. Software alliances flourish as Hyundai pairs with NVIDIA for Level-3 driving stacks, and Ford licenses Tesla Supercharger access, dissolving proprietary barriers.
Battery manufacturers CATL and LG Energy Solution deepen co-location footprints with OEMs, locking in 10-year supply deals that hedge raw-material volatility.
Competitive advantage migrates toward software cadence, cell-chemistry optionality, and circular-economy loops. Market newcomers leverage over-the-air update infrastructure to widen functional spread post-purchase, generating lifetime revenue beyond sticker price. Incumbents counter by spinning off EV sub-brands that inherit agile development norms yet exploit global manufacturing scale. Private-label battery-swap services and in-car e-commerce stores broaden after-sales monetization. The net effect is a dynamic landscape where balance-sheet heft intersects with digital prowess to define winners across the automotive market.
Automotive Industry Leaders
Toyota Motor Corporation
Volkswagen AG
Hyundai Motor Company
General Motors Company
Stellantis N.V.
- *Disclaimer: Major Players sorted in no particular order


Recent Industry Developments
- September 2025: BMW scheduled the global debut of the Neue Klasse-based iX3, featuring 30% faster charging and solid-state-ready battery architecture.
- June 2025: VinFast inaugurated its second plant in Vietnam, significantly increasing its production capacity by 200,000 units annually. This expansion addresses the rising demand for compact electric vehicles (EVs) in domestic and international markets. The new facility is expected to enhance the company's ability to compete in the growing EV market while supporting its long-term growth strategy.
- November 2024: Volkswagen invested USD 5.8 billion in Rivian in a strategic partnership to co-develop next-generation electric vehicle (EV) platforms. This collaboration aims to leverage the strengths of both companies, combining Volkswagen's expertise in automotive manufacturing with Rivian's innovative EV technologies to accelerate advancements in the EV market.


Global Automotive Market Report Scope
| Two-Wheeler |
| Three-Wheeler |
| Passenger Cars |
| Commercial Vehicles |
| Off-Highway Vehicles |
| Internal Combustion Engine |
| Hybrid Vehicle |
| Electric Vehicle |
| Personal |
| Commercial |
| Public Transport |
| Industrial Use |
| Individual Ownership |
| Fleet Ownership |
| Subscription-Based |
| Shared Mobility |
| OEM Dealers |
| Independent Dealers |
| Online Platforms |
| Direct-to-Consumer |
| North America | United States |
| Canada | |
| Rest of North America | |
| South America | Brazil |
| Argentina | |
| Rest of South America | |
| Europe | United Kingdom |
| Germany | |
| Spain | |
| Italy | |
| France | |
| Russia | |
| Rest of Europe | |
| Asia-Pacific | India |
| China | |
| Japan | |
| South Korea | |
| Rest of Asia-Pacific | |
| Middle East and Africa | United Arab Emirates |
| Saudi Arabia | |
| Turkey | |
| Egypt | |
| South Africa | |
| Rest of Middle East and Africa |
| By Vehicle Type | Two-Wheeler | |
| Three-Wheeler | ||
| Passenger Cars | ||
| Commercial Vehicles | ||
| Off-Highway Vehicles | ||
| By Propulsion Type | Internal Combustion Engine | |
| Hybrid Vehicle | ||
| Electric Vehicle | ||
| By Application | Personal | |
| Commercial | ||
| Public Transport | ||
| Industrial Use | ||
| By Ownership Model | Individual Ownership | |
| Fleet Ownership | ||
| Subscription-Based | ||
| Shared Mobility | ||
| By Sales Channel | OEM Dealers | |
| Independent Dealers | ||
| Online Platforms | ||
| Direct-to-Consumer | ||
| By Geography | North America | United States |
| Canada | ||
| Rest of North America | ||
| South America | Brazil | |
| Argentina | ||
| Rest of South America | ||
| Europe | United Kingdom | |
| Germany | ||
| Spain | ||
| Italy | ||
| France | ||
| Russia | ||
| Rest of Europe | ||
| Asia-Pacific | India | |
| China | ||
| Japan | ||
| South Korea | ||
| Rest of Asia-Pacific | ||
| Middle East and Africa | United Arab Emirates | |
| Saudi Arabia | ||
| Turkey | ||
| Egypt | ||
| South Africa | ||
| Rest of Middle East and Africa | ||


Key Questions Answered in the Report
How large is the automotive market in 2025 and what is its expected growth?
The automotive market size stood at USD 2.75 trillion in 2025 and is forecast to reach USD 3.26 trillion by 2030, reflecting a 3.46% CAGR.
Which region leads global vehicle sales today?
Asia-Pacific dominates with 53.11% share in 2024 and shows the fastest 3.85% CAGR through 2030.
Which ownership model is expanding the fastest?
Subscription-based access is advancing at a 5.84% CAGR, driven by urban consumers seeking flexibility without long-term financing commitments.
How are automakers tackling semiconductor shortages?
OEMs are signing long-term wafer agreements, building buffer inventories, and supporting U.S. CHIPS Act fabs to diversify supply away from single-region dependencies.
Page last updated on:


