Connected Vehicle Market Size and Share
Market Overview
| Study Period | 2019 - 2031 |
|---|---|
| Market Size (2026) | USD 86.13 Billion |
| Market Size (2031) | USD 149.56 Billion |
| Growth Rate (2026 - 2031) | 11.67% CAGR |
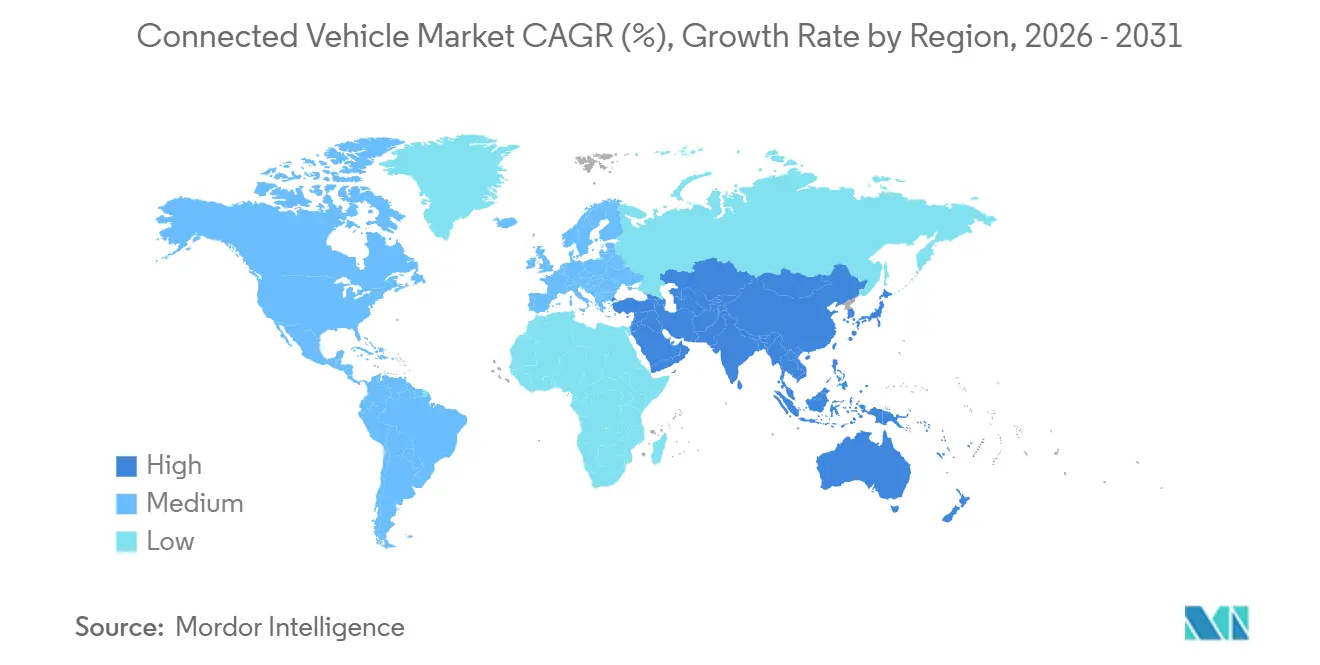
| Fastest Growing Market | Asia Pacific |
| Largest Market | Europe |
| Market Concentration | Medium |
Major Players *Disclaimer: Major Players sorted in no particular order Image © Mordor Intelligence. Reuse requires attribution under CC BY 4.0. | |
Connected Vehicle Market Analysis by Mordor Intelligence
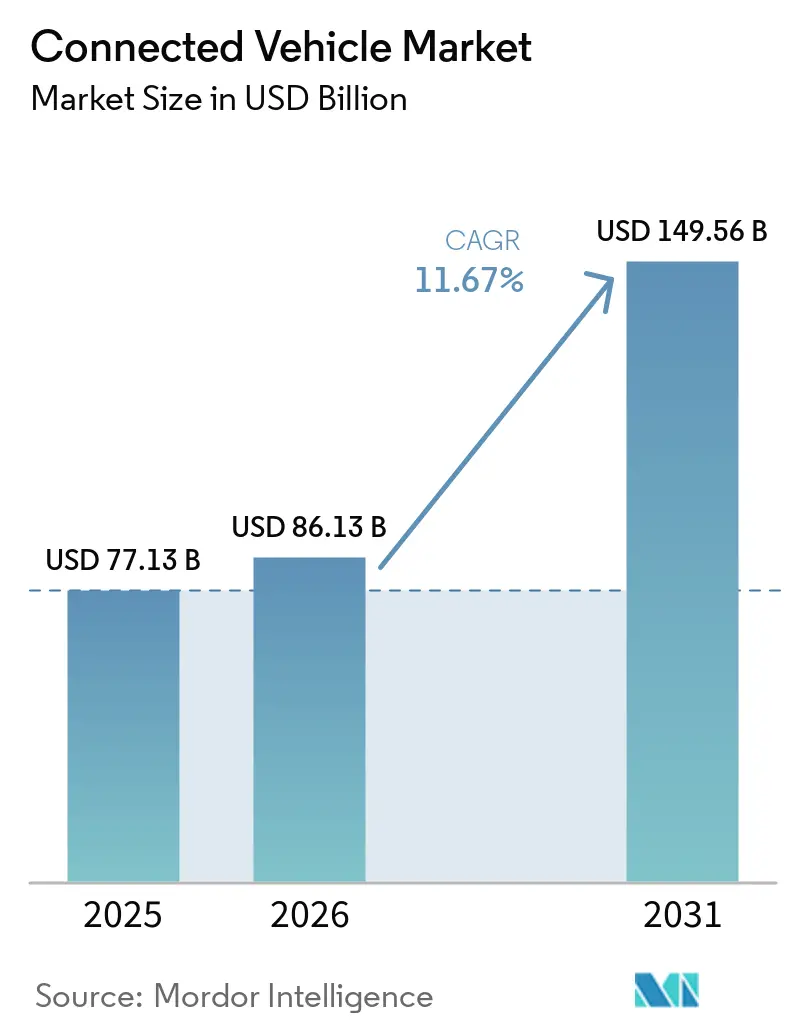
The connected vehicle market size is expected to grow from USD 77.13 billion in 2025 to USD 86.13 billion in 2026 and is forecast to reach USD 149.56 billion by 2031 at an 11.67% CAGR over 2026–2031. Automakers are overhauling business models, monetizing over-the-air features, and forging usage-based-insurance alliances that reward safe driving and generate recurring revenue. Spectrum clarity in the United States and Europe now supports large roadside-unit rollouts, while cellular carriers and tier-1 suppliers race to integrate 4G and 5G modems into zonal vehicle architectures. Cybersecurity mandates, notably UNECE WP.29, are raising the bar for embedded defenses, pushing OEMs toward single-vendor stacks that blend connectivity, compute, and threat detection. Meanwhile, public funding for smart-infrastructure projects in China, the EU, and the United States is lowering deployment risk for V2X applications and anchoring long-term demand for high-bandwidth telematics.
Key Report Takeaways
- By technology type, 4G/LTE led with 43.47% of connected vehicle market share in 2025, while 5G/C-V2X is projected to grow at an 11.69% CAGR to 2031.
- By application, safety and security held 38.13% of the connected vehicle market size in 2025, and over-the-air updates are advancing at an 11.77% CAGR through 2031.
- By connectivity, integrated solutions accounted for a 45.52% slice of the connected vehicle market size in 2025, yet embedded architectures are expanding at an 11.79% CAGR.
- By vehicle connectivity, vehicle-to-vehicle dominated with 48.81% of the connected vehicle market share in 2025, while vehicle-to-grid is forecast to accelerate at an 11.84% CAGR.
- By vehicle type, passenger cars captured 73.34% of the connected vehicle market share in 2025, and they also posted the fastest adoption, growing at an 11.72% CAGR to 2031.
- By end market, OEM-fitted systems held 87.13% of the connected vehicle market size in 2025 and continue to rise at an 11.81% CAGR, marginalizing aftermarket retrofits.
- By geography, Europe commanded 34.57% of connected vehicle market share in 2025, whereas Asia Pacific is the quickest climber with an 11.75% CAGR through 2031.
Note: Market size and forecast figures in this report are generated using Mordor Intelligence’s proprietary estimation framework, updated with the latest available data and insights as of January 2026.
Global Connected Vehicle Market Trends and Insights
Drivers Impact Analysis*
| Driver | (~) % Impact on CAGR Forecast | Geographic Relevance | Impact Timeline |
|---|---|---|---|
| Global 5G Roll-Outs Enabling High-Bandwidth V2X Services | +2.8% | Global, led by China, South Korea, United States, Germany | Medium term (2-4 years) |
| Regulatory Mandates for Ecall & Safety Telematics | +2.3% | Europe, Russia, India, with spillover to Brazil and ASEAN | Short term (≤ 2 years) |
| Smart-Infrastructure Funding | +2.1% | United States (IIJA corridors), EU (C-Roads), China (New Infrastructure) | Long term (≥ 4 years) |
| Consumer Demand for In-Car Infotainment & Connectivity | +1.9% | North America, Europe, urban Asia Pacific | Medium term (2-4 years) |
| EV-Centric Software-Defined Vehicle Architectures | +1.7% | Global, concentrated in premium and electric-vehicle segments | Medium term (2-4 years) |
| Insurance-OEM Usage-Based-Insurance Partnerships | +0.9% | North America, United Kingdom, Italy, with pilots in Japan | Short term (≤ 2 years) |
| Source: Mordor Intelligence | |||


Global 5G Roll-Outs Enabling High-Bandwidth V2X Services
Since 2024, the 3GPP Release 16 sidelink feature has enabled direct vehicle-to-vehicle messaging with extremely low latency. By the end of 2025, China, with a significant number of active 5G base stations, will lead the charge, with many stations facilitating C-V2X roadside functions [1]“5G Base-Station Statistics 2025,” Ministry of Industry and Information Technology, miit.gov.cn . In a bid to enhance pedestrian safety, South Korea allocated substantial funding in 2025 to upgrade numerous intersections with low-latency V2X technology. Meanwhile, in the U.S., the Federal Highway Administration underscored its commitment to digitizing freight corridors by adding several roadside units along a major interstate in 2025 [2]“Accelerated Innovation Deployment Projects,” Federal Highway Administration, fhwa.dot.gov . Due to these advancements, vehicles can now benefit from over-the-air firmware updates, high-definition mapping, and timely hazard alerts.
Regulatory Mandates For eCall & Safety Telematics
European Commission Delegated Regulation 2024/1180, effective January 2025, compels all new light vehicles to migrate from circuit-switched eCall to packet-switched IMS networks, forcing the replacement of 2G and 3G modems with 4G or 5G chipsets [3]“Delegated Regulation 2024/1180,” European Commission, ec.europa.eu . India’s AIS-140 Amendment 3 extends real-time tracking and panic-button requirements to passenger cars by April 2026, deepening compliance demand. Russia’s ERA-GLONASS upgrade added LTE positioning in 2024, further solidifying the regulatory floor. These rules guarantee baseline connectivity but also raise engineering costs, since UNECE WP.29 Regulation 155 mandates a certified cyber-security management system before type approval. Smaller OEMs must now partner with tier-1 suppliers that already hold ISO/SAE 21434 certification to stay competitive.
Smart-Infrastructure Funding In United States, European Union, And China
In recent years, the United States, under its Infrastructure Investment and Jobs Act, allocated significant funds for smart corridors, approving multiple C-V2X pilots across key states such as Michigan, Ohio, and Texas. The European Union, through its Connecting Europe Facility, committed substantial financial resources for digital transport projects, facilitating cross-border C-Roads services. China's National Development and Reform Commission, recognizing intelligent transport as a cornerstone of its "New Infrastructure" initiative, is channeling a considerable amount of investment into V2X over a multi-year period. Such public investments are bridging the chicken-and-egg dilemma for roadside equipment, hastening both service rollout and user adoption.
Consumer Demand for In-Car Infotainment & Connectivity
Car buyers now demand seamless smartphone mirroring, uninterrupted streaming, and ongoing feature upgrades. In recent years, Samsung’s HARMAN division has significantly increased shipments of digital cockpit units with embedded 5G modems, highlighting OEMs' growing preference for unified infotainment and connectivity solutions. Tesla has consistently delivered multiple comprehensive software updates annually, bolstering the notion that cars should evolve akin to smartphones. Despite the looming threat of subscription fatigue, OEMs are countering by bundling data plans with lease payments or insurance premiums, ensuring sustained user engagement and tapping into post-sale revenue streams.
Restraints Impact Analysis*
| Restraint | (~) % Impact on CAGR Forecast | Geographic Relevance | Impact Timeline |
|---|---|---|---|
| Cyber-Security & Data-Privacy Vulnerabilities | -1.4% | Global, acute in Europe (GDPR) and California (CCPA) | Short term (≤ 2 years) |
| High Cellular Data Costs and OEM-MNO Revenue Conflicts | -1.1% | North America, Europe, select Asia Pacific markets | Medium term (2-4 years) |
| Semiconductor Modem Shortages | -0.8% | Global, supply concentrated in Taiwan and South Korea | Short term (≤ 2 years) |
| DSRC vs. C-V2X Spectrum Uncertainty | -0.6% | United States (resolved 2024), Japan (ongoing debate) | Short term (≤ 2 years) |
| Source: Mordor Intelligence | |||
Cyber-Security & Data-Privacy Vulnerabilities
In recent times, the European Union Agency for Cybersecurity reported several exploits targeting connected-vehicle gateways. These included remote unlock and immobilizer attacks affecting multiple vehicle models. While ISO/SAE 21434 provides a framework for processes, a TÜV SÜD audit revealed that a significant portion of tier-2 suppliers were not fully compliant, highlighting potential vulnerabilities. The General Data Protection Regulation (GDPR) imposes substantial fines, acting as a deterrent against aggressive data monetization. Meanwhile, the California Consumer Privacy Act empowers drivers to request the deletion of their trip records, adding complexity to usage-based insurance models. In response, Original Equipment Manufacturers (OEMs) are implementing hardware root-of-trust modules and end-to-end encryption. However, the weight of compliance is delaying the rollout of new features and redirecting R&D budgets towards defensive engineering measures.
High Cellular Data Costs And OEM–MNO Revenue Conflicts
Connected cars, relying on maps, diagnostics, and streaming, consume a significant amount of data monthly. Yet, in numerous markets, wholesale 5G data prices remain relatively high. While OEMs lean towards bundling connectivity into the vehicle's price, carriers are pushing for direct contracts with drivers. Their argument? OEMs are missing the essential roaming and billing infrastructure. In 2024, disputes over data-plan terms led to a prolonged stall for FordPass Connect in Europe, as negotiations unfolded with Vodafone. Looking ahead, the European Commission's upcoming consultation on equitable in-vehicle data access could mandate OEMs to allow consumers to choose their carriers. This potential shift not only complicates integration but could also dampen service uptake.
*Our forecasts treat driver/restraint impacts as directional, not additive. The impact forecasts reflect baseline growth, mix effects, and variable interactions.
Segment Analysis
By Technology Type: 5G Transition Reshapes Modem Economics
The 4G/LTE segment maintained a 43.47% slice of the connected vehicle market size in 2025, benefiting from mature component pricing and global network coverage. However, 5G/C-V2X units are scaling fast with an 11.69% CAGR through 2031 as OEMs chase latency improvements vital for autonomous driving and advanced driver assistance. Qualcomm’s Snapdragon X85, announced in 2025, integrates sidelink and millimeter-wave radios on a 4-nanometer node, cutting power draw by a minimal amount and reducing bill-of-materials by USD 35 relative to earlier discrete designs. Legacy 3G and 2G devices are being sunset, aligning with U.S. and EU shutdown schedules that make continued operation unsustainable.
Premium passenger cars adopt 5G twice as often as light commercial vehicles, but freight operators still favor robust 4G chipsets paired with electronic logging devices. China’s mandate for LTE-V2X in new-energy vehicles keeps 4G volumes high, while Europe leans straight into 5G NR-V2X. Dual-mode silicon that supports Release 14 sidelink and Release 17 positioning now adds only USD 15, down from USD 50 in 2023, helping global platforms standardize across regions. As economies of scale build, the connected vehicle market expects 5G modems to overtake 4G share before 2028, reshaping supply chains and semiconductor roadmaps.


By Application: OTA Updates Capture Software Monetization
Safety and security services held 38.13% of the connected vehicle market size in 2025 as regulatory eCall mandates locked in baseline demand. Over-the-air updates post the quickest climb at an 11.77% CAGR, reflecting the move to software-defined vehicles capable of receiving multi-gigabyte firmware packages. Tesla’s fleet alone uploaded more than 4 petabytes of sensor data in 2025, enabling cloud training and rapid feature releases. Driver assistance merges with V2X feeds, as BMW’s Highway Assistant now factors real-time work-zone data streamed from roadside units into adaptive speed profiles.
Infotainment and human–machine interface functions are commoditizing under Apple CarPlay and Android Auto dominance, compressing OEM differentiation. Mobility and fleet-management applications consolidate around scaled providers that optimize routing, compliance, and maintenance for millions of commercial vehicles. Meanwhile, telematics and diagnostics shift from aftermarket dongles to factory-installed gateways that stream health data to cloud analytics, cutting unscheduled service visits. Traditional application silos blur as a single update can address security, driveability, and entertainment in one payload, underscoring the growing importance of unified software pipelines.
By Connectivity: Embedded Gains On Cyber-Security Imperatives
Integrated head-unit designs represented 45.52% of the connected vehicle market size in 2025 because they merge infotainment and telematics to save components. Yet embedded stand-alone gateways are rising at an 11.79% CAGR as ISO/SAE 21434 risk assessments favor physical separation between safety-critical buses and public networks. Continental’s 5G Hybrid V2X module houses its modem in a hardened enclosure with a hardware firewall, limiting lateral movement if an attacker breaches the cellular stack.
Tethered architectures reliant on smartphone hotspots are waning as patchy connections delay firmware push campaigns. OEM-fitted programs leverage embedded hardware to negotiate decade-long wholesale data contracts, trimming bandwidth cost and cementing direct consumer relationships. Regional patterns diverge; North America and Europe adopt embedded systems to comply with stringent privacy rules, while cost-sensitive Chinese volume brands still prefer integrated units that cut antenna count. Aftermarket tethered dongles linger in heavy-vehicle fleets yet face obsolescence as regulators block uncertified devices from writing to in-vehicle networks.
By Vehicle Connectivity: V2G Unlocks Grid-Services Revenue
Vehicle-to-vehicle communication captured 48.81% of the connected vehicle market share in 2025, leveraging Release 14 sidelink to broadcast speed and heading ten times per second within a 300-meter radius. Utility operators now eye vehicle-to-grid, the fastest segment at an 11.84% CAGR, because bidirectional charging stabilizes renewable-heavy grids. ISO 15118-20 enables plug-and-charge sessions in which a Ford F-150 Lightning owner can automatically sign a demand-response contract and earn USD 800 a year by feeding excess energy back to the network.
Vehicle-to-infrastructure use grows in China’s smart corridors, where more than 1,200 intersections transmit signal-phase-and-timing messages, cutting commute times. Vehicle-to-pedestrian pilots in Japan push collision alerts to smartphones carried by cyclists and schoolchildren. Collectively, these modes require rigorous interoperability so that a car crossing from Germany to France can shift from ETSI ITS-G5 to 3GPP C-V2X without packet loss. The trend pushes OEMs toward modular telematics capable of firmware-level protocol swaps delivered over the air.
By Vehicle Type: Commercial Fleets Drive Adoption Velocity
Passenger cars delivered 73.34% of the connected vehicle market share in 2025 and continue to climb at 11.72% CAGR on the back of consumer infotainment demand and regulatory mandates. Light commercial vehicles post similar growth as e-commerce giants rely on real-time telematics to shave delivery costs and track battery health. Medium and heavy trucks integrate connectivity to satisfy electronic logging device rules, streamline preventive maintenance, and improve route compliance.
Electric powertrains intensify data needs because battery management hinges on continuous cloud analytics. Amazon’s Rivian delivery fleet reported a significant drop in per-package cost after enabling dynamic routing, illustrating how connectivity pays off in logistics. Geographies diverge: Europe’s eCall covers vehicles under 3.5 tons, leaving heavy rigs to adopt telematics voluntarily, whereas China mandates Beidou-linked cellular modules for all new commercial vehicles. Autonomous shuttle pilots in Singapore and Dubai further showcase how unwavering connectivity underpins higher levels of automation.

By End Market: OEM Integration Marginalizes Aftermarket
OEM-fitted solutions owned 87.13% of the connected vehicle market size in 2025 and expanded at an 11.81% CAGR as automakers seek lifetime customer relationships fueled by data services. Factory gateways access proprietary CAN messages and enable secure over-the-air updates, giving OEM programs like General Motors’ OnStar a feature set that aftermarket plugins cannot match.
Aftermarket devices still serve older commercial fleets that need compliance-oriented logging and basic tracking. Yet carrier shutdown schedules and rising cybersecurity rules threaten these plug-in models. Regional economics shape adoption; North America and Europe lean toward OEM because data privacy legislation discourages third-party gateways, while cost-conscious consumers in parts of South America still retrofit older cars. Overall, the connected vehicle market tilts decisively toward embedded, factory-installed hardware that the automaker controls from cradle to grave.
Geography Analysis
Europe dominated with 34.57% of the connected vehicle market share in 2025. This surge was driven by the eCall packet-switched migration deadlines and the deployment of numerous C-Roads roadside units. These units stream hazard alerts across Germany, Austria, and the Netherlands. Germany boasts the highest density with a significant number of active units along its Autobahn corridors. In contrast, the United Kingdom faces delays, grappling with post-Brexit regulatory differences. Southern European nations are adopting at a slower pace, hindered by consumer resistance to subscription fees.
Asia Pacific posts the fastest 11.75% CAGR through 2031 as China mandates LTE-V2X on new-energy vehicles and channels into V2X infrastructure across Wuxi, Changsha, and Chongqing. Wuxi’s 1,200 roadside units cut intersection accidents in 2025, proving safety dividends. Japan and South Korea fund urban V2X pilots that retrofit hundreds of intersections, while India’s AIS-140 Amendment 3 extends real-time tracking to passenger cars by 2026, adding a compliance driver.

Competitive Landscape
As semiconductor firms, top-tier integrators, and carriers increasingly converge, competition heats up. In a move set for the near future, Qualcomm, in collaboration with BMW, is set to unveil its Snapdragon Ride Pilot. This innovation melds 5G modems with autonomous computing, offering turnkey Level 3 capabilities. This bold step puts pressure on rivals NXP and Infineon to elevate their integration game. Meanwhile, Continental's 5G Hybrid V2X consolidates modem, GNSS, and firewall functionalities into a single module, streamlining the OEM's time-to-market. Tesla, however, carves its own path, fully owning its over-the-air stack and withholding data. This strategy not only positions Tesla to capitalize on software monetization but also distances it from potential ecosystem collaborations.
Chinese chip manufacturers, led by Huawei's HiSilicon, leverage the Kirin 990A to undercut competitors on pricing. Yet, stringent export controls hinder their access to advanced nodes, limiting performance enhancements in high-end vehicles. Mobile network giants, such as AT&T, which now cater to a significant number of connected cars, are broadening their horizons. They are delving into analytics, forecasting battery failures, and orchestrating firmware updates, encroaching on territory traditionally dominated by OEM telematics.
Certification emerges as a pivotal pricing strategy. Suppliers adept at securing ISO/SAE 21434 and UNECE WP.29 compliance can command notable premiums, due to their ability to expedite OEM homologation cycles. Patent holdings play a crucial role too: Qualcomm's portfolio boasts a substantial number of granted C-V2X patents, paving the way for consistent licensing revenues that extend well beyond mere silicon sales.
Connected Vehicle Industry Leaders
Continental AG
Robert Bosch GmbH
Qualcomm Technologies Inc.
Harman International (Samsung)
Visteon Corporation
- *Disclaimer: Major Players sorted in no particular order


Recent Industry Developments
- December 2025: Tata Motors previewed the Sierra with 5G-ready architecture and over-the-air update capability, while Tesla began distributing its Full Self-Driving (Supervised) software to global fleets.
- June 2025: Oppo licensed its 5G cellular patents to Volkswagen, and LG Innotek unveiled an automotive 5G module that incorporates satellite fallback for rural coverage.
- July 2024: HARMAN and CARIAD have significantly expanded the Volkswagen Group's in-vehicle app store, now offering a broad selection of applications. This expansion aims to provide a more comprehensive and enriched experience for users, catering to various needs such as entertainment, navigation, and vehicle management. By integrating a wide array of apps, the collaboration seeks to enhance convenience, connectivity, and overall satisfaction for drivers and passengers alike.


Research Methodology Framework and Report Scope
Market Definitions and Key Coverage
Our study defines the connected vehicle market as all factory-built passenger and commercial vehicles that communicate bi-directionally with external networks through embedded, integrated, or tethered solutions covering V2X, telematics, infotainment, diagnostics, mobility, and over-the-air update services.
Scope exclusion: Pure aftermarket dongles and stand-alone navigation devices are outside the definition.
Segmentation Overview
- By Technology Type
- 5G / C-V2X
- 4G / LTE
- 3G
- 2G
- By Application
- Driver Assistance (ADAS)
- Safety and Security
- Telematics & Diagnostics
- Infotainment & HMI
- Mobility & Fleet Management
- Over-the-Air (OTA) Updates
- By Connectivity
- Integrated
- Embedded
- Tethered
- By Vehicle Connectivity
- Vehicle-to-Vehicle (V2V)
- Vehicle-to-Infrastructure (V2I)
- Vehicle-to-Pedestrian (V2P)
- Vehicle-to-Cloud (V2C)
- Vehicle-to-Grid (V2G)
- By Vehicle Type
- Passenger Cars
- Light Commercial Vehicles
- Medium and Heavy Commercial Vehicles
- By End Market
- OEM-Fitted
- Aftermarket
- By Geography
- North America
- United States
- Canada
- Rest of North America
- South America
- Brazil
- Argentina
- Rest of South America
- Europe
- Germany
- United Kingdom
- France
- Italy
- Spain
- Rest of Europe
- Asia Pacific
- China
- India
- Japan
- South Korea
- Rest of Asia Pacific
- Middle East and Africa
- United Arab Emirates
- Saudi Arabia
- South Africa
- Turkey
- Rest of Middle East and Africa
- North America
Detailed Research Methodology and Data Validation
Primary Research
Mordor analysts interviewed automakers, Tier-1 module suppliers, mobile network operators, and policy experts across North America, Europe, and Asia-Pacific. Conversations validated assumed telematics attach rates, region-specific ASP progressions, regulatory timing, and 5G-C-V2X roll-out milestones, closing gaps left by public data.
Desk Research
We started with traffic-worthy datasets from regulators such as the NHTSA, UNECE WP.29, and EU eCall registers, then layered statistics from ACEA production books, ITU 4G/5G penetration series, OICA vehicle stock data, and GSMA V2X deployment trackers. Annual reports and 10-Ks helped us capture model launches, connectivity take rates, and average selling prices, while Dow Jones Factiva and D&B Hoovers supplied supplemental company intelligence. These sources illustrate our foundation; many additional open and paid references supported fact-checks and clarification.
Market-Sizing & Forecasting
A top-down build began with 2024 light and heavy vehicle production, country-level connectivity penetration, and weighted ASPs; results were then sense checked through selective bottom-up roll-ups of supplier shipments and sampled OEM channel checks. Key variables include mandated eCall fitment timelines, 5G base-station density, EV sales mix (which skews toward higher connectivity), cyber-security regulation lead times, and average data-plan cost trajectories. Multivariate regression on those drivers projects demand to 2030, while scenario analysis adjusts for chipset shortages or delayed legislation. Any bottom-up shortfalls are filled by calibrated elasticity factors benchmarked from prior telematics waves.
Data Validation & Update Cycle
Outputs pass a three-layer review: automated anomaly scans, analyst peer review, and final senior sign-off. We refresh every twelve months, with interim updates triggered by material events such as spectrum rulings, mega-recalls, or >10% swings in quarterly shipments, ensuring buyers receive our latest vetted numbers.
Why Mordor's Connected Vehicle Baseline Earns Trust
Published estimates often vary because firms choose different service baskets, pricing ladders, and refresh cadences. Our disciplined scope selection and driver-level modeling keep estimates reproducible and transparent.
Key gap drivers are usually the inclusion of aftermarket dongles, divergent ASP assumptions for 5G modules, or the treatment of commercial fleets. Some publishers extrapolate from pilot programs without validating uptake, while others apply uniform global pricing. Mordor's model, anchored in verified fitment rates and region-specific price curves, avoids such skews.
Benchmark comparison
| Market Size | Anonymized source | Primary gap driver |
|---|---|---|
| USD 87.32 B (2025) | Mordor Intelligence | - |
| USD 98.39 B (2024) | Global Consultancy A | Includes aftermarket devices and bundles data-service revenue directly into hardware value |
| USD 14.49 B (2025) | Industry Journal B | Counts only embedded telematics control units, excludes integrated and tethered solutions |
In sum, by grounding every step in observable production, regulation, and technology adoption metrics, Mordor Intelligence delivers a balanced, decision-ready baseline stakeholders can replicate and trust.


Key Questions Answered in the Report
What is the 2026 value of the connected vehicle market?
The connected vehicle market is valued at USD 86.13 billion in 2026 and is projected to expand to USD 149.56 billion by 2031, growing at a CAGR of 11.67% over the forecast period (2026-2031).
Which region leads adoption of vehicle-to-infrastructure services?
Europe leads thanks to 1,200 C-Roads roadside units and strict eCall and cyber-security mandates that encourage continuous investment in V2X corridors.
How fast is Asia Pacific expanding in connected vehicles?
Asia Pacific posts the fastest 11.75% CAGR through 2031, propelled by China’s LTE-V2X mandate and large public spending on smart-transport projects.
Why are embedded telematics growing faster than integrated units?
ISO/SAE 21434 and UNECE WP.29 cyber-security rules favor stand-alone gateways that isolate safety-critical networks, pushing OEMs toward embedded designs that grow at an 11.79% CAGR.
What business model dominates connected vehicle deployments?
OEM-fitted systems account for 87.13% of 2025 deployments, giving automakers end-to-end control over hardware, software, and post-sale data services.
How does 5G improve connected vehicle capabilities?
5G enables sub-20 millisecond sidelink communication and high-bandwidth firmware streaming, supporting advanced driver assistance and bidirectional charging services that 4G cannot reliably sustain.
Page last updated on:


