Market Overview
| Study Period | 2020 - 2031 |
|---|---|
| Forecast Data Period | 2026 - 2031 |
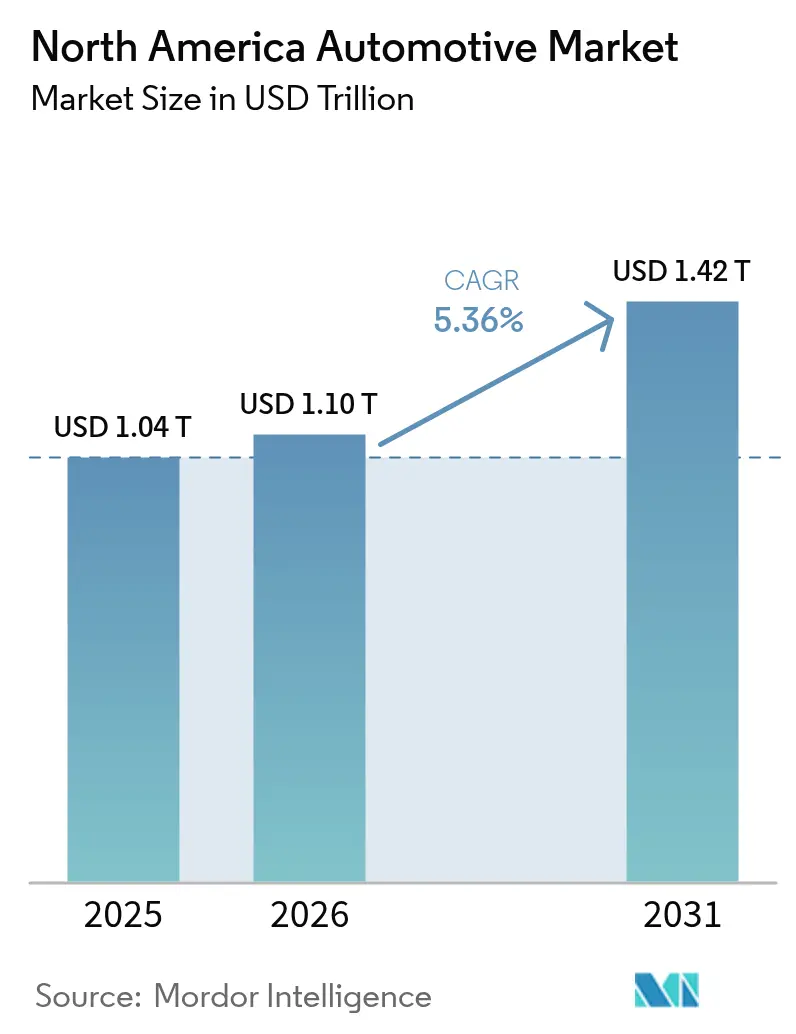
| Base Year Market Size (2025) | USD 1040 Trillion |
| Market Size (2026) | USD 1.1 Trillion |
| Market Size (2031) | USD 1.42 Trillion |
| Growth Rate (2026 - 2031) | 5.36% CAGR |
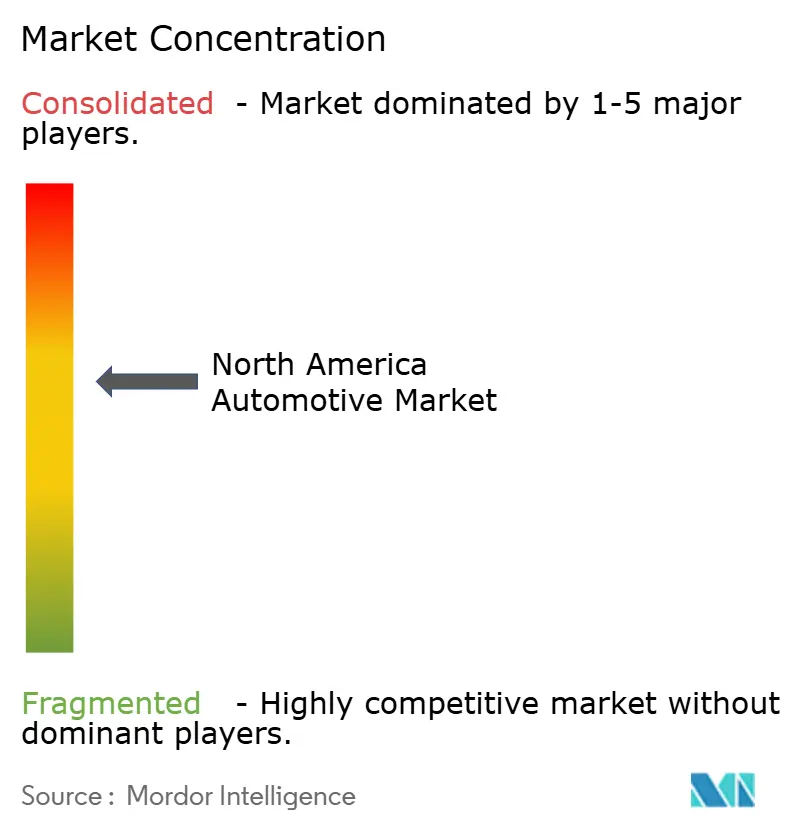
| Market Concentration | Medium |
Major Players *Disclaimer: Major Players sorted in no particular order Image © Mordor Intelligence. Reuse requires attribution under CC BY 4.0. | |
North America Automotive Market Analysis by Mordor Intelligence
The North America automotive market size was valued at USD 1040 billion in 2025 and estimated to grow from USD 1095.7 billion in 2026 to reach USD 1422.2 billion by 2031, at a CAGR of 5.36% during the forecast period (2026-2031). Robust federal and provincial zero-emission vehicle mandates and fiscal incentives in the Inflation Reduction Act underpin the projected expansion. Automakers are localizing battery and vehicle production at unprecedented speed, balancing short-term profitability from light-truck and SUV sales with long-term electrification commitments. Commercial vehicle electrification is accelerating as fleet operators prioritize total cost-of-ownership gains, while direct-to-consumer sales models pressure entrenched dealer networks. Intensifying tariff policies and critical-mineral bottlenecks remain near-term headwinds.
Key Report Takeaways
- By vehicle type, passenger cars led with 68.63% revenue share in 2025, while medium- and heavy-commercial vehicles are on track for an 8.22% CAGR through 2031.
- By propulsion, internal-combustion vehicles captured 82.11% share of the North America automotive market size in 2025, whereas battery-electric vehicles are advancing at a 9.58% CAGR to 2031.
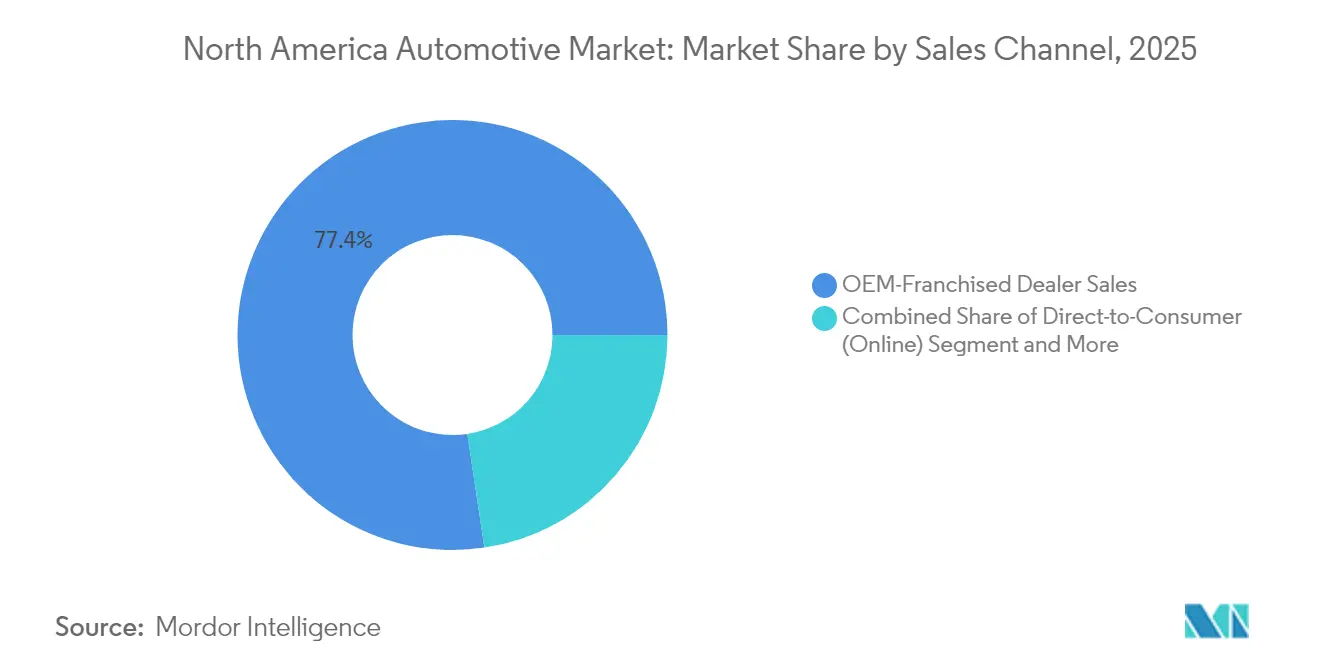
- By sales channel, franchised dealers held 77.37% of the North America automotive market share in 2025, but direct-to-consumer models are expanding 8.7% annually over the forecast period.
- By level of automation, Level 0–1 systems controlled 87.79% share in 2025, yet Level 4–5 autonomous platforms are poised for a 10.48% CAGR to 2031.
- By geography, the United States accounted for 78.21% of 2025 revenue, whereas Rest-of-North America is forecast to grow at a 7.12% CAGR through 2031.
Note: Market size and forecast figures in this report are generated using Mordor Intelligence’s proprietary estimation framework, updated with the latest available data and insights as of 2026.
North America Automotive Market Trends and Insights
Drivers Impact Analysis*
| Driver | (~) % Impact on CAGR Forecast | Geographic Relevance | Impact Timeline |
|---|---|---|---|
| Federal and State ZEV Mandates | +1.2% | United States, Canada, spillover to Mexico | Medium term (2-4 years) |
| Battery “Auto-Alley” Localization | +1.1% | United States Midwest, Ontario, Northern Mexico | Long term (≥ 4 years) |
| NEVI-Funded EV-Charging Build-Out | +0.9% | United States with cross-border corridors | Medium term (2-4 years) |
| Falling Auto-loan Rates and Pent-up Demand | +0.8% | United States, Canada | Short term (≤ 2 years) |
| Light-truck/SUV Mix Shift Lifts Margins | +0.7% | Region-wide suburban markets | Short term (≤ 2 years) |
| Software-Defined-Vehicle Revenue Model | +0.6% | Early uptake in North America | Long term (≥ 4 years) |
| Source: Mordor Intelligence | |||
Federal and State ZEV Mandates
California’s Advanced Clean Cars II regulation requires 35% zero-emission sales by 2026 and 100% by 2035; eleven additional states and Washington, D.C. have adopted identical timelines[1]“Advanced Clean Cars II,”, California Air Resources Board, arb.ca.gov. Canada’s federal ZEV rule mirrors the 2035 deadline with interim 20% and 60% milestones for 2026 and 2030, respectively[2]“Electric Vehicle Regulations,”, Transport Canada, tc.gc.ca. Proposed U.S. EPA limits push 30% zero-emission medium- and heavy-truck sales by 2030, rising to 100% by 2040. Credit banking lets early movers monetize compliance, whereas laggards face increasing penalties. The mandate architecture, therefore, rewards proactive electrification investments and accelerates supplier realignment across North America automotive market participants.
Battery “Auto-Alley” Localization
Cumulative North American battery supply-chain commitments topped USD 250 billion by end-2023, with cell plants positioned a median 284 miles from final assembly sites. Cell fabrication absorbs roughly half of the outlays, with upstream mineral processing and downstream EV assembly splitting the remainder. Canada rose first in the lithium-ion supply-chain ranking, buoyed by Honda’s CAD 15 billion integrated complex slated for 2028. Parallel Mexican projects, such as BMW’s USD 800 million San Luis Potosí expansion, secure cost-competitive capacity while preserving USMCA trade eligibility. Localized clusters mitigate logistics expense and tariff risk across the North America automotive market.
NEVI-Funded EV-Charging Build-Out
The USD 5 billion National Electric Vehicle Infrastructure program now places fast chargers in the U.S. corridors. Grants cover up to 80% of capital costs and impose 24/7 uptime plus contactless-payment standards that normalize user experience[3]“National Electric Vehicle Infrastructure Formula Program,”, U.S. Department of Transportation, dot.gov. Utilities have earmarked funds for distribution upgrades, integrating vehicle-grid interaction at scale. Equitable site selection broadens demographic reach, yet peak-hour congestion is surfacing, prompting private operators to pilot dynamic-pricing models. Reliable public charging remains a pivotal adoption lever within the North America automotive market.
Software-Defined-Vehicle Revenue Model
Connected-services subscriptions could deliver USD 1,600 recurring revenue per vehicle annually. Over-the-air updates cut warranty costs and unlock post-sale feature monetization. Two-thirds of North American OEMs already deploy OTA capabilities, indicating an early-adopter advantage in the North America automotive market.
Restraints Impact Analysis*
| Restraint | (~) % Impact on CAGR Forecast | Geographic Relevance | Impact Timeline |
|---|---|---|---|
| Vehicle Affordability Squeeze | -1.4% | Region-wide middle-income segments | Short term (≤ 2 years) |
| Tariff Brinkmanship Under USMCA Review | -1.1% | United States-Mexico cross-border trade | Short term (≤ 2 years) |
| Chip and Battery-grade Mineral Bottlenecks | -0.9% | Acute North American exposure | Medium term (2-4 years) |
| Peak-hour “charging-queue” Anxiety | -0.6% | United States urban and highway corridors | Medium term (2-4 years) |
| Source: Mordor Intelligence | |||
Vehicle Affordability Squeeze
Record transaction prices have pushed average monthly payments to historic highs, sidelining a swath of mainstream buyers. Rising incentives strain margins yet fail to restore affordability. Leasing costs have climbed sharply since 2023, nudging consumers toward used-vehicle substitutes. The pinch is most acute for battery-electric models whose upfront premiums outweigh lifetime savings for many households. Although falling interest-rate expectations offer relief, price sensitivity will cap near-term volume upside in the North America automotive market.
Peak-Hour “Charging-Queue” Anxiety
Fast-charging congestion now downgrades customer experience, with some U.S. sites fully utilized 20% of the time. The national ratio of EVs to public fast chargers lags other leading markets, intensifying wait-time concerns. Queue anxiety threatens to slow mass-market BEV adoption unless reliability and throughput improve.
*Our forecasts treat driver/restraint impacts as directional, not additive. The impact forecasts reflect baseline growth, mix effects, and variable interactions.
Segment Analysis
By Vehicle Type: Commercial Electrification Drives Growth
Medium—and heavy-commercial vehicles, though smaller in absolute volume, expand at 8.22% CAGR through 2031, materially outpacing passenger cars’ dominion in the North American automotive market. A regulatory push—California’s Advanced Clean Trucks rule and U.S. EPA proposals—targets 100% zero-emission truck sales by 2040. Fleet buyers embrace electrification, where charging can be centralized and duty cycles predictable.
Passenger cars still anchor 68.63% 2025 revenue but contend with affordability pressures and rising compliance outlays. Plant retooling for multi-powertrain flexibility enables manufacturers to modulate output amid shifting demand. Total cost-of-ownership parity for zero-emission trucks by 2035 will further tilt investment toward commercial applications, reinforcing structural growth in this segment of the North America automotive market.


By Propulsion Type: ICE Transition Accelerates
Internal-combustion powertrains command an 82.11% share in 2025; however, battery-electric vehicles will capture incremental gains at 9.58% CAGR, supported by up to USD 7,500 clean-vehicle tax credits. Hybrid models act as a bridge technology, with Ford reporting double-digit hybrid sales gains in 2024.
Plug-in hybrids provide range assurance for long-distance drivers while meeting partial electrification quotas. Fuel-cell offerings remain niche, limited by hydrogen infrastructure gaps. Propulsion diversification allows OEMs to de-risk capital allocation while scaling batteries and software platforms central to the evolving North America automotive market size.
By Sales Channel: Direct-Consumer Models Disrupt Traditional Networks
Franchised dealers hold 77.37% share today, yet direct-to-consumer deliveries grow 8.7% annually as brands pursue higher margins and richer data sets. Tesla illustrates the economic upside of bypassing dealerships, even as certain EV startups revert to hybrid approaches to control delivery costs. Premium EV brands capture point margin uplift via direct models, an incentive likely to resonate across the broader North America automotive market.
Dealer survival hinges on digital engagement and EV-specific service competence. As software-defined vehicles reduce mechanical service frequency, revenue mixes shift toward diagnostics, accessory sales, and subscription facilitation. Shared data platforms between OEMs and retailers will define customer-experience leadership in the coming decade.
By Level of Automation: Regulatory Frameworks Enable Gradual Deployment
Level 0–1 driver-assistance systems dominated with an 87.79% share in 2025, but Level 4–5 autonomous features grew at a 10.48% CAGR through 2031. Waymo surpassed 4 million paid robotaxi rides in 2024, broadening service to multiple U.S. metros.
Level 2 partial-automation suites are standard in many new nameplates, acclimatizing consumers to higher autonomy. Regulatory clarity on liability and safety validation remains the gating factor for large-scale L3 and L4 deployment. OEM alliances with tech firms accelerate software stack development, ensuring the North America automotive market retains leadership in self-driving innovation.
Geography Analysis
The United States accounted for 78.21% of 2025 revenue, buoyed by NEVI investments and domestic-content incentives that reroute global supply chains toward local production. Light-vehicle sales climbed to 15.851 million units, with GM expanding capacity above 2 million vehicles annually through USD 4 billion plant upgrades. Toyota and Hyundai committed multi-billion-dollar spending to secure battery and final assembly footprints that anchor the North America automotive market size for the next generation of vehicles.
Canada leverages plentiful critical minerals and renewable energy to ascend the global battery-supply-chain index. More than CAD 46 billion in cumulative automotive commitments since 2020 include Honda’s CAD 15 billion complete EV value chain, featuring 36 GWh annual cell output. However, national vehicle output remains below pre-pandemic highs. Fresh capacity targets mid-decade ramp-ups that will widen Canada’s role in the North American automotive market.
The rest of North America, led by Mexico, grows at a 7.12% CAGR as near-shoring trends and wage arbitrage draw substantial FDI. Mexico’s cost advantage and USMCA compliance attract marquee projects from BMW, Stellantis, and Volvo. Firmly embedding Mexico within the integrated regional ecosystem that defines the North American automotive market share trajectory.
Competitive Landscape
Competition is intensifying yet remains moderately consolidated. Legacy OEMs exploit economies of scale, but Tesla’s vertically integrated direct-sales model has redefined customer expectations. The proposed Nissan–Honda merger, aiming for 8 million annual units, signals a drive toward heft in electrification and software capabilities. Chinese entrants eye regional manufacturing footprints to bypass tariffs, pushing incumbents to accelerate localized investment.
Technology leadership dominates strategic agendas. GM plans to spend USD 10–11 billion in annual capex through 2027 on battery and EV expansion, while Ford channels resources toward commercial EVs and hybrids. Battery joint ventures, cathode-material alliances, and ADAS software partnerships proliferate as firms seek risk sharing. Early compliance with ZEV credit schemes smartly positions several players to monetize surplus credits, strengthening balance-sheet resilience within the North America automotive market.
Dealer networks evolve into omnichannel hubs as software-defined architectures shift service income toward digital flows. Meanwhile, subscription-based feature unlocks open fresh revenue pools estimated at USD 1,600 per vehicle annually. Sustained margin differentiation will hinge on executing these new models while navigating policy volatility and commodity exposure.
North America Automotive Industry Leaders
General Motors
Ford Motor Company
Stellantis NV
Toyota Motor Corporation
Hyundai Motor Company
- *Disclaimer: Major Players sorted in no particular order

Recent Industry Developments
- June 2025: General Motors announced a USD 4 billion investment across Orion (MI), Fairfax (KS), and Spring Hill (TN) to lift combined annual capacity past 2 million vehicles.
- February 2025: Nissan and Honda entered merger negotiations to form the world’s third-largest automaker at 8 million annual units.
- December 2024: Hyundai opened a USD 7.6 billion EV plant in Georgia, expanding southeastern U.S. production.


North America Automotive Market Report Scope
The North American automotive industry outlook covers the growing demand for passenger cars, commercial vehicles, and two-wheelers in the region, investments made by OEMs to establish their presence in North America, emission regulations, developments in the electric vehicle market, and market shares of both OEMs and OES.
The North American automotive market is segmented by vehicle type (passenger cars, commercial vehicles (light commercial vehicles and medium and heavy commercial vehicles), and two-wheelers) and geography (United States, Canada, and the Rest of North America).
By Vehicle Type
| Passenger Cars |
| Light Commercial Vehicles |
| Medium & Heavy Commercial Vehicles |
| Two-Wheelers |
By Propulsion Type
| Internal Combustion Engine (ICE) |
| Hybrid Electric Vehicles (HEV) |
| Plug-in Hybrid Vehicles (PHEV) |
| Battery Electric Vehicles (BEV) |
| Fuel-Cell Electric Vehicles (FCEV) |
| Natural-Gas Vehicles (NGV) |
By Sales Channel
| OEM-Franchised Dealer Sales |
| Direct-to-Consumer (Online) |
| Fleet and Rental Sales |
By Level of Automation (Value)
| Level 0 - 1 (Basic / No ADAS) |
| Level 2 (Partial Automation) |
| Level 3 (Conditional Automation) |
| Level 4 - 5 (High / Full Automation) |
By Country
| United States |
| Canada |
| Rest of North America |
| By Vehicle Type | Passenger Cars |
| Light Commercial Vehicles | |
| Medium & Heavy Commercial Vehicles | |
| Two-Wheelers | |
| By Propulsion Type | Internal Combustion Engine (ICE) |
| Hybrid Electric Vehicles (HEV) | |
| Plug-in Hybrid Vehicles (PHEV) | |
| Battery Electric Vehicles (BEV) | |
| Fuel-Cell Electric Vehicles (FCEV) | |
| Natural-Gas Vehicles (NGV) | |
| By Sales Channel | OEM-Franchised Dealer Sales |
| Direct-to-Consumer (Online) | |
| Fleet and Rental Sales | |
| By Level of Automation (Value) | Level 0 - 1 (Basic / No ADAS) |
| Level 2 (Partial Automation) | |
| Level 3 (Conditional Automation) | |
| Level 4 - 5 (High / Full Automation) | |
| By Country | United States |
| Canada | |
| Rest of North America |


Key Questions Answered in the Report
How large is the North America automotive market in 2026?
The North America automotive market size is USD 1.1 trillion in 2026.
What is the forecast CAGR for vehicle sales in North America to 2031?
The market is projected to expand at a 5.36% CAGR through 2031.
Which vehicle segment grows fastest this decade?
Medium- and heavy-commercial vehicles lead with an 8.22% CAGR as fleets electrify.
How will U.S. tariffs affect regional production?
The 25% tariff from 2025 is driving automakers to accelerate onshore capacity investments across the United States, Canada, and Mexico.
Why are software-defined vehicles important to automakers?
Connected-service subscriptions linked to software-defined vehicles could yield USD 1,600 annual recurring revenue per unit, reshaping profitability models.
Page last updated on:


