Market Overview
| Study Period | 2019 - 2031 |
|---|---|
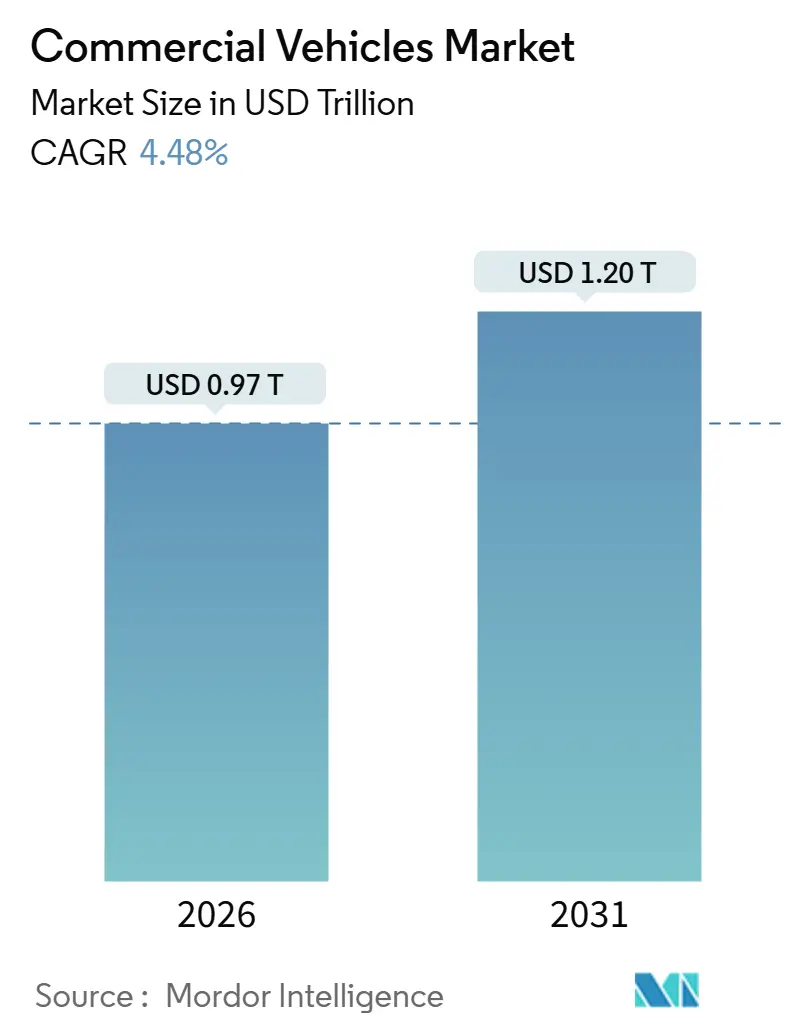
| Market Size (2026) | USD 0.97 Trillion |
| Market Size (2031) | USD 1.20 Trillion |
| Growth Rate (2026 - 2031) | 4.48% CAGR |
| Fastest Growing Market | Asia Pacific |
| Largest Market | Asia Pacific |
| Market Concentration | Medium |
Major Players *Disclaimer: Major Players sorted in no particular order Image © Mordor Intelligence. Reuse requires attribution under CC BY 4.0. | |
Commercial Vehicles Market Analysis by Mordor Intelligence
The commercial vehicles market size reached USD 0.97 trillion in 2026 and is projected to climb to USD 1.20 trillion by 2031, advancing at a 4.48% CAGR over the forecast period. Fleet owners are recalibrating capital-spending plans amid tightening CO₂ rules, battery-cost deflation, and infrastructure bottlenecks that slow large-scale depot electrification. Hybrid and battery-electric trucks are growing at a significantly faster pace compared to the overall market, yet internal-combustion engines continue to dominate freight transport, particularly in regions where megawatt chargers or battery-swap stations are not yet available. The Asia-Pacific region remains a key driver of global demand, supported by government incentives in countries like China and India. In Europe, funding for clean-transport corridors is accelerating depot upgrades, although delays in grid connections present ongoing challenges. Competitive pressures have intensified as major players like Daimler Truck, Volvo Group, and PACCAR strive to defend their market share against emerging competitors such as BYD and SAIC, who are rapidly increasing their production. This competition highlights a growing technology race that spans advancements in batteries, megawatt connectors, and subscription-based energy services.
Key Report Takeaways
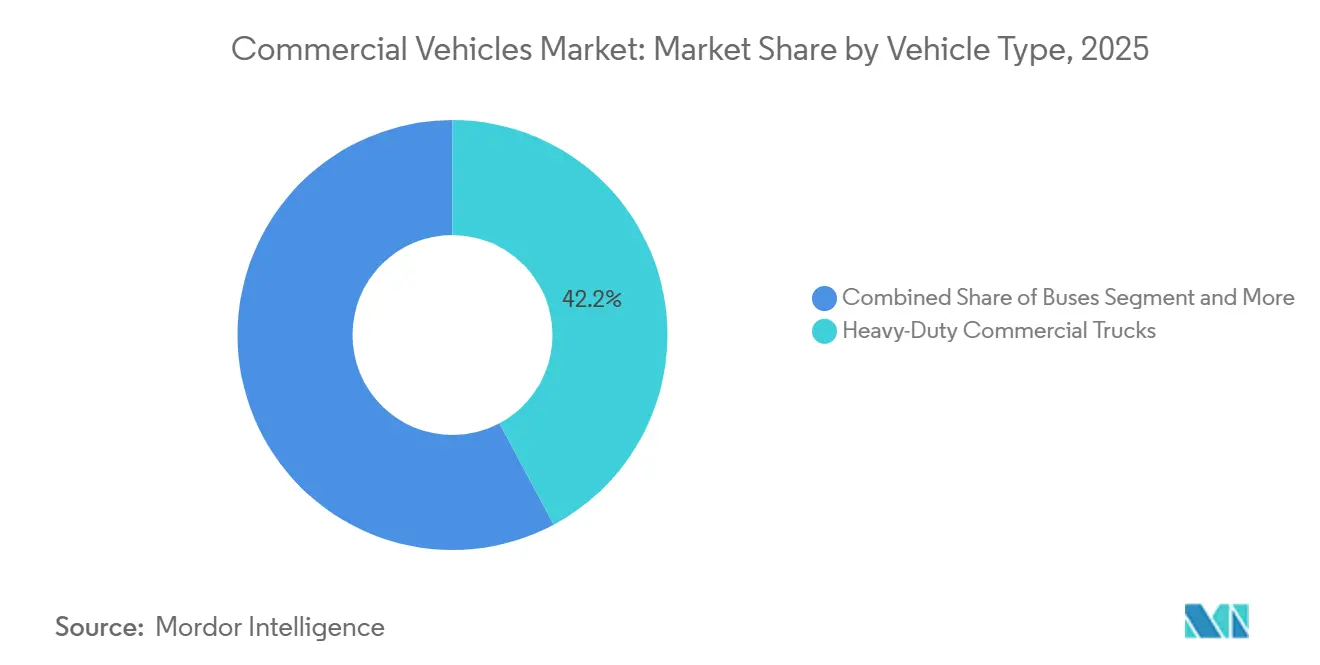
- By vehicle type, heavy-duty commercial trucks held 42.15% of the commercial vehicles market share in 2025, whereas light commercial vans are forecast to expand at a 6.24% CAGR to 2031.
- By propulsion type, internal-combustion platforms accounted for 69.03% of the commercial vehicles market size in 2025, while hybrid and electric variants are poised for an 8.33% CAGR through 2031.
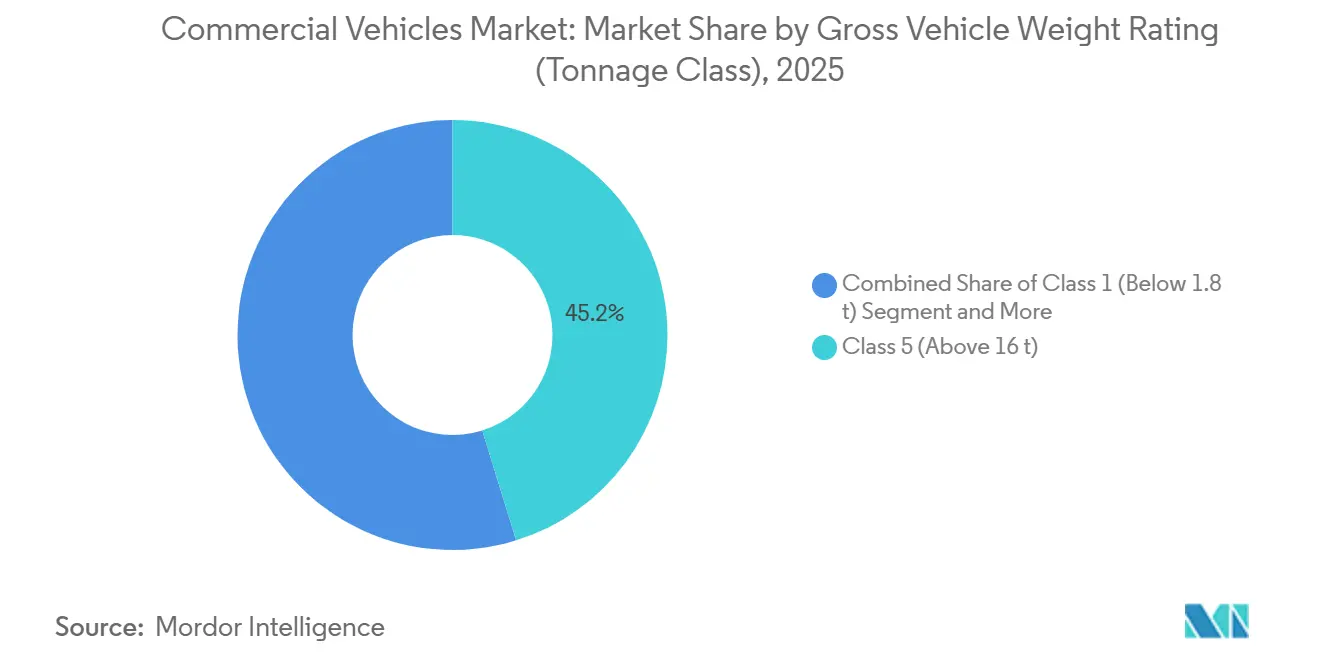
- By gross vehicle weight rating, Class 5 vehicles above 16 tons captured 45.22% of the commercial vehicles market share in 2025, and Class 2 units are expected to post a 7.21% CAGR between 2026 and 2031.
- By end-use industry, logistics and e-commerce commanded 38.13% of demand in the commercial vehicles market in 2025 and are projected to rise at a 5.81% CAGR.
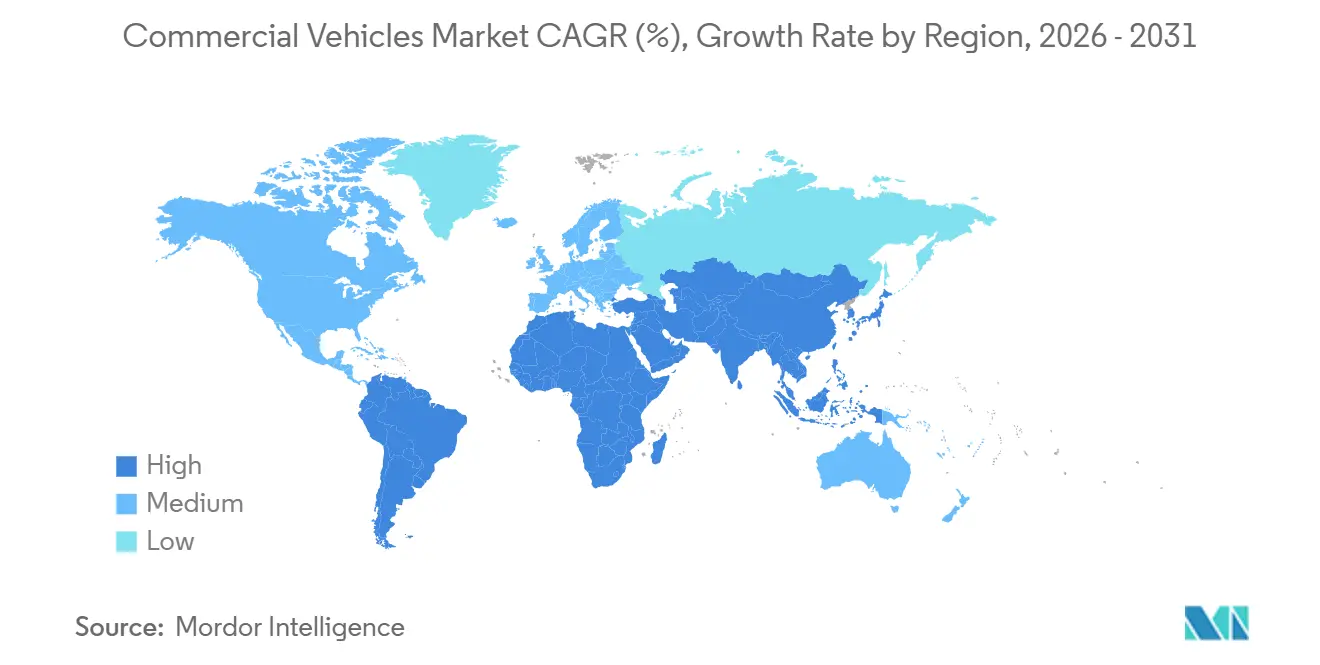
- By geography, Asia-Pacific generated 46.25% of global revenue in the commercial vehicles market in 2025 and is anticipated to grow at a 7.74% CAGR, the fastest regional trajectory.
Note: Market size and forecast figures in this report are generated using Mordor Intelligence’s proprietary estimation framework, updated with the latest available data and insights as of January 2026.
Global Commercial Vehicles Market Trends and Insights
Drivers Impact Analysis*
| Driver | (~) % Impact on CAGR Forecast | Geographic Relevance | Impact Timeline |
|---|---|---|---|
| CO₂ and NOx Emission Limits | +1.2% | North America, Europe, China | Medium term (2-4 years) |
| E-commerce and 3PL Growth | +0.9% | Global urban centers | Short term (≤ 2 years) |
| Low Battery-Pack USD/kWh | +0.8% | Global, led by China and Europe | Medium term (2-4 years) |
| Megawatt-Charging Corridor Pilots | +0.6% | United States West Coast, Rhine–Alpine | Medium term (2-4 years) |
| Commercial Battery-Swap Ecosystems | +0.5% | China's core, Southeast Asia outlook | Long term (≥ 4 years) |
| Battery-as-a-Service Rollout | +0.4% | Europe, North America, Asia-Pacific | Long term (≥ 4 years) |
| Source: Mordor Intelligence | |||


Tightening CO₂ and NOx Emission Limits in the United States, EU and China
After 2024, governments ramped up stringent carbon regulations, shortening OEM development timelines and increasing compliance expenses. However, subsidies and tax credits are now offsetting the total ownership costs for zero-emission trucks. The new EPA Phase 3 targets mandate reduced CO₂ emissions for 2027 heavy-duty vehicle models[1]“Final Rule: Greenhouse Gas Emissions Standards for Heavy-Duty Vehicles – Phase 3,” U.S. Environmental Protection Agency, epa.gov. Meanwhile, Europe's clean-transport corridors are set to install megawatt chargers at regular intervals. In China, the extension of stricter emission standards to larger trucks has significantly reduced NOx emissions, leading to the premature retirement of non-compliant diesel units. Fleet operators in California and Germany have made long-term commitments to electric truck purchases, valuing regulatory clarity over the challenges of early infrastructure deployment. As a result, initiatives like subsidized capital expenditures and carbon pricing are propelling the commercial vehicles market upward.
Explosive E-commerce and 3PL Growth Requiring Last-mile Fleets
As parcel volumes surged, outpacing the pace of warehouse automation, logistics firms found themselves compelled to electrify their light-duty vans, especially those operating in urban zero-emission zones. Amazon has rolled out a substantial fleet of electric vans across North America and Europe by the end of 2025. Meanwhile, DHL has committed significant investments, aiming to electrify a majority of its urban fleet in the coming years. In response to municipal diesel restrictions in cities like London, Paris, and Beijing, which curtail peak-hour access for internal combustion engine (ICE) vans, electric vans are increasingly becoming a preferred choice for urban delivery vehicles in Europe. While the United States trails in adoption—attributed to its longer suburban routes and a sparse network of chargers—pilot programs in Los Angeles and New York have showcased that depot charging can effectively support daily operational cycles. These developments highlight a robust and growing demand for electrified light-duty vehicles in the commercial vehicles market.
Record Low Battery-pack USD/kWh Unlocking HD-truck Parity
In 2025, battery costs significantly declined, with advancements in LFP chemistry further enhancing affordability. This trend has brought heavy-duty electric trucks closer to achieving cost parity with diesel counterparts in high-utilization fleets. In regions with moderate electricity prices, Daimler Truck AG’s eActros 600 demonstrates notably lower energy costs per kilometer. Additionally, Volvo Group has made substantial progress in reducing the battery's contribution to overall production costs over the past few years. However, North American fleets continue to face challenges due to higher power prices and less favorable diesel tax structures, leading to extended payback periods. In contrast, Chinese operators benefit from supportive tariff policies, enabling faster breakeven timelines and driving the most rapid adoption rates within the commercial vehicles market.
Megawatt-charging Corridor Pilots on I-5 and Rhine-Alpine
Germany's HoLa project has installed high-capacity charging stations on the A2 autobahn, enabling heavy-duty trucks to recharge quic kly. This refueling pace aligns with the EU's mandated driver breaks. Meanwhile, in the United States, Daimler plans to deploy high-power chargers at multiple truck stops along Interstate 5, with plans for further expansion in the coming years. However, grid upgrades pose a challenge: each charger consumes significant power, necessitating utility projects that require considerable time to complete. While German public funding speeds up these connections, fleets in the United States grapple with a patchwork of incentives. If permitting compresses, megawatt corridors could unlock 500-kilometer daily ranges by 2028, a milestone that would materially lift the commercial vehicles market electrification rate.
Restraints Impact Analysis*
| Restraint | (~) % Impact on CAGR Forecast | Geographic Relevance | Impact Timeline |
|---|---|---|---|
| 5 MW Depot Grid Delays | -0.7% | North America, United Kingdom, select EU | Short term (≤ 2 years) |
| BEV Truck Insurance-Premium Spikes | -0.6% | North America, Europe | Medium term (2-4 years) |
| Electric HD Truck Residual Uncertainty | -0.5% | Global, acute in North America and EU | Medium term (2-4 years) |
| Nickel and Moly Surcharges | -0.3% | Global, higher in Europe | Short term (≤ 2 years) |
| Source: Mordor Intelligence | |||
Grid-connection Delays (Above 24 Months) for 5 MW Depot Chargers
Fleet electrification timelines are being stretched by utility backlogs. In the United Kingdom, connection requests face significant delays. Meanwhile, in California, larger projects often encounter extended waiting periods. Substation upgrades are hindered by transformer shortages and a regulatory sequence that prioritizes residential solar tie-ins. In Germany, while co-funding is available for infrastructure, the disbursement process is slow, with any relief not expected in the near term. Unless utilities expedite approvals or regulators enforce fast-track queues, depot electrification will continue to lag, dampening the near-term potential for the commercial vehicles market[2]“Electricity Ten Year Statement 2025,” National Grid ESO, nationalgrid.com.
Insurance-premium Spike for BEV Trucks in North America and EU (Above 35%)
Due to unpredictable repair costs and a shortage of technicians, underwriters have significantly increased premiums for electric Class 8 vehicles. Insurers are left assuming minimal recovery, as salvage values are unclear and secondary markets for large packs are still in their early stages. Fleets in the United Kingdom are experiencing insurance offsets that reduce their anticipated fuel savings, causing delays in purchasing decisions. While OEM-linked insurance products are attempting to utilize telematics for risk-based pricing, the coverage primarily benefits larger fleets, limiting broader adoption in the commercial vehicle market.
*Our forecasts treat driver/restraint impacts as directional, not additive. The impact forecasts reflect baseline growth, mix effects, and variable interactions.
Segment Analysis
By Vehicle Type: E-Commerce Fuels Van Electrification
Heavy-duty trucks, despite a 42.15% 2025 volume share, shoulder payload and range constraints that keep diesel dominant until megawatt chargers proliferate. Medium-duty units await infrastructure clarity, while buses depend on municipal budgets and political cycles. Pick-up trucks remain mostly gasoline in rural North America, although pilot fleets featuring Ford F-150 Lightning and Rivian variants signal an early transition in utilities and construction. Light commercial vans grew fastest, propelled by parcel density and city-center emission rules. Vans require 150-200 kWh packs—less than those of heavy-duty trucks—supporting three-year payback horizons even before fuel levies. The commercial vehicles market size for light vans is set to expand at a 6.24% CAGR, outpacing bus and medium-duty segments.
European zero-emission zones accelerate van adoption by banning diesel deliveries during peak hours, and subsidies shorten payback in urban operations. North America’s longer routes retain diesel dominance, yet pilot data suggest depot charging can sustain daily range needs. Heavy-duty truck growth hinges on battery-cost curves and corridor charging funding, meaning vans will be the workhorse of commercial vehicles market expansion through 2031.


By Propulsion Type: ICE Dominance Masks Rapid EV Gains
Internal-combustion engines kept 69.03% of 2025 revenue in the commercial vehicles market, but hybrid and electric variants log an 8.33% CAGR, signaling structural rebalancing. Battery-electric leads electrification, while plug-in hybrids bridge infrastructure gaps for cautious fleets. Diesel engines face nickel-moly inflation and regulatory complexity, eroding cost advantages. CNG persists in refuse and transit fleets with central refueling, yet growth stays modest as electric TCO declines. Gasoline and LPG fade under urban restrictions.
Battery-electric uptake varies by region: China and Europe advance fastest via subsidies and access rules; North America electrifies urban delivery while preserving diesel for long haul; emerging markets delay until chargers proliferate. Fuel-cell pilots progress for long-range duty cycles, but high hydrogen costs stall scale-up. The propulsion mix through 2031 will pivot on policy timing and battery-density milestones, reshaping supply chains in the commercial vehicles market.
By Gross Vehicle Weight Rating: Class 2 Gains from Urban Logistics
Class 5 vehicles held 45.22% of the 2025 share, underpinning heavy-haul and construction segments. Yet Class 2 vehicles, critical for city logistics, are projected to post a 7.21% CAGR, the fastest among weight classes. Lower battery capacities keep purchase prices manageable, and EU weight exemptions protect payloads when batteries add mass. Class 4 faces a transitional void: too heavy for affordable batteries, too light for hydrogen economics, restraining electrification. Class 3 benefits from depot charging, while Class 1 pick-ups watch consumer demand before committing to full electric.
North America's absence of weight exemptions hampers payload-neutral electrification, whereas China’s battery-swap model anchors growth in the heavier Class 5. The trajectory underscores that urban logistics will dictate weight-class evolution inside the commercial vehicles market.
By End-Use Industry: Logistics Leads, Construction Lags
Logistics and e-commerce operators owned 38.13% of the 2025 demand and will grow 5.81% annually, supported by high utilization and corporate carbon pledges. Construction and mining fleets grapple with rugged duty cycles and remote sites, delaying electric adoption despite surging diesel costs. Public-transport electrification delivered early wins in China and Europe but moves more slowly elsewhere as procurement budgets tighten. Utilities and municipal services adopt electric trucks to meet noise and emission rules, yet fleet sizes limit aggregate growth.
Logistics vans are utilized extensively throughout the year, optimizing fuel savings, whereas construction trucks often remain idle between projects. This divergence, rooted in utilization economics, is further accentuated by policy incentives, positioning logistics as the dominant force driving demand in the commercial vehicles market over the forecast period.
Geography Analysis
Asia-Pacific generated 46.25% of global revenue in 2025 and will post a 7.74% CAGR, the highest worldwide in the commercial vehicles market. China leads with 1.2 million electric commercial vehicles produced by BYD, SAIC Motor, and Foton Motor, benefiting from purchase-tax waivers and battery-swap corridors. India’s FAME-II extensions spur light-duty electrification in top metros, while Japan and South Korea double down on hydrogen heavy-duty pilots. Southeast Asia attracts Chinese assembly plants, yet slower infrastructure roll-outs limit penetration.
Europe advances on the strength of Germany’s significant charger fund and expanding zero-emission zones [3]“Charging Infrastructure Master Plan II,” German Federal Ministry for Digital and Transport, bmvd.de. France and the United Kingdom restrict diesel van access to city centers, boosting van electrification but straining urban grids. Southern Europe trails in infrastructure and fiscal leeway, though incentives through 2026 aim to narrow the gap. Russia remains mostly diesel amid sanctions, and harsh winters degrade battery efficiency.
North America is bifurcated: California and the Northeast push zero-emission mandates, while the Midwest keeps diesel for long haul. Canada’s federal rebates spark adoption in Ontario and Quebec, yet rural distances mute impact. Brazil and Argentina pilot electric buses, but most freight stays diesel until charging costs fall. The Middle East and Africa show early interest in logistics free zones, but oil economies and nascent infrastructure delay meaningful share shifts. Collectively, Asia-Pacific and Europe will drive the commercial vehicles market expansion, while North America and emerging regions catch up post-2028.

Competitive Landscape
In 2025, Daimler Truck AG, Volvo Group, and PACCAR Inc. dominated the heavy-duty segment, while the light-duty sector remained fragmented. Incumbent players, filing an increasing number of patents annually for megawatt connectors and solid-state packs, are leveraging their service networks to safeguard profit margins. Meanwhile, Chinese firms BYD and SAIC Motor ramped up production in 2024–2025, setting their sights on Southeast Asia and South America. In these regions, lenient standards and subsidized power render electric trucks competitively priced. United States-based start-ups like Rivian and Nikola Corporation are carving out niches with electric delivery vans and hydrogen heavy-duty commercial vehicles, yet they grapple with challenges related to capital and infrastructure.
As the industry pivots, energy services are emerging as lucrative avenues. Volvo and Daimler are venturing into battery leases, BYD is establishing swap networks, and CATL is making strategic moves in infrastructure, all aiming to broaden their revenue streams beyond mere hardware sales. While smaller OEMs are collaborating with cell suppliers to avoid the hefty capital expenditure of giga-factories, they find it challenging to expand their sales on a global scale.
Standards like ISO 15118 for vehicle-to-grid technology and CharIN's megawatt connectors are becoming essential benchmarks, elevating the importance of software and interoperability. In the commercial vehicles arena, the market favors integrators who offer bundled contracts encompassing trucks, energy, and data, rather than those solely competing on price.
Commercial Vehicles Industry Leaders
Daimler Truck AG
Dongfeng Motor Corporation Ltd.
Volvo Group
PACCAR Inc.
Traton SE
- *Disclaimer: Major Players sorted in no particular order


Recent Industry Developments
- December 2025: BYD announced a new Brazilian bus plant targeting 6,000-7,000 electric units per year to clear a swelling order backlog and deepen regional roots.
- November 2025: VE Commercial Vehicles launched the Eicher Pro X Diesel in the 2-3.5 ton segment, offering higher uptime to small businesses and first-time buyers.
- October 2025: Blue Energy Motors inked an INR 3,500 crore (~USD 420 million) pact with Maharashtra for a 30,000-unit electric truck facility featuring battery-swap readiness.
- March 2025: Volvo Buses rolled out the Volvo 7800 Electric in Mexico, the country’s first electric articulated bus designed for bus-rapid-transit corridors.


Global Commercial Vehicles Market Report Scope
The scope includes segmentation by vehicle type (buses, heavy-duty commercial trucks, medium-duty commercial trucks, light commercial pick-up trucks, and light commercial vans), propulsion type (hybrid and electric vehicles and internal combustion engine), gross vehicle weight rating (class 1 (below 1.8 t), class 2 (1.8-3.5 t), class 3 (3.5-7.5 t), class 4 (7.5-16 t), and class 5 (above 16 t)), and end-use industry (logistics and e-commerce, construction and mining, public transport, utilities and municipal services, and others). The analysis also covers regional-level segmentation, including North America, South America, Europe, Asia-Pacific, the Middle East, and Africa. Market size and growth forecasts are presented by value in USD and by volume in units.
By Vehicle Type
| Buses |
| Heavy-Duty Commercial Trucks |
| Medium-Duty Commercial Trucks |
| Light Commercial Pick-up Trucks |
| Light Commercial Vans |
By Propulsion Type
| Hybrid and Electric Vehicles | Battery Electric Vehicle (BEV) |
| Fuel Cell Electric Vehicle (FCEV) | |
| Hybrid Electric Vehicle (HEV) | |
| Plug-in Hybrid Electric Vehicle (PHEV) | |
| Internal Combustion Engine (ICE) | Diesel |
| Compressed Natural Gas (CNG) | |
| Gasoline | |
| Liquefied Petroleum Gas (LPG) |
By Gross Vehicle Weight Rating (Tonnage Class)
| Class 1 (Below 1.8 t) |
| Class 2 (1.8-3.5 t) |
| Class 3 (3.5-7.5 t) |
| Class 4 (7.5-16 t) |
| Class 5 (Above 16 t) |
By End-Use Industry
| Logistics and E-commerce |
| Construction and Mining |
| Public Transport |
| Utilities and Municipal Services |
| Others (Agriculture, Retail) |
By Geography
| North America | United States |
| Canada | |
| Rest of North America | |
| South America | Brazil |
| Argentina | |
| Rest of South America | |
| Europe | Germany |
| United Kingdom | |
| France | |
| Italy | |
| Russia | |
| Rest of Europe | |
| Asia-Pacific | China |
| India | |
| Japan | |
| South Korea | |
| Rest of Asia-Pacific | |
| Middle East and Africa | Saudi Arabia |
| United Arab Emirates | |
| South Africa | |
| Rest of the Middle East and Africa |
| By Vehicle Type | Buses | |
| Heavy-Duty Commercial Trucks | ||
| Medium-Duty Commercial Trucks | ||
| Light Commercial Pick-up Trucks | ||
| Light Commercial Vans | ||
| By Propulsion Type | Hybrid and Electric Vehicles | Battery Electric Vehicle (BEV) |
| Fuel Cell Electric Vehicle (FCEV) | ||
| Hybrid Electric Vehicle (HEV) | ||
| Plug-in Hybrid Electric Vehicle (PHEV) | ||
| Internal Combustion Engine (ICE) | Diesel | |
| Compressed Natural Gas (CNG) | ||
| Gasoline | ||
| Liquefied Petroleum Gas (LPG) | ||
| By Gross Vehicle Weight Rating (Tonnage Class) | Class 1 (Below 1.8 t) | |
| Class 2 (1.8-3.5 t) | ||
| Class 3 (3.5-7.5 t) | ||
| Class 4 (7.5-16 t) | ||
| Class 5 (Above 16 t) | ||
| By End-Use Industry | Logistics and E-commerce | |
| Construction and Mining | ||
| Public Transport | ||
| Utilities and Municipal Services | ||
| Others (Agriculture, Retail) | ||
| By Geography | North America | United States |
| Canada | ||
| Rest of North America | ||
| South America | Brazil | |
| Argentina | ||
| Rest of South America | ||
| Europe | Germany | |
| United Kingdom | ||
| France | ||
| Italy | ||
| Russia | ||
| Rest of Europe | ||
| Asia-Pacific | China | |
| India | ||
| Japan | ||
| South Korea | ||
| Rest of Asia-Pacific | ||
| Middle East and Africa | Saudi Arabia | |
| United Arab Emirates | ||
| South Africa | ||
| Rest of the Middle East and Africa | ||


Market Definition
- Vehicle Type - The category covers light, medium, and heavy duty commercial vehicle.
- Vehicle Body Type - This includes Light Commercial Pick-up Trucks, Light Commercial Vans, Medium-duty Commercial Trucks, Heavy-duty Commercial Trucks, and Medium and Heavy Duty Buses.
- Fuel Category - The category includes various fuel types such as Gasoline, Diesel, LPG (Liquefied Petroleum Gas), CNG (Compressed Natural Gas), HEV (Hybrid Electric Vehicles), PHEV (Plug-in Hybrid Electric Vehicles), BEV (Battery Electric Vehicles), and FCEV (Fuel Cell Electric Vehicles)
| Keyword | Definition |
|---|---|
| Electric Vehicle (EV) | A vehicle which uses one or more electric motors for propulsion. Includes cars, buses, and trucks. This term includes all-electric vehicles or battery electric vehicles and plug-in hybrid electric vehicles. |
| BEV | A BEV relies completely on a battery and a motor for propulsion. The battery in the vehicle must be charged by plugging it into an outlet or public charging station. BEVs do not have an ICE and hence are pollution-free. They have a low cost of operation and reduced engine noise as compared to conventional fuel engines. However, they have a shorter range and higher prices than their equivalent gasoline models. |
| PEV | A plug-in electric vehicle is an electric vehicle that can be externally charged and generally includes all-electric vehicles as well as plug-in hybrids. |
| Plug-in Hybrid EV | A vehicle that can be powered either by an ICE or an electric motor. In contrast to normal hybrid EVs, they can be charged externally. |
| Internal combustion engine | An engine in which the burning of fuels occurs in a confined space called a combustion chamber. Usually run with gasoline/petrol or diesel. |
| Hybrid EV | A vehicle powered by an ICE in combination with one or more electric motors that use energy stored in batteries. These are continually recharged with power from the ICE and regenerative braking. |
| Commercial Vehicles | Commercial vehicles are motorized road vehicles designed for transporting people or goods. The category includes light commercial vehicles (LCVs) and medium and heavy-duty vehicles (M&HCV). |
| Passenger Vehicles | Passenger cars are electric motor– or engine-driven vehicles with at least four wheels. These vehicles are used for the transport of passengers and comprise no more than eight seats in addition to the driver’s seat. |
| Light Commercial Vehicles | Commercial vehicles that weigh less than 6,000 lb (Class 1) and in the range of 6,001–10,000 lb (Class 2) are covered under this category. |
| M&HDT | Commercial vehicles that weigh in the range of 10,001–14,000 lb (Class 3), 14,001–16,000 lb (Class 4), 16,001–19,500 lb (Class 5), 19,501–26,000 lb (Class 6), 26,001–33,000 lb (Class 7) and above 33,001 lb (Class 8) are covered under this category. |
| Bus | A mode of transportation that typically refers to a large vehicle designed to carry passengers over long distances. This includes transit bus, school bus, shuttle bus, and trolleybuses. |
| Diesel | It includes vehicles that use diesel as their primary fuel. A diesel engine vehicle have a compression-ignited injection system rather than the spark-ignited system used by most gasoline vehicles. In such vehicles, fuel is injected into the combustion chamber and ignited by the high temperature achieved when gas is greatly compressed. |
| Gasoline | It includes vehicles that use gas/petrol as their primary fuel. A gasoline car typically uses a spark-ignited internal combustion engine. In such vehicles, fuel is injected into either the intake manifold or the combustion chamber, where it is combined with air, and the air/fuel mixture is ignited by the spark from a spark plug. |
| LPG | It includes vehicles that use LPG as their primary fuel. Both dedicated and bi-fuel LPG vehicles are considered under the scope of the study. |
| CNG | It includes vehicles that use CNG as their primary fuel. These are vehicles that operate like gasoline-powered vehicles with spark-ignited internal combustion engines. |
| HEV | All the electric vehicles that use batteries and an internal combustion engine (ICE) as their primary source for propulsion are considered under this category. HEVs generally use a diesel-electric powertrain and are also known as hybrid diesel-electric vehicles. An HEV converts the vehicle momentum (kinetic energy) into electricity that recharges the battery when the vehicle slows down or stops. The battery of HEV cannot be charged using plug-in devices. |
| PHEV | PHEVs are powered by a battery as well as an ICE. The battery can be charged through either regenerative breaking using the ICE or by plugging into some external charging source. PHEVs have a better range than BEVs but are comparatively less eco-friendly. |
| Hatchback | These are compact-sized cars with a hatch-type door provided at the rear end. |
| Sedan | These are usually two- or four-door passenger cars, with a separate area provided at the rear end for luggage. |
| SUV | Popularly known as SUVs, these cars come with four-wheel drive, and usually have high ground clearance. These cars can also be used as off-road vehicles. |
| MPV | These are multi-purpose vehicles (also called minivans) designed to carry a larger number of passengers. They carry between five and seven people and have room for luggage too. They are usually taller than the average family saloon car, to provide greater headroom and ease of access, and they are usually front-wheel drive. |


Research Methodology
Mordor Intelligence follows a four-step methodology in all its reports.
- Step-1: Identify Key Variables: To build a robust forecasting methodology, the variables and factors identified in Step-1 are tested against available historical market numbers. Through an iterative process, the variables required for market forecast are set and the model is built based on these variables.
- Step-2: Build a Market Model: Market-size estimations for the historical and forecast years have been provided in revenue and volume terms. Market revenue is calculated by multiplying the sales volume with their respective average selling price (ASP). While estimating ASP factors like average inflation, market demand shift, manufacturing cost, technological advancement, and varying consumer preference, among others have been taken into account.
- Step-3: Validate and Finalize: In this important step, all market numbers, variables, and analyst calls are validated through an extensive network of primary research experts from the market studied. The respondents are selected across levels and functions to generate a holistic picture of the market studied.
- Step-4: Research Outputs: Syndicated Reports, Custom Consulting Assignments, Databases & Subscription Platforms.


