Specialty Vehicles Market Size and Share
Market Overview
| Study Period | 2019 - 2031 |
|---|---|
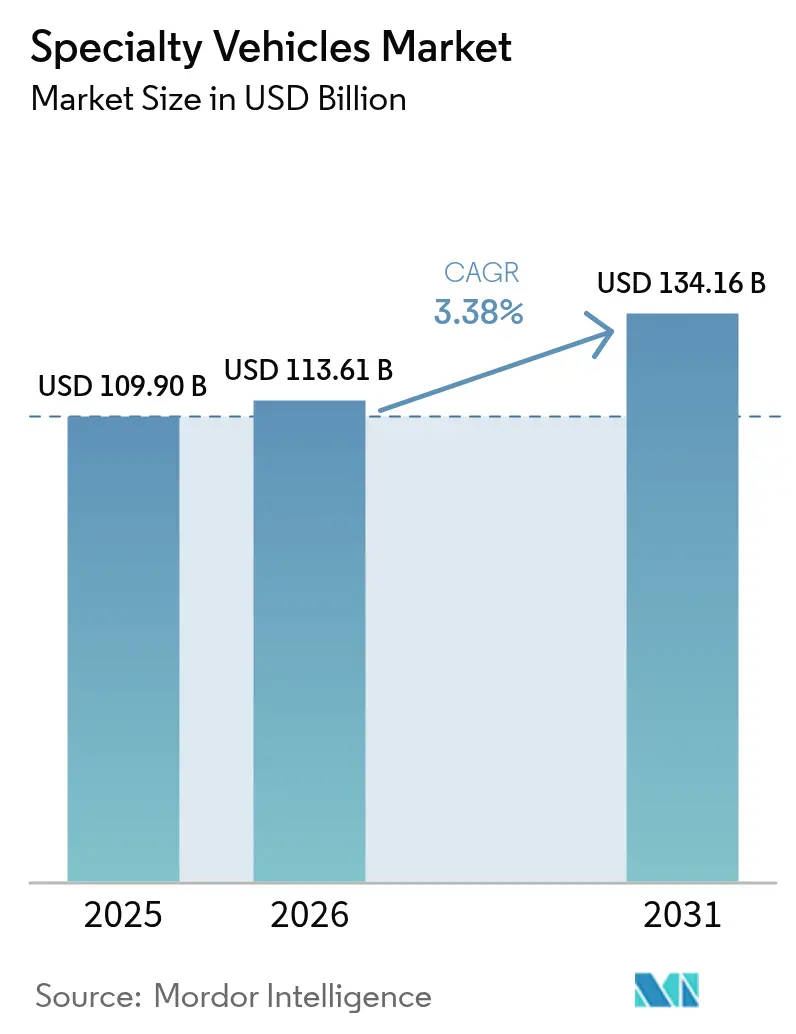
| Market Size (2026) | USD 113.61 Billion |
| Market Size (2031) | USD 134.16 Billion |
| Growth Rate (2026 - 2031) | 3.38% CAGR |
| Fastest Growing Market | Asia Pacific |
| Largest Market | Asia Pacific |
| Market Concentration | Medium |
Major Players *Disclaimer: Major Players sorted in no particular order Image © Mordor Intelligence. Reuse requires attribution under CC BY 4.0. | |
Specialty Vehicles Market Analysis by Mordor Intelligence
The specialty vehicles market size is projected to expand from USD 109.90 billion in 2025 and USD 113.61 billion in 2026 to USD 134.16 billion by 2031, registering a CAGR of 3.38% between 2026 and 2031. Electrification mandates, municipal funding programs covering up to 80% of battery-related costs, and the swift deployment of 5G telematics are reshaping procurement standards in the specialty vehicles market. Municipal buyers are hastening diesel fleet retirements to meet urban emission zone regulations. In contrast, private operators are leaning towards leasing models that not only shorten refresh cycles but also mitigate residual-value risks. With battery energy density now exceeding 250 Wh/kg, the choice of propulsion is expanding beyond diesel. This advancement enables electric aerial ladder trucks to operate 12-hour shifts without the need for mid-day charging. While Asia-Pacific continues to lead in volume, North America is making the most pronounced shift towards zero-emission units, driven by the U.S. Environmental Protection Agency’s Clean Heavy-Duty Vehicle Program.
Key Report Takeaways
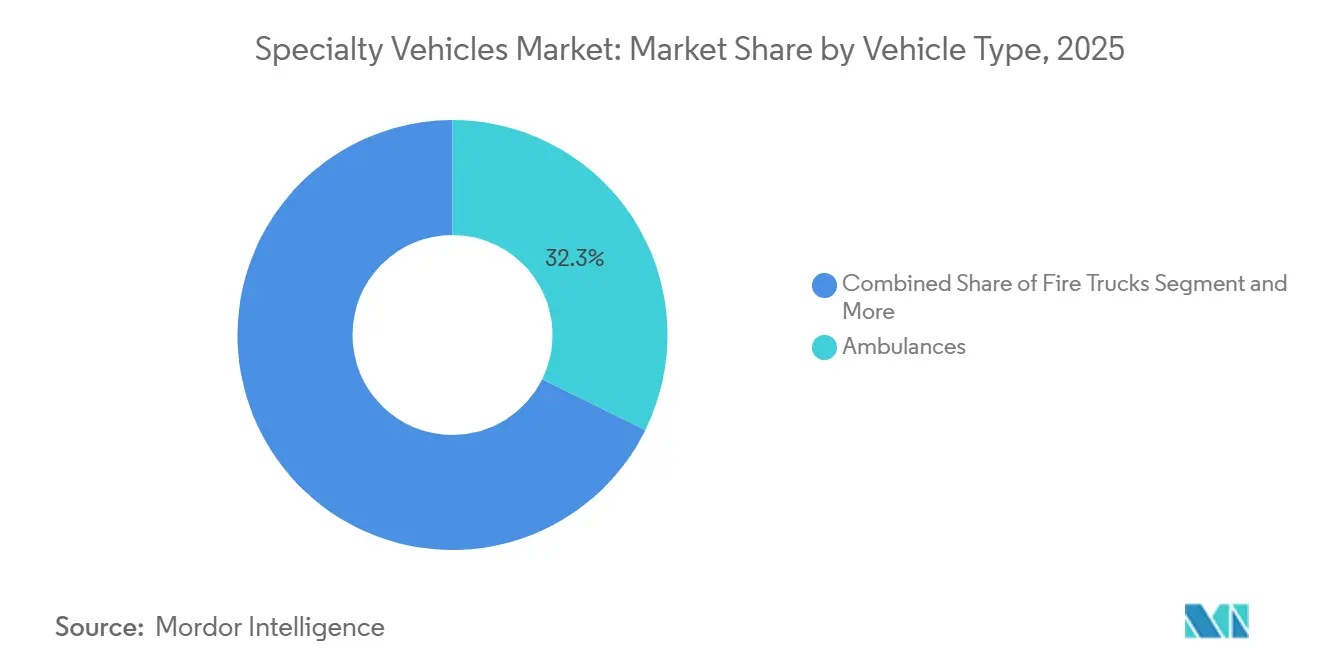
- By vehicle type, ambulances led with 32.28% of the specialty vehicles market share in 2025, whereas mobile medical clinics are advancing at a 5.46% CAGR to 2031.
- By application, healthcare services held 37.19% of 2025 revenue, while recreational and hospitality vehicles are forecast to expand at a 4.21% CAGR through 2031.
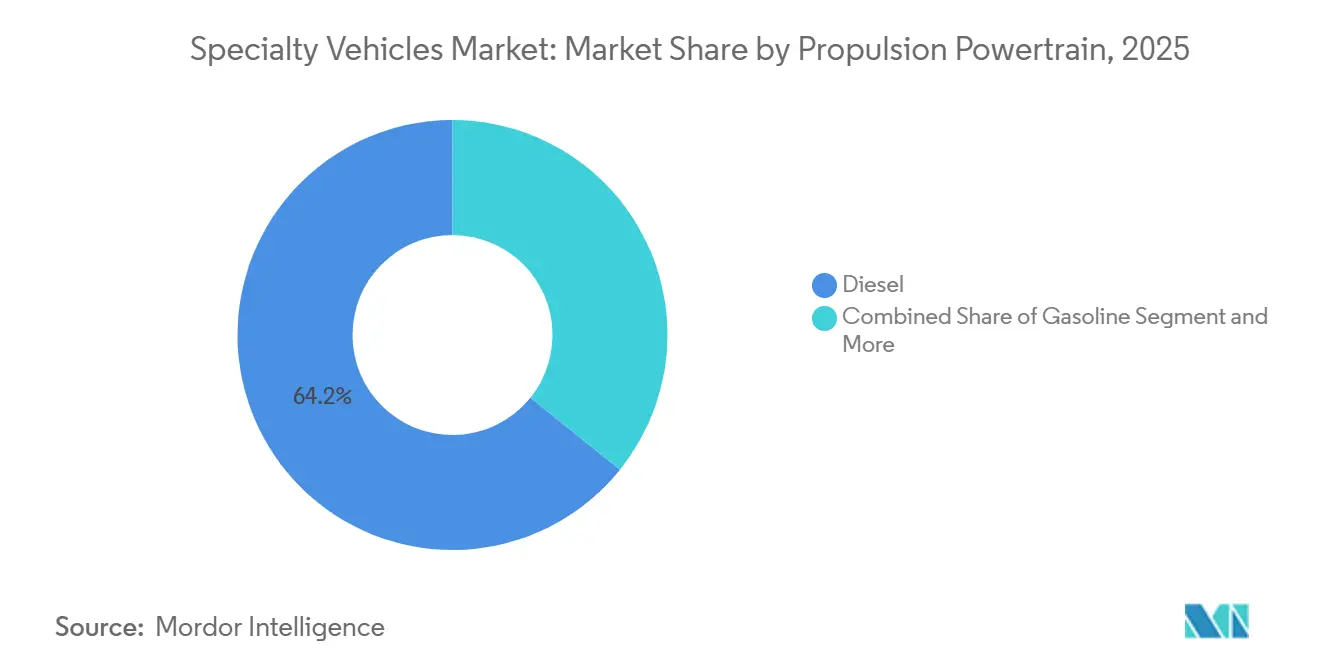
- By propulsion, diesel commanded 64.22% of the specialty vehicles market size in 2025, yet electric variants are projected to grow at 7.89% annually over 2026-2031.
- By ownership model, government fleets captured 49.25% of 2025 revenue, whereas rental and leasing are set to post a 4.78% CAGR to 2031.
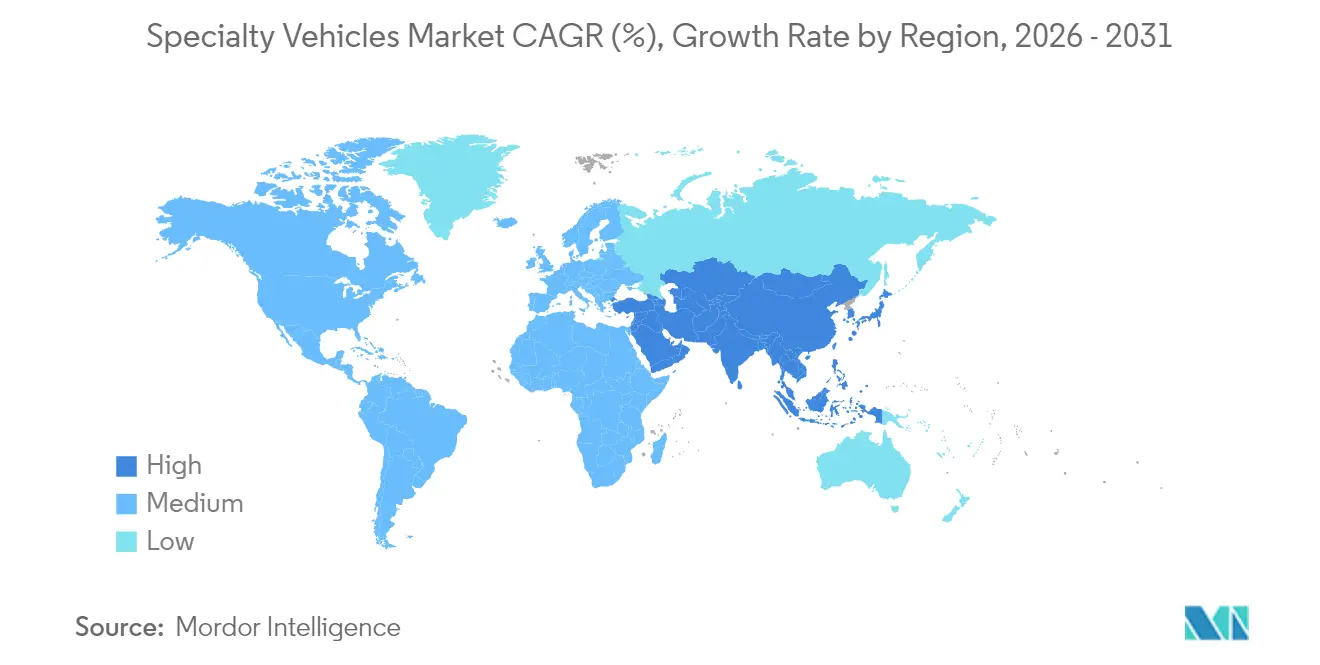
- By geography, Asia-Pacific accounted for 36.73% of 2025 revenue and is poised for a 3.91% CAGR, the fastest regional pace.
Note: Market size and forecast figures in this report are generated using Mordor Intelligence’s proprietary estimation framework, updated with the latest available data and insights as of 2026.
Global Specialty Vehicles Market Trends and Insights
Drivers Impact Analysis*
| Driver | (~) % Impact on CAGR Forecast | Geographic Relevance | Impact Timeline |
|---|---|---|---|
| Incentives Boost Zero-Emission Fleets | +0.9% | North America and EU, pilot programs in China and India | Long term (≥ 4 years) |
| Demand Rises for Emergency Vehicles | +0.8% | Global, with concentration in Asia-Pacific and North America | Medium term (2-4 years) |
| Growth in Construction and Mining Fleets | +0.6% | Asia-Pacific core, spill-over to Middle East and Africa | Short term (≤ 2 years) |
| Expansion of Mobile Industrial Services | +0.5% | North America and Europe, emerging in ASEAN | Medium term (2-4 years) |
| 5G Platforms Enable Remote Operations | +0.4% | Global, early adoption in North America and South Korea | Long term (≥ 4 years) |
| Modular Chassis Cut Lead-Time | +0.3% | Global, strongest uptake in North America and Europe | Medium term (2-4 years) |
| Source: Mordor Intelligence | |||


Government Incentives for Zero-Emission Specialty Fleets
Fiscal stimuli offset hefty battery premiums. The EPA’s 2024 Clean Heavy-Duty Vehicle Program allocated USD 932 million to cover 80% of the electric upgrade costs for fire trucks and ambulances. California's EnergIIZE rebates significantly reduce the purchase prices of electric ambulances, promoting their adoption. Meanwhile, Europe, under its Green Deal, has allocated substantial funding for municipal electrification, driving procurement activity before the incentives phase out.
Rising Demand for Emergency Medical Response Vehicles
Population aging and post-pandemic investment spur ambulance orders that exceed mere replacement cycles. The United States allocated funds through FEMA's Assistance to Firefighters Grant, with a portion designated for ambulances to extend chassis life through remounts. India's ambulance network has seen significant growth, enhancing its capacity to serve the population. California municipalities have adopted electric Type I ambulances, achieving notable cost savings in total ownership compared to diesel, particularly when leveraging off-peak electricity rates. Urban agencies are increasingly prioritizing battery-electric orders to meet carbon reduction targets, while rural operators continue to prefer diesel for its extended range, reflecting a divergence in procurement trends within the specialty vehicles market.
Growth in Construction and Mining Service Fleets
Infrastructure mega-projects and resource extraction ventures are extending the specialty vehicle market’s reach into rugged environments. The U.S. Infrastructure Investment and Jobs Act earmarked USD 1.2 trillion over five fiscal years (2022–2026), underpinning demand for mobile fuel tankers, service bodies, and onsite command centers [1]“Infrastructure Investment and Jobs Act Funding Allocations,” U.S. Department of Transportation, transportation.gov. China’s Belt and Road Initiative similarly keeps specialty service fleets active across Asia-Pacific and Africa. Stricter safety rules now require vehicles outfitted with dust-suppression systems, real-time telematics, and emergency shelters. Remote mines use mobile environmental monitoring labs to meet ESG commitments. Although construction cycles remain sensitive to macroeconomic swings, the replacement of aging fleets ensures a baseline of annual demand.
Expansion of Mobile On-Site Industrial Services
Lean manufacturing strategies push maintenance and refueling services directly to customer premises. Fleet refueler specialist Kraft Tank scaled capacity in 2024 to meet rising orders for 7.5-kL mobile tankers that eliminate depot trips. Utilities dispatch mobile grid-repair units equipped with 5G-linked diagnostics that shorten outage duration. Predictive analytics from industrial IoT platforms alert service providers, who then roll advanced repair trucks to prevent unplanned downtime. Renewable-energy installations drive new sub-segments, including blade-inspection vehicles for wind farms and solar-panel cleaning rigs. Higher service quality and reduced facility footprints justify recurring investment in these specialty assets.
Restraint Impact Analysis*
| Restraint | (~) % Impact on CAGR Forecast | Geographic Relevance | Impact Timeline |
|---|---|---|---|
| High Acquisition and Lifecycle Costs | -0.7% | Global, most pronounced in cost-sensitive emerging markets | Long term (≥ 4 years) |
| Multi-Jurisdictional Regulatory Approvals | -0.4% | Global, particularly challenging in fragmented regulatory environments | Medium term (2-4 years) |
| Skilled Labor Shortages | -0.3% | North America and EU, emerging in Asia-Pacific manufacturing hubs | Short term (≤ 2 years) |
| Long Lead-Times for Critical Components | -0.2% | Global supply chains, concentrated impact on specialized manufacturers | Medium term (2-4 years) |
| Source: Mordor Intelligence | |||
High Acquisition and Lifecycle Costs
Organizations are feeling the financial pinch as specialty units, priced significantly higher than standard trucks, strain their budgets. Battery-electric ambulances come with a hefty price tag, outpacing their diesel counterparts. Fire ladders, too, often necessitate extended financing schemes due to their steep costs. Additionally, the recurring need for high-voltage technician training mandated by NFPA 70E not only increases operational expenses but also requires organizations to allocate resources for continuous skill development. These combined factors intensify the financial challenges faced by these organizations, making it increasingly difficult to manage budgets effectively.
Complex Multi-Jurisdictional Regulatory Approvals
An ambulance sold in the United States must meet the National Fire Protection Association, Federal Motor Vehicle Safety Standards, and discrete state certifications, extending validation to several months for new configurations [2]“FMVSS 121 Air Brake Systems,”, National Highway Traffic Safety Administration, NHTSA.gov. Fire trucks face a complex array of regulations, ranging from FMVSS air-brake standards to NFPA pump metrics, as well as state-specific diesel filter requirements. In Europe, manufacturers must also comply with ECE battery safety standards and country-specific siren frequency regulations, which significantly increase the time and resources needed for compliance. Additionally, differing hydrogen storage limits across regions, such as Japan and parts of Europe, further complicate product design and development. These overlapping, region-specific rules create substantial challenges for manufacturers, requiring meticulous planning and adaptation to meet diverse regulatory requirements [3]“Hydrogen Fuel Systems Pressure Guidelines,”, International Organization for Standardization, ISO.org.
*Our forecasts treat driver/restraint impacts as directional, not additive. The impact forecasts reflect baseline growth, mix effects, and variable interactions.
Segment Analysis
By Vehicle Type: Medical Vehicles Sustain Leadership
Ambulances accounted for 32.28% of 2025 revenue in the specialty vehicles market share, buoyed by EMS expansion across Asia-Pacific and North America. Mobile medical clinics, however, are slated for a 5.46% CAGR through 2031, the fastest growth among vehicle categories, propelled by rural telehealth rollouts.
REV Group's modular skateboard chassis is transforming the specialty vehicles sector by offering unparalleled adaptability. This innovative platform can seamlessly transition to support ambulance, clinic, or utility fleets, providing fleet operators with operational flexibility previously unattainable. However, full platform convergence faces challenges due to differing crashworthiness standards. Ambulances must adhere to NFPA 1917 regulations, while fire apparatus are governed by NFPA 1901 standards, creating a barrier to complete standardization. Additionally, while diesel engines continue to dominate in larger rural ambulances due to their reliability and range, urban fleets are increasingly adopting electric models to align with stringent zero-emission requirements and sustainability goals.


By Application: Healthcare Dominates, Recreation Gains Momentum
Healthcare services accounted for 37.19% of specialty vehicle market revenue in 2025, driven by demographic pressures and systemic investment. Recreational and hospitality vehicles, though smaller, are set to outpace the market at a 4.21% CAGR, mirroring the rebound in live events and brand activations. The specialty vehicles market share for hospitality applications is expected to grow significantly during the forecast period.
Luxury mobile lounges and road-show platforms are increasingly attracting corporate budgets that were traditionally allocated to static venues. Leading automotive brands have introduced mobile showrooms across various regions, delivering enhanced customer engagement and interaction. In industrial applications, utilities are integrating advanced inventory tracking systems into field trucks, significantly reducing repair downtime and demonstrating the practical benefits and efficiency of telematics solutions.
By Propulsion/Powertrain: Electric Builds Pace Against Diesel Core
Diesel retained 64.22% of the 2025 specialty-vehicle market share, anchored by remote-area operations. Electric powertrains, though smaller in volume, will rise at a 7.89% CAGR through 2031, driven by battery energy densities above 250 Wh/kg. Driven by municipal emission policies, the market for electric specialty vehicles is expected to grow significantly in the coming years.
Pierce's Volterra pumper and Rosenbauer's RT ladder, both equipped with advanced range and fast-charging capabilities, are setting new benchmarks in the industry by achieving cost efficiency in high-utilization scenarios. Meanwhile, hydrogen technology remains in its experimental stage, with adoption hindered by high costs and limited refueling infrastructure, which continue to pose challenges for widespread implementation.
By Ownership Model: Government Holds Sway, Leasing Surges
Government and municipal fleets controlled 49.25% of 2025 revenue in the specialty vehicles market, reflecting their statutory role in emergency response. Leasing, however, is expanding at 4.78% annually as operators crave balance-sheet agility. The specialty vehicles market under leasing structures is anticipated to grow significantly, driven by evolving industry dynamics and increasing demand for flexible vehicle solutions.
Enterprise Fleet Management integrates swap-body clauses in a notable portion of its contracts, enabling efficient seasonal vehicle repurposing. Regulatory frameworks, such as the "Buy America" rules, create complexities for leasing companies relying on non-domestic chassis, pushing them to collaborate more with domestic OEMs. Private construction fleets tend to prefer outright purchases when vehicle utilization is consistently high, while providers of intermittent services favor rentals to mitigate risks associated with depreciation.
Geography Analysis
Asia-Pacific accounted for 36.73% of the 2025 specialty vehicles market revenue and is projected to grow at a 3.91% CAGR through 2031, the fastest among regions. In China and India, significant investments in infrastructure and expansions of ambulance networks are leading the way. To support extensive transport projects, China is experiencing a growing demand for additional service vehicles. Urban emission regulations are pushing Tier-1 cities to transition to electric fire apparatuses, while Japan is focusing on enhancing mobile clinics to address the healthcare needs of its aging rural population.
North America plays a significant role in the market, supported by federal electrification initiatives and the development of a robust leasing ecosystem. Subsidies have driven a notable increase in electric emergency vehicle registrations in key states like California. However, the region faces challenges due to labor shortages among custom up-fitters, which have extended build cycles and impacted production timelines. Europe, shaped by stringent emission standards and sustainability-focused funding, has emerged as a key player in the market. Countries such as Germany, the United Kingdom, and France have made substantial investments in electric emergency vehicles. Cities like London are actively replacing diesel command units with low-emission alternatives, reflecting the growing emphasis on reducing urban pollution through the implementation of Low Emission Zones.
South America, the Middle East, and Africa exhibit diverse market dynamics. Brazil has prioritized investments in ambulances, particularly in underserved regions such as the Amazon. In the Middle East, projects like Saudi Arabia's NEOM are driving demand for high-end electric fire trucks, showcasing a niche market segment. However, in areas where charging infrastructure remains underdeveloped, diesel vehicles continue to dominate the market.

Competitive Landscape
The specialty vehicle industry shows moderate concentration. Established names like REV Group, Oshkosh Corporation, and Rosenbauer, drawing on decades of regulatory expertise and extensive dealer networks, are using vertically integrated body-building techniques to safeguard their market share. In Q1 2025, REV Group reported a revenue of USD 525.1 million, underscoring the advantages of its diverse brand portfolio.
With the push towards electrification, new players like Arrival, Lion Electric, and the Nikola-Rosenbauer joint venture are entering the fray, promoting their modular battery packs and software-driven vehicle controls. Their nimble engineering processes align well with city agencies striving to achieve climate objectives. In response, traditional players, once focused on diesel, are either launching their own e-chassis or collaborating with battery experts. Aspects such as connected diagnostics, autonomous parking, and over-the-air updates are becoming essential contract stipulations, underscoring the growing importance of intellectual property.
Mergers and private-equity acquisitions are increasingly targeting specialized up-fitters, aiming to create comprehensive solution portfolios. Patents on modular frames from Scania and ecosystem filings from Ford indicate that mainstream truck manufacturers are deepening their presence in this niche. Today's customers prioritize long-term support and digital features over merely the lowest initial price, favoring vendors who combine robust hardware with data-backed uptime assurances. The competitive landscape now revolves around the ability to offer certified zero-emission platforms priced competitively with diesel counterparts, while ensuring dependable, mission-ready performance.
Specialty Vehicles Industry Leaders
REV Group
Daimler Truck AG (Mercedes-Benz Special Trucks)
Oshkosh Corporation
Volvo Group
Shyft Group
- *Disclaimer: Major Players sorted in no particular order


Recent Industry Developments
- July 2025: Medix Specialty Vehicles has introduced a new Ford F-450/550 SuperCab chassis option for its MSV-II 157 Type I ambulance, enhancing flexibility. This addition provides EMS and Fire teams with a broader workspace across various care environments, underscoring Medix's commitment to delivering solutions that address real-world operational challenges.
- February 2025: Shell Oman launched the country’s first 7.5-kL mobile fuel tanker equipped with advanced safety and telemetry features.
- January 2025: Force Motors Limited, a leading Indian manufacturer of commercial and specialty vehicles, has secured a contract from the Health Department of the Uttar Pradesh Government to deliver 2,429 ambulances.


Global Specialty Vehicles Market Report Scope
The scope includes segmentation by vehicle type (ambulances, fire trucks, mobile fuel tankers, mobile command and control centers, mobile medical clinics, and others), application (law enforcement and public safety, medical and healthcare services, industrial and utility services, recreational and hospitality, and others), propulsion/powertrain (diesel, gasoline, hybrid, electric, and alternative fuels (CNG / LNG / H₂)), and ownership model (government and municipal, private fleet operators, and rental/leasing). The analysis also covers regional-level segmentation, including North America, South America, Europe, Asia-Pacific, and the Middle East and Africa. Market size and growth forecasts are presented by value in USD and volume in units.
| Ambulances |
| Fire Trucks |
| Mobile Fuel Tankers |
| Mobile Command and Control Centers |
| Mobile Medical Clinics |
| Others |
| Law Enforcement and Public Safety |
| Medical and Healthcare Services |
| Industrial and Utility Services |
| Recreational and Hospitality |
| Others |
| Diesel |
| Gasoline |
| Hybrid |
| Electric |
| Alternative Fuels (CNG / LNG / H₂) |
| Government and Municipal |
| Private Fleet Operators |
| Rental / Leasing |
| North America | United States |
| Canada | |
| Rest of North America | |
| South America | Brazil |
| Argentina | |
| Rest of South America | |
| Europe | Germany |
| United Kingdom | |
| France | |
| Italy | |
| Spain | |
| Russia | |
| Rest of Europe | |
| Asia-Pacific | China |
| India | |
| Japan | |
| South Korea | |
| Australia and New Zealand | |
| Rest of Asia-Pacific | |
| Middle East and Africa | Saudi Arabia |
| United Arab Emirates | |
| Morocco | |
| South Africa | |
| Rest of Middle East and Africa |
| By Vehicle Type | Ambulances | |
| Fire Trucks | ||
| Mobile Fuel Tankers | ||
| Mobile Command and Control Centers | ||
| Mobile Medical Clinics | ||
| Others | ||
| By Application | Law Enforcement and Public Safety | |
| Medical and Healthcare Services | ||
| Industrial and Utility Services | ||
| Recreational and Hospitality | ||
| Others | ||
| By Propulsion / Powertrain | Diesel | |
| Gasoline | ||
| Hybrid | ||
| Electric | ||
| Alternative Fuels (CNG / LNG / H₂) | ||
| By Ownership Model | Government and Municipal | |
| Private Fleet Operators | ||
| Rental / Leasing | ||
| By Geography | North America | United States |
| Canada | ||
| Rest of North America | ||
| South America | Brazil | |
| Argentina | ||
| Rest of South America | ||
| Europe | Germany | |
| United Kingdom | ||
| France | ||
| Italy | ||
| Spain | ||
| Russia | ||
| Rest of Europe | ||
| Asia-Pacific | China | |
| India | ||
| Japan | ||
| South Korea | ||
| Australia and New Zealand | ||
| Rest of Asia-Pacific | ||
| Middle East and Africa | Saudi Arabia | |
| United Arab Emirates | ||
| Morocco | ||
| South Africa | ||
| Rest of Middle East and Africa | ||


Key Questions Answered in the Report
How large will the specialty vehicles market be by 2031?
It is forecast to reach USD 134.16 billion by 2031, growing at a 3.38% CAGR from 2026 to 2031.
Which vehicle type leads revenue today?
Ambulances held the largest share at 32.28% of 2025 revenue.
What drives the fastest growth within applications?
Recreational and hospitality vehicles are projected to expand at a 4.21% CAGR through 2031.
Why are leasing models gaining traction?
Operators prefer leasing to manage technology refresh risk and avoid large upfront capital outlays.
Which region is growing the fastest?
Asia-Pacific is poised for the highest regional CAGR at 3.91% through 2031.
Page last updated on:


