Market Overview
| Study Period | 2017 - 2029 |
|---|---|
| Forecast Data Period | 2025 - 2029 |
| Historical Data Period | 2017 - 2023 |
| Market Size (2025) | USD 72.71 Billion |
| Market Size (2029) | USD 176.8 Billion |
| Growth Rate (2025 - 2029) | 24.87% CAGR |
| Market Concentration | Low |
Major Players*Disclaimer: Major Players sorted in no particular order Image © Mordor Intelligence. Reuse requires attribution under CC BY 4.0. | |

Electric Light Commercial Vehicles Market Analysis by Mordor Intelligence
The Electric Light Commercial Vehicles Market size is estimated at 72.71 billion USD in 2025, and is expected to reach 176.8 billion USD by 2029, growing at a CAGR of 24.87% during the forecast period (2025-2029).
The global electric light commercial vehicles industry is experiencing transformative growth, driven by the convergence of e-commerce expansion and evolving transportation needs. The surge in online retail activities has fundamentally altered logistics and delivery requirements, creating unprecedented demand for sustainable light commercial vehicle solutions. This shift is evidenced by the substantial increase in global light commercial vehicle production, which reached 18,593.85 thousand units in 2021, reflecting the industry's response to changing market dynamics. The e-commerce sector's remarkable growth, generating USD 26.7 trillion in revenue in 2021, has become a crucial catalyst for the electric LCV market's expansion, as businesses increasingly prioritize efficient and environmentally conscious delivery solutions.
Major automotive manufacturers are strategically repositioning themselves to capitalize on the growing demand for electric commercial vehicles. Ford's announcement in March 2022 to introduce four new commercial electric vehicles by 2024, including the Transit Custom one-ton van and Tourneo Custom multi-purpose vehicle, exemplifies this industry-wide transformation. Similarly, Kia Motors' strategic entry into the electric pickup truck segment, with two models planned for release by 2027, demonstrates the industry's commitment to expanding electric vehicle offerings across various commercial vehicle categories. These developments signify a broader industry shift towards comprehensive electrification of commercial fleets.
Governments worldwide are implementing increasingly stringent environmental regulations and supportive policies to accelerate the transition to electric vehicles. Notable initiatives include the establishment of phase-out targets for petrol and diesel vehicles by 2040 in major markets such as China, India, France, and the United Kingdom. These regulatory frameworks are complemented by various incentive programs, infrastructure development initiatives, and public-private partnerships aimed at facilitating the adoption of electric light commercial vehicles. The alignment of governmental policies with industry initiatives is creating a favorable environment for market expansion.
The market is witnessing significant technological advancements in vehicle design, battery efficiency, and charging infrastructure. Manufacturers are investing heavily in research and development to enhance vehicle range, reduce charging times, and improve overall performance capabilities. The integration of smart technologies, advanced driver assistance systems, and connected vehicle features is elevating the operational efficiency of electric LCVs. These technological improvements, coupled with decreasing battery costs and expanding charging networks, are addressing previous adoption barriers and making electric commercial vehicles increasingly attractive for businesses across various sectors.
Global Electric Light Commercial Vehicles Market Trends and Insights
The rising global demand and government support propel electric vehicle market growth
- Electric vehicles (EVs) have become indispensable in the automotive industry, driven by their potential to enhance energy efficiency and reduce greenhouse gas and pollution emissions. This surge is primarily attributed to growing environmental concerns and supportive government initiatives. Notably, global EV sales witnessed a robust 10.82% growth in 2022 compared to 2021. Projections indicate that annual sales of electric passenger cars will surpass 5 million by the end of 2025, accounting for approximately 15% of total vehicle sales.
- Leading manufacturers and organizations, like the London Metropolitan Police & Fire Service, have been actively pursuing their electric mobility strategies. For instance, they have set a target of a zero-emission fleet by 2025, with a goal of electrifying 40% of their vans by 2030 and achieving full electrification by 2040. Similar trends are expected globally, with the period from 2024 to 2030 witnessing a surge in demand and sales of electric vehicles.
- Asia-Pacific and Europe are poised to dominate electric vehicle production, driven by their advancements in battery technology and vehicle electrification. In May 2020, Kia Motors Europe unveiled its "Plan S," signaling a strategic shift toward electrification. This decision came on the heels of record-breaking sales of Kia's EVs in Europe. Kia has ambitious plans to introduce 11 EV models globally by 2025, spanning various segments like passenger vehicles, SUVs, and MPVs. The company aims to achieve annual global EV sales of 500,000 by 2026.


OTHER KEY INDUSTRY TRENDS COVERED IN THE REPORT
- Africa's demographic evolution demonstrates consistent growth with a notable acceleration in recent years
- Several European countries are facing population declines, while others are growing, indicating a need for targeted policy interventions
- North America's demographic story highlights steady growth and adaptability, with each nation contributing uniquely to the region's vibrant mosaic, underlining its continued global significance
- Despite a GDP per capita decline in 2022-2023, Africa shows potential for future economic stability through trade agreements and infrastructure development
- Europe's GDP per capita is on track for steady growth, reflecting resilience and strategic policies
- Despite challenges in 2020, by 2023, the US experienced growth, Mexico displayed a robust recovery, while Canada witnessed a dip
- South Africa's consumer vehicle population shows signs of stabilization
- European countries are experiencing growth in CVP, driven by government incentives for eco-friendly vehicles
- North America exhibits diverse trends in CVP, with Canada experiencing a slight decrease, the US seeing an increase, and Mexico showing significant growth
- South Africa, Kenya, and Morocco exhibit declining inflation rates, while Nigeria faces a sharp inflation increase
- Europe is poised for economic stability, with concerted efforts to manage inflation and foster a balanced economic landscape
- From 2017 to 2023, North America, particularly countries like the US and Canada, navigated inflationary spikes, especially post-pandemic in 2022
- Auto interest rates across Africa, Asia-Pacific, and North America showed significant regional diversity, influenced by a combination of economic policies, market dynamics, and global conditions
- Battery pack prices in Africa continued to decline from USD 186 in 2022 to USD 176 in 2023, driven by technological advancements and increased market competition
- Declining battery prices and government initiatives drive demand for electric vehicles in Europe
- Declining prices of lithium-ion batteries drive the demand for electric vehicles in North America
- The global automotive industry will undergo a transformative phase, with a pronounced shift toward electrification from 2023 to 2025, followed by a period of refinement and consolidation in the subsequent years
- Asia-Pacific is witnessing a resurgence in the logistics performance index, driven by infrastructural developments and technological advancements
- The Middle East, led by the UAE, Saudi Arabia, and Qatar, invested in logistics infrastructure and technology despite challenges from geopolitical tensions
- South America's diverse landscape and resources pose unique logistics challenges
- The auto industry's production landscape is witnessing a dramatic shift, with electric vehicle manufacturers like BYD Auto and Tesla seeing remarkable growth while traditional giants like GM adapt to changing market demands
- Countries like Australia, India, and Indonesia project a steady upward trajectory in GDP per capita, suggesting robust economic strategies and potential investment in the automotive industries
- Saudi Arabia and UAE, both pivotal nations in the Middle East, demonstrated population growth from 2017 to 2023. While there were slight dips for both countries in between, the overarching upward trend indicates their significant roles and attractions in the region
- South America's demographic narrative, represented by Brazil and Colombia, showcases a story of consistent growth, with Brazil experiencing a pronounced surge
- Asia-Pacific displays a panorama of economic evolution: from the relentless pursuits of emerging economies to the recalibrations of established ones, painting a picture of resilience, adaptation, and ambition
- Projections for the coming years indicate a steady growth trajectory for both the UAE's diversified sectors and its role as a regional business hub. This growth can be attributed to the country's focus on diversification efforts and strategic partnerships
- During 2017-2030, Brazil and Colombia displayed contrasting economic paths. While both faced downturns around 2020, Brazil's GDP per capita showed recovery by 2023, whereas Colombia witnessed a slight decline
- The Asia-Pacific's diverse consumer spending trends on vehicle purchases not only reflect the region's evolving economic conditions but also highlight the shifting consumer preferences and vehicular market dynamics across countries
- In the short term (2022-2023), Saudi Arabia maintained stable consumer spending for vehicle purchases, while the UAE experienced a slight decline, suggesting differing market dynamics
- Brazil and Colombia are expected to see an increase in consumer spending for vehicle purchases (CVP), indicating a recovering automotive market and growing consumer confidence
- Asia-Pacific’s varied inflation rates reflect the diverse economic challenges and responses of each nation, from battling pandemic-induced fluctuations to aiming for future stability through strategic economic policies
- From 2017 to 2030, the Middle East is expected to display varied inflationary patterns, with countries like Iran facing significant challenges, while others like Saudi Arabia and the UAE expected to show stability
- Projections indicate a trend toward economic stabilization and controlled inflation in the region, highlighting a concerted push to restore equilibrium and foster growth
- Global efforts to expand and enhance EV infrastructure are signaling a collective push toward electrification
- The demand for EVs in Asia-Pacific is fueled by falling battery prices
- The Middle East's battery market: A continuous descent in prices and promising energy trends
- South America’s surging demand for electric vehicle batteries: falling costs and strategic alliances
- Africa's vastness posed logistics challenges, yet hubs like South Africa and Kenya emerged strong. By 2023, initiatives like AfCFTA and infrastructure projects improved connectivity, but challenges remained
- Europe's advanced logistics, driven by the EU's open trade policies, has faced challenges like Brexit. With a focus on sustainability and technology in 2023, Europe was expected to remain a global logistics leader, poised for further innovation and adaptation
- North America has a diverse terrain that presents unique logistics challenges, but in 2023, the United States, Canada, and Mexico achieved high LPI rankings
- For over a year, Russia's invasion of Ukraine disrupted global crude oil and petroleum product markets
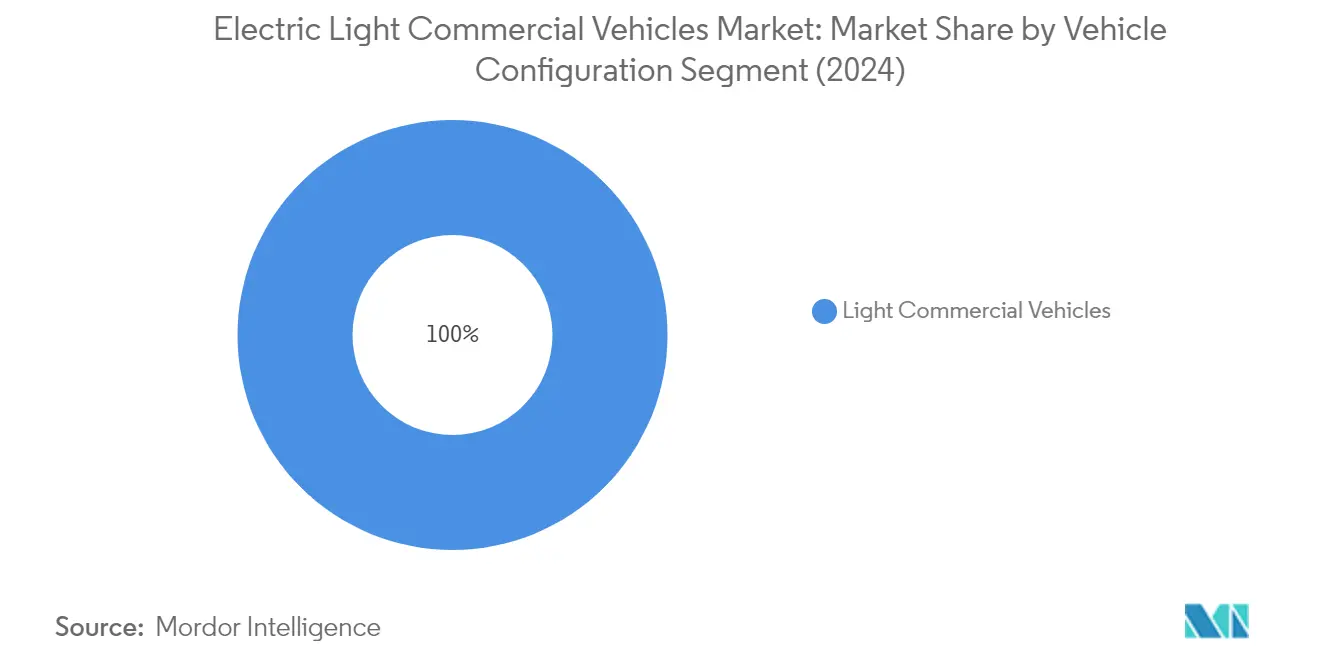
Segment Analysis: Vehicle Configuration
Light Commercial Vehicles Segment in Electric Light Commercial Vehicles Market
The Light Commercial Vehicles (LCV) segment dominates the global electric light commercial vehicles market, accounting for approximately 100% market share in 2024. This complete market dominance is driven by the increasing adoption of electric LCVs across various commercial applications, including last-mile delivery, urban logistics, and small-scale transportation needs. The segment's growth is further propelled by stringent emission regulations worldwide, particularly in regions like Europe and North America, where governments are actively promoting the transition to electric commercial vehicles. Additionally, advancements in battery technology, expanding charging infrastructure, and decreasing total cost of ownership are making electric LCVs increasingly attractive to fleet operators and businesses. The segment is experiencing robust growth due to the rising e-commerce sector and the subsequent demand for sustainable delivery solutions in urban areas. Major automotive manufacturers are expanding their electric LCV portfolios, introducing new models with improved range and payload capacity, further strengthening the segment's market position.

Segment Analysis: Fuel Category
BEV Segment in Electric Light Commercial Vehicles Market
Battery Electric Vehicles (BEVs) have emerged as the dominant force in the electric light commercial vehicles market, commanding approximately 71% of the market share in 2024. This substantial market presence is driven by significant technological advancements in battery technology, extensive government support through incentives and subsidies, and growing consumer preference for zero-emission vehicles. The segment's leadership position is further strengthened by the expanding charging infrastructure across major markets, making BEVs increasingly practical for commercial applications. Major automotive manufacturers are heavily investing in BEV technology, introducing new models with improved range, faster charging capabilities, and enhanced performance characteristics, solidifying BEVs' position as the preferred choice in the electric commercial vehicle sector.
FCEV Segment in Electric Light Commercial Vehicles Market
Fuel Cell Electric Vehicles (FCEVs) represent an emerging technology in the electric light commercial vehicles market, showing promising growth potential through 2024-2029. The segment's expansion is primarily driven by its unique advantages, including rapid refueling capabilities and longer operational range compared to traditional battery electric vehicles. Significant investments in hydrogen infrastructure development, particularly in regions like Europe and Asia-Pacific, are creating favorable conditions for FCEV adoption. The technology is gaining traction, especially in heavy-duty applications where long range and quick refueling are crucial. Major automotive manufacturers are increasingly investing in FCEV technology, recognizing its potential to complement BEVs in the commercial vehicle sector.
Remaining Segments in Fuel Category
The market also encompasses Hybrid Electric Vehicles (HEV) and Plug-in Hybrid Electric Vehicles (PHEV) segments, each serving distinct commercial transportation needs. HEVs continue to play a significant role in the transition towards full electrification, offering improved fuel efficiency without the range anxiety associated with pure electric vehicles. PHEVs bridge the gap between conventional hybrids and full electric vehicles, providing flexibility in operation with both electric and hybrid modes. These segments are particularly important in regions where charging infrastructure is still developing or in applications requiring extended range capabilities. Both technologies continue to evolve with improvements in battery technology and powertrain efficiency, maintaining their relevance in the commercial vehicle sector.
Electric Light Commercial Vehicles Market Geography Segment Analysis
Electric Light Commercial Vehicles Market in Africa
The African electric light commercial vehicles market is experiencing a transformative phase, driven by increasing environmental awareness and supportive government initiatives. While the region faces infrastructure challenges, there is growing recognition of the potential for electric light commercial vehicles to address both environmental concerns and operational cost efficiencies. South Africa leads the regional market with its well-established automotive industry and progressive policies promoting electric vehicle adoption. The country's robust charging infrastructure development and government incentives are creating a conducive environment for market growth. The rest of Africa is gradually embracing electric mobility solutions, with various countries implementing policies to encourage the transition to electric vehicles.
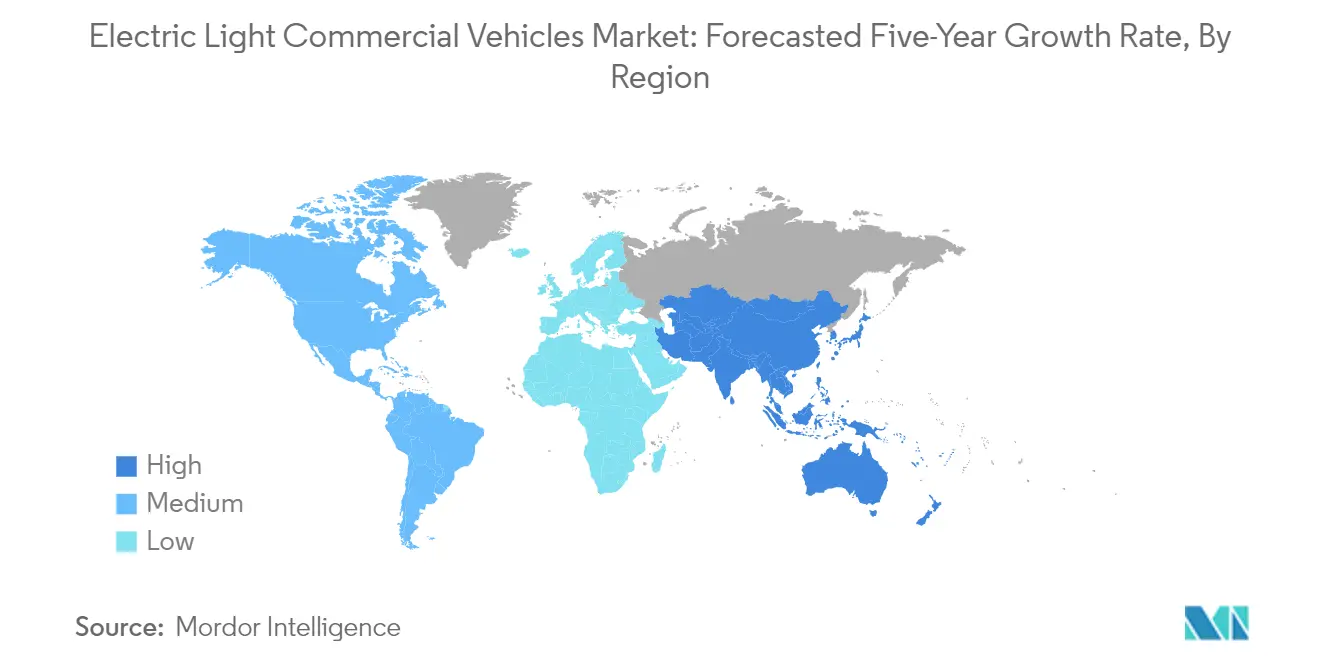
Electric Light Commercial Vehicles Market in Asia-Pacific
The Asia-Pacific region stands at the forefront of the global electric light commercial vehicles market, driven by strong government support, technological advancement, and increasing environmental consciousness. Countries like China, Japan, and India are leading the charge with comprehensive policies promoting electric vehicle adoption. The region's robust manufacturing capabilities, coupled with significant investments in charging infrastructure, create a favorable environment for market growth. The presence of major automotive manufacturers and their focus on electric vehicle development further strengthens the region's position in the global market.
Electric Light Commercial Vehicles Market in China
China dominates the Asia-Pacific electric light commercial vehicles market with approximately 30% market share in 2024. The country's leadership position is reinforced by its strong manufacturing base, extensive charging infrastructure, and comprehensive government support policies. Chinese manufacturers are continuously innovating and expanding their electric vehicle offerings, while significant investments in battery technology and production capabilities further strengthen the country's competitive position. The government's commitment to reducing emissions and promoting clean energy vehicles, coupled with favorable subsidies and incentives, continues to drive market growth.
Electric Light Commercial Vehicles Market in India
India emerges as the fastest-growing market in the Asia-Pacific region, with an expected growth rate of approximately 42% during 2024-2029. The country's rapid market expansion is fueled by increasing awareness of environmental sustainability, government initiatives promoting electric vehicle adoption, and growing demand from the e-commerce sector. India's push towards electric mobility is supported by policies such as FAME II (Faster Adoption and Manufacturing of Hybrid and Electric Vehicles) and various state-level incentives. The country's developing charging infrastructure and focus on localizing electric vehicle components are creating a strong foundation for sustained market growth.
Electric Light Commercial Vehicles Market in Europe
The European electric light commercial vehicles market demonstrates strong growth potential, supported by stringent emission regulations and comprehensive government support across the region. Countries such as Germany, France, and the UK are leading the market with well-developed charging infrastructure and strong incentive programs. The region's commitment to sustainability and carbon neutrality goals drives the adoption of electric commercial vehicles. The market benefits from the presence of established automotive manufacturers who are increasingly focusing on electric vehicle development and production.
Electric Light Commercial Vehicles Market in Germany
Germany maintains its position as the largest market for electric light commercial vehicles in Europe, leveraging its strong automotive manufacturing heritage and comprehensive support for electric mobility. The country's leadership is supported by robust charging infrastructure, significant research and development investments, and strong government incentives promoting electric vehicle adoption. German automotive manufacturers are at the forefront of electric vehicle innovation, continuously introducing new models and technologies to meet evolving market demands.
Electric Light Commercial Vehicles Market in Norway
Norway stands out as the fastest-growing market in Europe, demonstrating remarkable progress in electric vehicle adoption. The country's success is attributed to its comprehensive incentive system, well-developed charging infrastructure, and strong political commitment to sustainable transportation. Norway's progressive policies, including tax benefits and infrastructure development, create an ideal environment for electric vehicle market growth. The country's emphasis on renewable energy integration with electric mobility further strengthens its position as a leader in sustainable transportation.
Electric Light Commercial Vehicles Market in Middle East
The Middle Eastern electric light commercial vehicles market is witnessing significant transformation, driven by increasing environmental awareness and government initiatives to diversify from traditional fossil fuel dependence. Saudi Arabia emerges as both the largest and fastest-growing market in the region, supported by ambitious Vision 2030 goals and substantial investments in electric vehicle infrastructure. The region's focus on sustainable urban development and smart city initiatives creates favorable conditions for electric commercial vehicle adoption, while growing emphasis on reducing carbon emissions drives market expansion.
Electric Light Commercial Vehicles Market in North America
The North American electric light commercial vehicles market demonstrates robust growth, characterized by strong technological innovation and increasing adoption of sustainable transportation solutions. The United States leads the regional market, while Mexico shows the fastest growth potential. The region benefits from well-developed charging infrastructure, strong government incentives, and the presence of major automotive manufacturers investing heavily in electric vehicle technology. The market is further driven by corporate sustainability goals and increasing demand for efficient last-mile delivery solutions.
Electric Light Commercial Vehicles Market in South America
The South American electric light commercial vehicles market is gaining momentum, with Brazil emerging as both the largest and fastest-growing market in the region. The market's development is supported by increasing environmental consciousness, government initiatives promoting clean energy vehicles, and growing demand from the logistics sector. While infrastructure challenges persist, ongoing investments in charging networks and supportive policies are creating favorable conditions for market growth. The region's focus on reducing urban pollution and embracing sustainable transportation solutions continues to drive the adoption of electric commercial vehicles.

Competitive Landscape
Top Companies in Electric Light Commercial Vehicles Market
The electric light commercial vehicles market is characterized by intense competition among major automotive manufacturers who are rapidly advancing their electrification initiatives. Companies are heavily investing in research and development to enhance battery technology, improve vehicle range, and develop innovative charging solutions. Strategic partnerships and collaborations have become increasingly common, particularly in areas of battery production, charging infrastructure development, and technology sharing. Manufacturers are expanding their production facilities globally, with significant investments in new plants and the conversion of existing facilities to support electric vehicle manufacturing. Product portfolios are being diversified to include various configurations and specifications, catering to different commercial applications and market segments. The industry is witnessing a strong focus on sustainable practices and environmental considerations, with companies integrating these aspects into their manufacturing processes and supply chains.
Market Dominated by Established Automotive Giants
The electric commercial vehicles market exhibits a consolidated structure dominated by established global automotive manufacturers who have successfully leveraged their existing manufacturing capabilities, distribution networks, and brand reputation to establish strong positions in the electric vehicle segment. These major players are primarily large-scale automotive conglomerates with diverse product portfolios, substantial financial resources, and extensive research and development capabilities. The market has witnessed significant merger and acquisition activities, particularly focused on acquiring innovative technology startups, battery manufacturers, and charging infrastructure companies to strengthen technological capabilities and market presence.
The competitive landscape is further shaped by strategic alliances and joint ventures between automotive manufacturers, technology companies, and energy providers. These partnerships are crucial for sharing development costs, accessing new technologies, and expanding market reach. Regional players, particularly in Asia-Pacific, are gaining prominence through government support, local manufacturing advantages, and a deep understanding of regional market requirements. The market also sees increasing participation from new entrants, especially in emerging markets, who are focusing on specific vehicle segments or regional markets to establish their presence.
Innovation and Sustainability Drive Future Success
Success in the electric light commercial vehicles market increasingly depends on companies' ability to innovate while maintaining cost competitiveness. Incumbent manufacturers are focusing on vertical integration, particularly in battery production and charging infrastructure, to secure their supply chains and reduce dependencies on external suppliers. Companies are also investing in smart manufacturing technologies and digitalization to improve operational efficiency and reduce production costs. The development of comprehensive after-sales service networks and customer support systems has become crucial for maintaining market share and building customer loyalty.
For emerging players and contenders, success lies in identifying and exploiting niche market segments while building strategic partnerships to overcome resource limitations. Companies need to focus on developing specialized solutions for specific commercial applications, leveraging regional advantages, and building strong relationships with local stakeholders. The regulatory environment continues to play a crucial role, with companies needing to maintain flexibility in their strategies to adapt to evolving emission standards and government policies. Customer education and awareness programs, along with demonstration of total cost of ownership benefits, are becoming increasingly important for market expansion and penetration.
Electric Light Commercial Vehicles Industry Leaders
BAIC Motor Corporation Ltd.
Ford Motor Company
General Motors Company
Groupe Renault
Volkswagen AG
- *Disclaimer: Major Players sorted in no particular order


Recent Industry Developments
- August 2023: General Motors announced its plans to launch an all-electric Cadillac Escalade in late 2024.
- August 2023: General Motors doubled down on plans for an electric future in the Middle East.
- June 2023: General Motors invested CAD 280 million in the Oshawa plant for next-gen ICE full-size pickups.


Global Electric Light Commercial Vehicles Market Report Scope
Light Commercial Vehicles are covered as segments by Vehicle Configuration. BEV, FCEV, HEV, PHEV are covered as segments by Fuel Category. Africa, Asia-Pacific, Europe, Middle East, North America, South America are covered as segments by Region.Vehicle Configuration
| Light Commercial Vehicles |
Fuel Category
| BEV |
| FCEV |
| HEV |
| PHEV |
Region
| Africa | South Africa |
| Rest-of-Africa | |
| Asia-Pacific | Australia |
| China | |
| India | |
| Indonesia | |
| Japan | |
| Malaysia | |
| South Korea | |
| Thailand | |
| Rest-of-APAC | |
| Europe | Austria |
| Belgium | |
| Czech Republic | |
| Denmark | |
| Estonia | |
| France | |
| Germany | |
| Ireland | |
| Italy | |
| Latvia | |
| Lithuania | |
| Norway | |
| Poland | |
| Russia | |
| Spain | |
| Sweden | |
| UK | |
| Rest-of-Europe | |
| Middle East | Saudi Arabia |
| Rest-of-Middle East | |
| North America | Canada |
| Mexico | |
| US | |
| Rest-of-North America | |
| South America | Argentina |
| Brazil | |
| Rest-of-South America |
| Vehicle Configuration | Light Commercial Vehicles | |
| Fuel Category | BEV | |
| FCEV | ||
| HEV | ||
| PHEV | ||
| Region | Africa | South Africa |
| Rest-of-Africa | ||
| Asia-Pacific | Australia | |
| China | ||
| India | ||
| Indonesia | ||
| Japan | ||
| Malaysia | ||
| South Korea | ||
| Thailand | ||
| Rest-of-APAC | ||
| Europe | Austria | |
| Belgium | ||
| Czech Republic | ||
| Denmark | ||
| Estonia | ||
| France | ||
| Germany | ||
| Ireland | ||
| Italy | ||
| Latvia | ||
| Lithuania | ||
| Norway | ||
| Poland | ||
| Russia | ||
| Spain | ||
| Sweden | ||
| UK | ||
| Rest-of-Europe | ||
| Middle East | Saudi Arabia | |
| Rest-of-Middle East | ||
| North America | Canada | |
| Mexico | ||
| US | ||
| Rest-of-North America | ||
| South America | Argentina | |
| Brazil | ||
| Rest-of-South America | ||


Market Definition
- Vehicle Type - The category covers light commercial vehicle.
- Vehicle Body Type - This includes Light Commercial Pick-up Trucks and Light Commercial Vans.
- Fuel Category - The category exclusively covers electric propulsion systems, including various types such as HEV (Hybrid Electric Vehicles), PHEV (Plug-in Hybrid Electric Vehicles), BEV (Battery Electric Vehicles), and FCEV (Fuel Cell Electric Vehicles).
| Keyword | Definition |
|---|---|
| Electric Vehicle (EV) | A vehicle which uses one or more electric motors for propulsion. Includes cars, buses, and trucks. This term includes all-electric vehicles or battery electric vehicles and plug-in hybrid electric vehicles. |
| BEV | A BEV relies completely on a battery and a motor for propulsion. The battery in the vehicle must be charged by plugging it into an outlet or public charging station. BEVs do not have an ICE and hence are pollution-free. They have a low cost of operation and reduced engine noise as compared to conventional fuel engines. However, they have a shorter range and higher prices than their equivalent gasoline models. |
| PEV | A plug-in electric vehicle is an electric vehicle that can be externally charged and generally includes all-electric vehicles as well as plug-in hybrids. |
| Plug-in Hybrid EV | A vehicle that can be powered either by an ICE or an electric motor. In contrast to normal hybrid EVs, they can be charged externally. |
| Internal combustion engine | An engine in which the burning of fuels occurs in a confined space called a combustion chamber. Usually run with gasoline/petrol or diesel. |
| Hybrid EV | A vehicle powered by an ICE in combination with one or more electric motors that use energy stored in batteries. These are continually recharged with power from the ICE and regenerative braking. |
| Commercial Vehicles | Commercial vehicles are motorized road vehicles designed for transporting people or goods. The category includes light commercial vehicles (LCVs) and medium and heavy-duty vehicles (M&HCV). |
| Passenger Vehicles | Passenger cars are electric motor– or engine-driven vehicles with at least four wheels. These vehicles are used for the transport of passengers and comprise no more than eight seats in addition to the driver’s seat. |
| Light Commercial Vehicles | Commercial vehicles that weigh less than 6,000 lb (Class 1) and in the range of 6,001–10,000 lb (Class 2) are covered under this category. |
| M&HDT | Commercial vehicles that weigh in the range of 10,001–14,000 lb (Class 3), 14,001–16,000 lb (Class 4), 16,001–19,500 lb (Class 5), 19,501–26,000 lb (Class 6), 26,001–33,000 lb (Class 7) and above 33,001 lb (Class 8) are covered under this category. |
| Bus | A mode of transportation that typically refers to a large vehicle designed to carry passengers over long distances. This includes transit bus, school bus, shuttle bus, and trolleybuses. |
| Diesel | It includes vehicles that use diesel as their primary fuel. A diesel engine vehicle have a compression-ignited injection system rather than the spark-ignited system used by most gasoline vehicles. In such vehicles, fuel is injected into the combustion chamber and ignited by the high temperature achieved when gas is greatly compressed. |
| Gasoline | It includes vehicles that use gas/petrol as their primary fuel. A gasoline car typically uses a spark-ignited internal combustion engine. In such vehicles, fuel is injected into either the intake manifold or the combustion chamber, where it is combined with air, and the air/fuel mixture is ignited by the spark from a spark plug. |
| LPG | It includes vehicles that use LPG as their primary fuel. Both dedicated and bi-fuel LPG vehicles are considered under the scope of the study. |
| CNG | It includes vehicles that use CNG as their primary fuel. These are vehicles that operate like gasoline-powered vehicles with spark-ignited internal combustion engines. |
| HEV | All the electric vehicles that use batteries and an internal combustion engine (ICE) as their primary source for propulsion are considered under this category. HEVs generally use a diesel-electric powertrain and are also known as hybrid diesel-electric vehicles. An HEV converts the vehicle momentum (kinetic energy) into electricity that recharges the battery when the vehicle slows down or stops. The battery of HEV cannot be charged using plug-in devices. |
| PHEV | PHEVs are powered by a battery as well as an ICE. The battery can be charged through either regenerative breaking using the ICE or by plugging into some external charging source. PHEVs have a better range than BEVs but are comparatively less eco-friendly. |
| Hatchback | These are compact-sized cars with a hatch-type door provided at the rear end. |
| Sedan | These are usually two- or four-door passenger cars, with a separate area provided at the rear end for luggage. |
| SUV | Popularly known as SUVs, these cars come with four-wheel drive, and usually have high ground clearance. These cars can also be used as off-road vehicles. |
| MPV | These are multi-purpose vehicles (also called minivans) designed to carry a larger number of passengers. They carry between five and seven people and have room for luggage too. They are usually taller than the average family saloon car, to provide greater headroom and ease of access, and they are usually front-wheel drive. |


Research Methodology
Mordor Intelligence follows a four-step methodology in all its reports.
- Step-1: Identify Key Variables: To build a robust forecasting methodology, the variables and factors identified in Step-1 are tested against available historical market numbers. Through an iterative process, the variables required for market forecast are set and the model is built based on these variables.
- Step-2: Build a Market Model: Market-size estimations for the historical and forecast years have been provided in revenue and volume terms. Market revenue is calculated by multiplying the sales volume with their respective average selling price (ASP). While estimating ASP factors like average inflation, market demand shift, manufacturing cost, technological advancement, and varying consumer preference, among others have been taken into account.
- Step-3: Validate and Finalize: In this important step, all market numbers, variables, and analyst calls are validated through an extensive network of primary research experts from the market studied. The respondents are selected across levels and functions to generate a holistic picture of the market studied.
- Step-4: Research Outputs: Syndicated Reports, Custom Consulting Assignments, Databases & Subscription Platforms.


