Industrial Vehicles Market Size and Share
Market Overview
| Study Period | 2019 - 2030 |
|---|---|
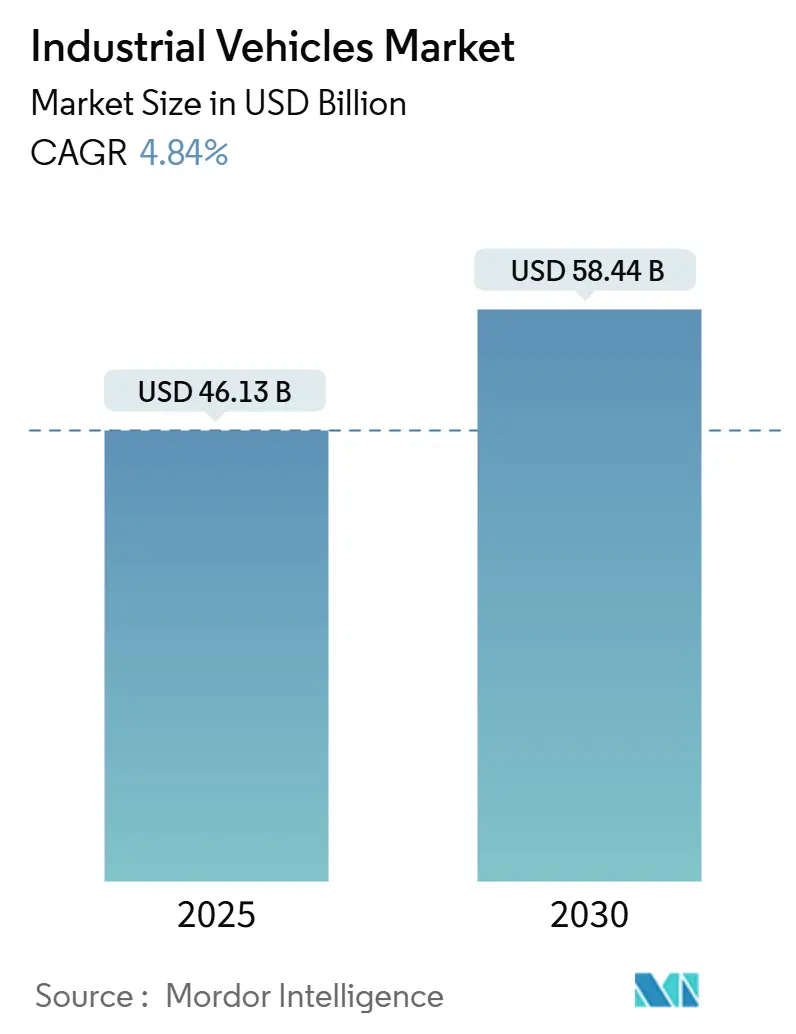
| Market Size (2025) | USD 46.13 Billion |
| Market Size (2030) | USD 58.44 Billion |
| Growth Rate (2025 - 2030) | 4.84% CAGR |
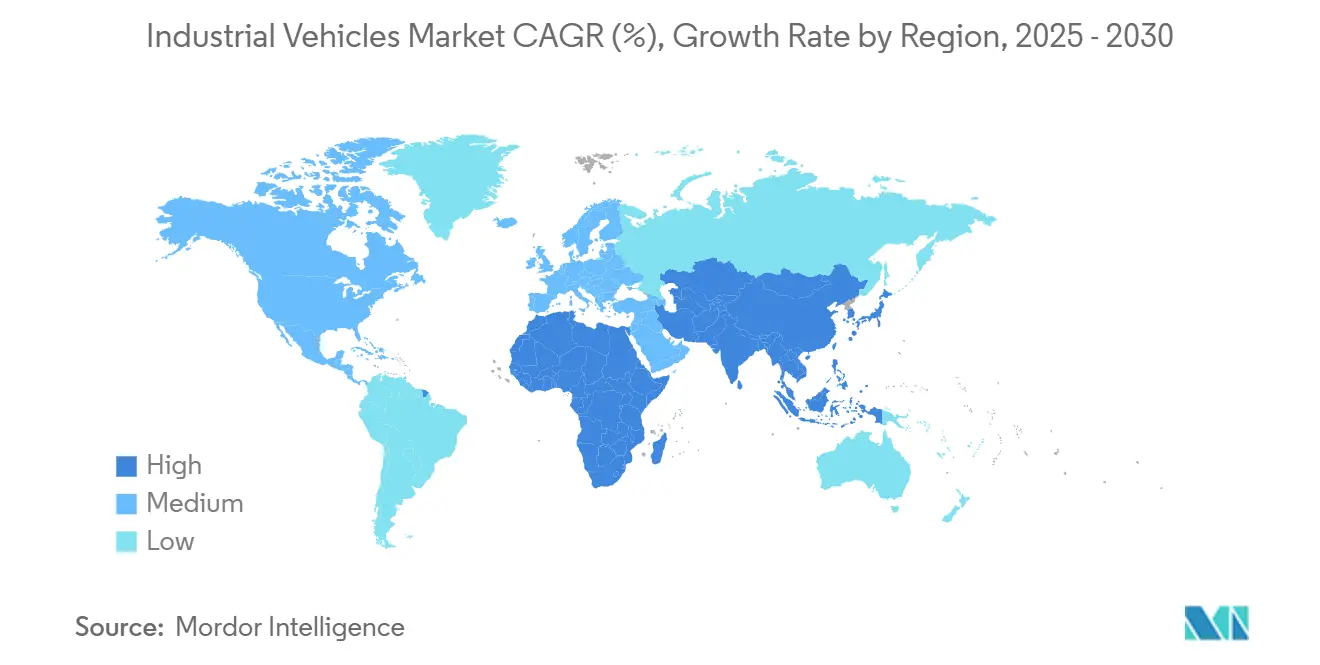
| Fastest Growing Market | Asia Pacific |
| Largest Market | Asia Pacific |
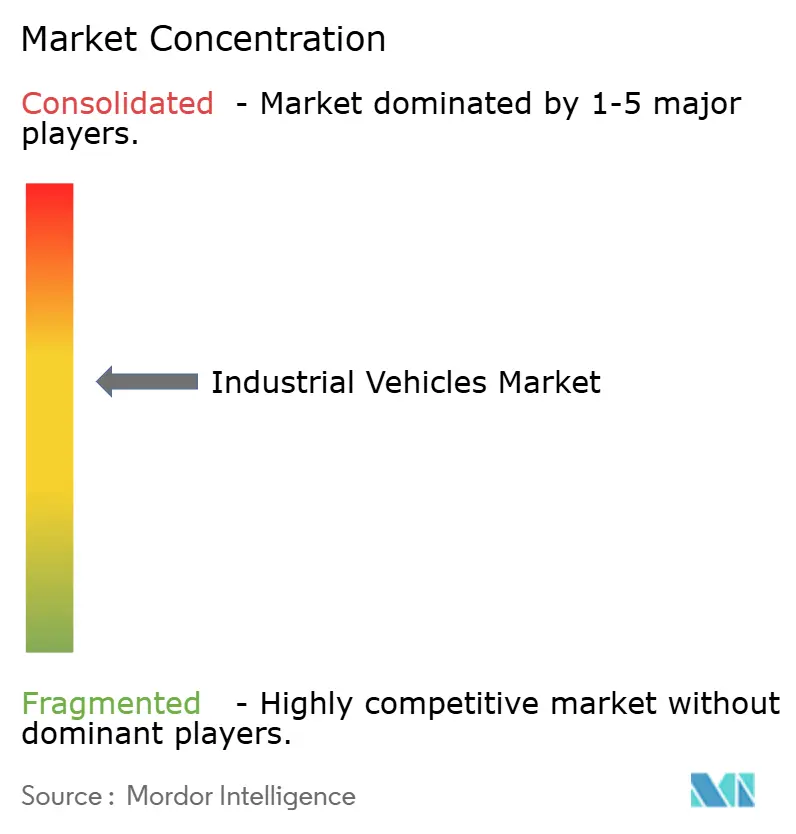
| Market Concentration | Medium |
Major Players *Disclaimer: Major Players sorted in no particular order Image © Mordor Intelligence. Reuse requires attribution under CC BY 4.0. | |
Industrial Vehicles Market Analysis by Mordor Intelligence
The industrial vehicles market size stood at USD 46.13 billion in 2025 and is on track to reach USD 58.44 billion by 2030, supported by a steady 4.84% CAGR. Durable demand from e-commerce fulfillment, factory automation, and last-mile logistics keeps the sector resilient even as it matures. Internal-combustion platforms still dominate day-to-day fleet operations, yet fleets are shifting investment toward battery-electric and hybrid models that satisfy tightening indoor-air-quality and carbon mandates. Autonomous navigation and fleet-orchestration software now account for a growing share of vehicle value, which improves total cost of ownership for operators dealing with acute labor scarcity. Regional performance favors Asia-Pacific’s manufacturing hubs, while North America and Europe lead technology upgrades in electrification, connectivity, and safety.
Key Report Takeaways
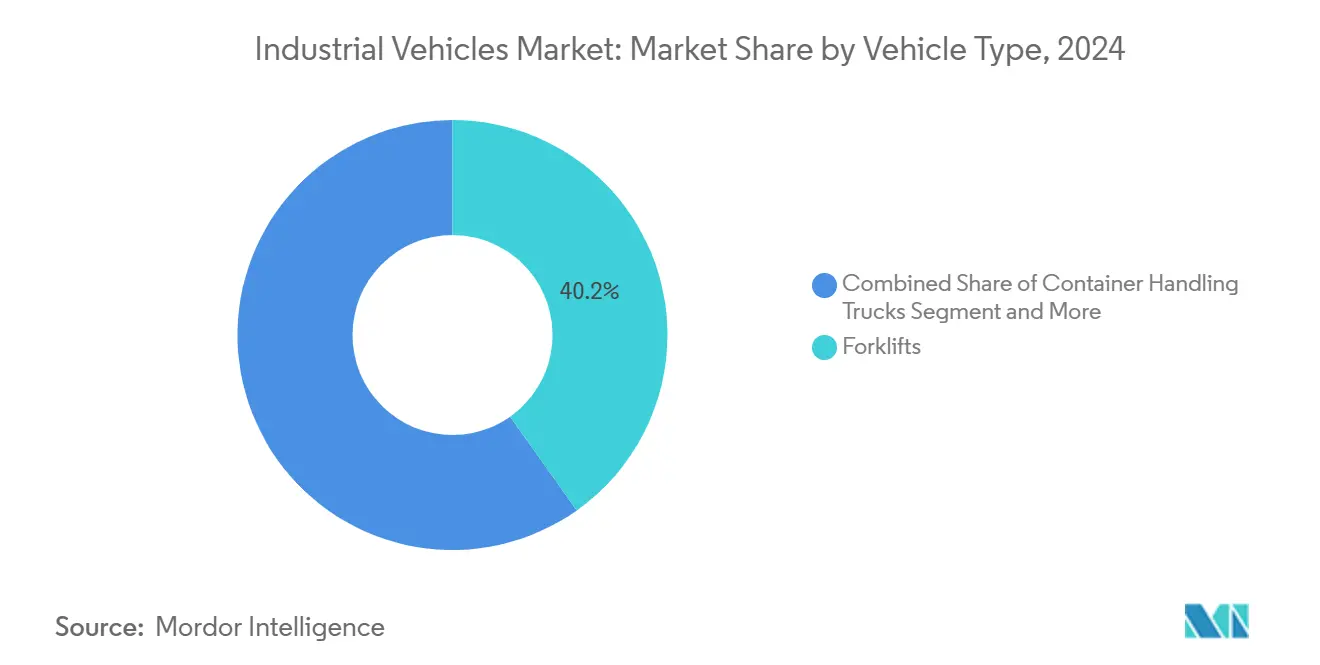
- By vehicle type, forklifts accounted for 40.15% of the industrial vehicles market share in 2024, while automated guided vehicles are forecast to grow 9.13% annually to 2030.
- By propulsion, internal-combustion engines held 85.33% of the industrial vehicles market share in 2024, whereas electric models are expanding at an 8.79% CAGR by 2030.
- By application, warehousing led with a 39.77% revenue share of the industrial vehicles market share in 2024, and will post the fastest 5.19% CAGR through 2030.
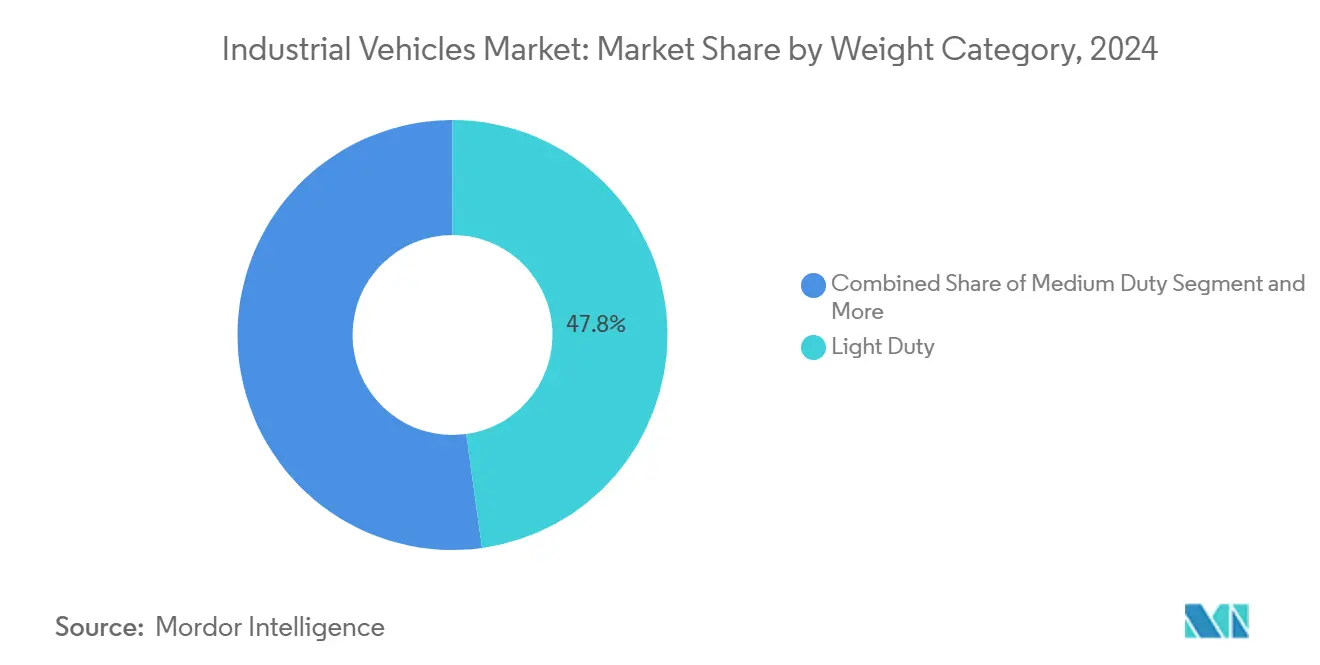
- By weight class, light-duty units captured 47.83% of the industrial vehicles market share in 2024, yet medium-duty platforms are advancing at a 6.58% CAGR on rising demand for versatile payloads.
- By level of autonomy, non-autonomous vehicles captured 84.13% of the industrial vehicles market share in 2024, while fully autonomous vehicles are set to expand at an 8.02% CAGR through 2030.
- By geography, Asia-Pacific commanded 42.66% of the industrial vehicles market share in 2024, and is set to compound at 6.15% a year through 2030.
Market Trends and Insights
Drivers Impact Analysis of Industrial Vehicles Market*
| Driver | (~) % Impact on CAGR Forecast | Geographic Relevance | Impact Timeline |
|---|---|---|---|
| E-Commerce Fuels Warehousing | +0.7% | North America and Asia-Pacific | Medium term (2-4 years) |
| Regulations Accelerate Electrification | +0.6% | Europe and North America, spreading to Asia-Pacific | Long term (≥ 4 years) |
| Addressing Automation Amid Labor Shortages | +0.5% | Global, acute in developed economies | Short term (≤ 2 years) |
| Integrating Intra-Logistics with Manufacturing | +0.4% | Asia-Pacific factories, EU industrial clusters | Medium term (2-4 years) |
| 5G Networks Enable Fleet Orchestration | +0.3% | North America and Europe early adopters | Long term (≥ 4 years) |
| BaaS Lowers Capital Expenditure Barriers | +0.2% | Developed markets piloting subscription models | Medium term (2-4 years) |
| Source: Mordor Intelligence | |||
E-commerce–Fueled Warehousing Boom
Record online-order volumes require denser storage, faster picking, and continuous fulfillment cycles, prompting operators to add electric reach trucks and autonomous pallet movers able to navigate narrow aisles safely. In 2025, Amazon announced the deployment of over 750,000 robots in its worldwide fulfillment and logistics network, highlighting the vast scale of its material-handling operations. Micro-fulfillment nodes in major cities further stimulate demand for compact industrial vehicles market solutions that combine high-throughput lifts with advanced vision guidance. Operators pay premiums for equipment that integrates natively with warehouse-execution software, ensuring real-time inventory accuracy. Same-day delivery norms in the United States and parts of Asia-Pacific reinforce capital flows into next-generation fleets that can work around the clock without exhaust emissions, thereby supporting stringent indoor-air-quality codes.
Emissions Regulations Accelerating Electrification
The European Union expanded its Industrial Emissions Directive in 2024 to cover logistics centers larger than 10,000 m², effectively compelling operators to adopt zero-tailpipe-emission vehicles. California’s Advanced Clean Fleets rule established similar mandates for new industrial-vehicle purchases in 2025 [1]“Advanced Clean Fleets Rule,” California Air Resources Board, arb.ca.gov. Compliance costs often exceed the incremental purchase price of an electric forklift, persuading CFOs that switching powertrains is fiscally prudent. OEMs respond by launching lithium-iron-phosphate battery packs that charge in under 90 minutes and promise 10-year design lives. The regulatory signal resonates in emerging markets where governments tie decarbonization targets to industrial-fleet incentive programs.
Automation and Safety Needs Amid Labor Shortages
Warehousing turnover exceeded a notable share in the United States during 2024, raising operating risk and spurring automation programs. OSHA data show a significant decline in accident frequency at facilities that deploy guided vehicles with collision-avoidance sensors. Autonomous units sustain throughput on overnight shifts without the wage premiums human crews require, compressing payback periods to less than three years for many adopters. Management teams increasingly view autonomy as insurance against future labor shocks, prompting multi-site rollouts rather than one-off pilots. Similar patterns appear in Japan and Western Europe as shrinking labor pools converge with stricter safety standards.
Manufacturing 4.0 Integration of Intra-Logistics
Siemens now feeds lift-truck telematics directly into its Digital Factory suite, which synchronizes material flow with machine-tool scheduling. Real-time connectivity lets planners cut work-in-process inventory and improve overall equipment effectiveness. Vehicle OEMs embed OPC-UA and MQTT protocols so fleets can communicate natively with manufacturing-execution software. Operators report 15–25% inventory-carrying-cost reductions once industrial vehicles act as active nodes in a closed-loop factory network. Adoption is fastest in electronics, automotive, and pharmaceutical plants, where margin pressures make downtime intolerable.
Restraints Impact Analysis of Industrial Vehicles Market*
| Restraint | (~) % Impact on CAGR Forecast | Geographic Relevance | Impact Timeline |
|---|---|---|---|
| Upfront Costs of Automated Vehicles | –0.4% | Global, most acute in price-sensitive regions | Short term (≤ 2 years) |
| Bottlenecks in Battery and Chip Supply | –0.3% | Global, mining and fab capacity centered in Asia-Pacific | Medium term (2-4 years) |
| Cybersecurity Risks in Connected Fleets | –0.2% | Advanced IT markets | Medium term (2-4 years) |
| Legacy Floors Limit AGV Navigation | –0.2% | Older industrial facilities worldwide | Long term (≥ 4 years) |
| Source: Mordor Intelligence | |||
High Upfront Cost of Electric / Automated Vehicles
A lithium-ion forklift can list 40-60% higher than its diesel counterpart, while a basic automated guided vehicle may cost four times more than a manually operated pallet truck. Smaller warehouses often hesitate because the premium can absorb two to three years of their normal equipment budgets. Total-cost-of-ownership math favors electrics over five-year horizons thanks to lower energy and maintenance spend, yet many firms still prioritize immediate cash flow. Charging-infrastructure upgrades, such as high-amp service panels, add another layer of investment. Leasing markets partially ease the pain, but residual-value uncertainty for cutting-edge hardware keeps monthly rates elevated.
Battery-Metal and Chip Supply Bottlenecks
Lithium-carbonate spot prices spike, pushing battery pack costs up and squeezing OEM margins. Shortfalls in specialized microcontrollers delayed delivery of safety-critical autonomous stacks, with some models' lead times stretching to 18 months. Manufacturers assign scarce components to high-volume clients, leaving smaller operators to wait or accept downgraded feature sets. Cell production remains concentrated in China, South Korea, and Japan, creating shipping-cost and geopolitical-risk overlays for buyers in Europe and the Americas. Recycling initiatives will mitigate raw-material risk over the long term but do little to ease near-term shortages.
*Our forecasts treat driver/restraint impacts as directional, not additive. The impact forecasts reflect baseline growth, mix effects, and variable interactions.
Industrial Vehicles Market Segment Analysis
By Vehicle Type:
Automation Reshapes Traditional CategoriesThe forklift subsector retained a 40.15% slice of the industrial vehicles market size in 2024, buoyed by its indispensable role in pallet movement across factories, warehouses, and retail backrooms. Demand, however, is fragmenting as operators favor electric counter-balance models indoors and diesel units outdoors, while hybrid configurations serve mixed environments. Automated guided vehicles posted a brisk 9.13% CAGR outlook toward 2030, fueled by labor pressures and safety mandates that reward full-time autonomous operation. Tow tractors remain vital inside automotive and aerospace plants where just-in-time sequencing requires bulk trailer movements. Container handlers align with global trade volumes, tying their prospects to seaport throughput and intermodal investments.
Product design is shifting toward modular platforms that share standard drivetrains and sensor suites across categories, lowering production cost and shortening time to market. Manufacturers pre-install CAN bus and wireless telemetry so customers can add autonomy at their own pace. ISO 3691 revisions now require dynamic-stability monitoring and pedestrian-warning beacons, prompting an industry-wide safety-feature refresh [2]“ISO 3691-5 Powered Industrial Trucks—Safety Requirements,” International Organization for Standardization, iso.org. Vehicle vendors also integrate lifecycle management tools that schedule predictive maintenance based on onboard vibration, temperature, and battery-state data. This convergence of mechanical robustness with software intelligence positions next-generation fleets to meet both productivity and ESG goals central to the industrial vehicles market.


By Propulsion Type:
Electric Transition Accelerates Despite ICE DominanceInternal combustion technology will still underpin 85.33% of the industrial vehicles market in 2024, thanks to familiar refueling infrastructure, low sticker prices, and ample torque for heavy loads. Diesel remains preferred outdoors, while LPG enjoys pockets of popularity in operations that value lower soot and easier emissions compliance. Electric powertrains, however, show an 8.79% CAGR to 2030 as battery density improves and upfront cost gaps narrow. Warehouse operators are early adopters because they value zero tailpipe emissions and quiet operation, which enables mixed-shift work without noise complaints.
Battery-as-a-service contracts help reduce capex by moving energy storage to a monthly subscription, easing adoption for small and mid-size enterprises. Hybrid architectures bridge use cases requiring long run times yet partial indoor activity, delivering regulatory compliance while mitigating infrastructure spend. CNG and bio-LNG trials appear in regions offering renewable-gas incentives, but lack global scale. OEM collaboration with charger manufacturers has spawned 480-volt fast-charge stations that return a lift truck to 80% capacity in 70 minutes. Together, these dynamics signal a gradual but undeniable handoff that will see electrics and hybrids climb the industrial vehicles market ladder during the forecast window.
By Application:
Warehousing Drives Market EvolutionWarehousing delivered 39.77% of the industrial vehicles market in 2024 and maintains a 5.19% CAGR outlook as micro-fulfillment nodes pop up near urban demand clusters. Vehicles must maneuver tight aisles, integrate with WMS software, and comply with stricter indoor-air-quality standards. Manufacturing consumes a broad mix of platforms, from explosion-proof chemical lifts to precision electronics tuggers. Food and beverage sites favor stainless-steel finishes and washable designs that withstand caustic washdowns, while metals producers specify heavy-duty mast construction to survive abrasive environments.
Freight forwarders deploy high-capacity reach stackers for container moves across railheads and port yards. Construction’s cyclical demand aligns vehicle sales with infrastructure budgets and housing starts, whereas agriculture pushes units into packhouses and cold storage to streamline post-harvest logistics. Retail back-of-store operations request quiet, compact electric models that can navigate stocking aisles without disturbing shoppers. This breadth of use cases compels OEMs to offer configurable chassis that leverage standard drivetrain modules but accept application-specific attachments, strengthening product-line resilience in the industrial vehicles market.
By Weight Category:
Versatility Drives Medium-Duty GrowthLight-duty models, covering loads up to 2 tons, held 47.83% of the industrial vehicles market in 2024 due to cost and maneuverability advantages that suit small warehouses and retail facilities. Yet operators running multi-pallet tasks increasingly choose medium-duty units, which are projected to grow 6.58% annually to 2030. Advances in battery chemistry mean a 3-ton electric lift can now log a full shift on a single charge, eroding a former diesel stronghold. Heavy-duty platforms above 10 tons remain indispensable at steel mills, ports, and lumber yards, but their cycle is tied to capital-goods markets and global trade.
Platform modularity blurs category lines: the same base can accept counterweights, longer forks, or taller masts to service multiple payload brackets. Fleets deploy telematics dashboards that track load profiles, guiding data-driven rightsizing and reducing over-spec’d purchases. Energy recuperation during mast lowering now appears in medium-duty electric lines, trimming kilowatt-hour consumption. Over time, these innovations allow the industrial vehicles market to transition from capacity-centric buying toward lifecycle-cost optimization.
By Level of Autonomy:
Gradual Transition Toward Full AutomationNon-autonomous vehicles accounted for 84.13% of the industrial vehicles market in 2024, reflecting a conservative safety culture and skill familiarity across industrial sites. Semi-autonomous modes—such as operator-assist lane keeping and pallet-recognition auto-lift—offer a pragmatic bridge, giving crews technological support while preserving human oversight. Entirely autonomous platforms, however, clock an 8.02% CAGR because they uplift throughput without proportional labor increases. Early adopters concentrate in high-volume distribution centers where repetitive travel paths suit robotic navigation.
Insurance carriers reward adopters with premium discounts if fleets integrate fail-safe braking and dual-sensor redundancy. Technology suppliers bundle fleet-management software that orchestrates mixed human-robot traffic, mitigating downtime risks. These advances signal that automation will expand from pilot zones into mainstream adoption, reinforcing the long-term upside built into the industrial vehicles market.
Geography Analysis
APAC Industrial Vehicles Market
Asia-Pacific dominated the industrial vehicle market revenue with 42.66% in 2024, owing to China’s export-manufacturing base and India’s logistics-infrastructure upgrade programs. The region is also projected to expand at a CAGR of 6.15% by 2030. Regional governments offer subsidies for battery-electric equipment that reduces port and warehouse emissions, accelerating technology diffusion. Japanese OEMs pilot advanced autonomy at domestic facilities, exporting proven solutions to Southeast Asian markets keen to replicate productivity gains. South Korea’s automotive and shipbuilding clusters specify heavy-duty handlers that can operate around-the-clock under harsh conditions.
North America Industrial Vehicles Market
North America shows mature replacement dynamics, yet electrification and autonomy upgrades keep overall spending positive. U.S. distribution centers lead the world in same-day shipping intensity, driving demand for narrow-aisle reach trucks integrated with AI-based slotting software. Canada’s energy and forestry sectors purchase ruggedized units for remote and temperature-extreme deployments, while Mexico’s near-shoring trend boosts factory throughput and thus material-handling needs. The USMCA trade framework eases cross-border equipment flows and harmonizes safety norms, allowing OEMs to streamline regional production.
Europe Industrial Vehicles Market
Europe remains regulation-centric, with the bloc’s expanding carbon-reduction targets nudging fleets toward electrics even where payback periods extend past seven years. Germany’s Industrie 4.0 program funds public-private pilots that connect industrial vehicles to digital twins, thereby reducing downtime. The United Kingdom’s post-Brexit logistics redesign spurs investment in automated cold-chain warehouses that comply with new customs timeframes. Eastern European manufacturing corridors, notably in Poland and Czechia, adopt medium-duty electrics as labor costs rise and EU incentives offset purchase premiums. Together, these regional narratives underline the diversified yet complementary growth engines sustaining the industrial vehicles market.

Competitive Landscape
Market concentration is moderate, with a trio of global incumbents—Toyota Industries, KION Group, and Jungheinrich, leveraging scale, R&D synergies, and global dealer networks to defend share. Toyota Industries fuses automotive lean-production methods with after-market telematics to offer lifetime performance guarantees that appeal to high-throughput users. KION’s multi-brand strategy covers premium and value tiers, securing contracts from multinationals and emerging-market fleets. Jungheinrich invests heavily in lithium-ion pack production, ensuring component security and shortened lead times for European clients.
Chinese suppliers such as BYD and Hangcha scale aggressively, bundling battery technology from the passenger-EV sector into lift-truck platforms priced 15–20% below incumbent equivalents. Western OEMs respond by striking joint ventures for localized assembly that avoids import tariffs and shortens shipping cycles. The race to own autonomy IP intensifies: firms file patents around sensor fusion, route optimization, and human-robot-interface modules, as tracked by the World Intellectual Property Organization [3]“New Technology Patent Filings 2024,” World Intellectual Property Organization, wipo.int. M&A activity targets niche specialists in vision systems and fleet-management software, reflecting a strategic pivot from pure hardware to solution-centric offerings that increase switching costs.
Pricing pressure endures in the manual-diesel segment, but margins widen for electric and autonomous lines where performance differentiation outweighs initial sticker shock. Service contracts covering remote diagnostics and predictive maintenance now contribute up to 30% of lifetime revenue per unit for leading OEMs. Dealers expand financing portfolios that bundle equipment, energy infrastructure, and telematics under long-term operating leases. Collectively, these moves recalibrate competitive boundaries and sharpen value propositions across the industrial vehicles market.
Industrial Vehicles Industry Leaders
Toyota Industries Corporation
KION Group AG
Jungheinrich AG
Hyster-Yale Materials Handling Inc.
Mitsubishi Logisnext Co. Ltd.
- *Disclaimer: Major Players sorted in no particular order
Industrial Vehicles Market Companies Covered in this Report
- Toyota Industries Corporation
- KION Group AG
- Jungheinrich AG
- Mitsubishi Logisnext Co. Ltd.
- Hyster-Yale Materials Handling Inc.
- Crown Equipment Corporation
- BYD Company Ltd.
- Hangcha Group Co. Ltd.
- Komatsu Ltd.
- Doosan Industrial Vehicle Co. Ltd.
- Clark Material Handling Company
- Hyundai Construction Equipment Co.
- Caterpillar Inc.
- Raymond Corporation
- JCB Ltd.

Recent Industry Developments in Industrial Vehicles Market
- August 2025: Haulotte introduced the Pulseo HA20 E and HA20 E PRO 20-meter fully electric boom lifts engineered for rough-terrain performance without emissions or engine maintenance.
- June 2025: JLG rebranded its micro electric scissor lifts as ES1330M and ES1530M, complemented by the ES1930M, strengthening its compact offering in North America.
- November 2024: Linde rolled out the 1251 electric-forklift family spanning 26 variants with lift capacities from 1 to 2 tons.
- August 2024: Hyster launched the J2.0-3.5XTLG lithium-ion forklift series rated up to 3.5 tons for multi-industry deployment.


Global Industrial Vehicles Market Report Scope
Segmentation Overview
| Forklifts |
| Tow Tractors |
| Container Handling Trucks |
| Industrial Tractors |
| Automated Guided Vehicles (AGVs) |
| Personnel Carriers |
| Scissor Lifts |
| Boom Lifts |
| Others |
| Internal Combustion Engine (ICE) |
| Electric |
| Hybrid |
| CNG / LPG |
| Manufacturing | Automotive |
| Chemical | |
| Food and Beverages | |
| Metals and Machinery | |
| Warehousing | |
| Freight and Logistics | |
| Construction | |
| Agriculture | |
| Retail | |
| Others |
| Light Duty |
| Medium Duty |
| Heavy Duty |
| Non-Autonomous |
| Semi-Autonomous |
| Fully Autonomous |
| North America | United States |
| Canada | |
| Rest of North America | |
| South America | Brazil |
| Argentina | |
| Rest of South America | |
| Europe | United Kingdom |
| Germany | |
| Spain | |
| Italy | |
| France | |
| Russia | |
| Rest of Europe | |
| Asia-Pacific | India |
| China | |
| Japan | |
| South Korea | |
| Rest of Asia-Pacific | |
| Middle East and Africa | United Arab Emirates |
| Saudi Arabia | |
| Turkey | |
| Egypt | |
| South Africa | |
| Rest of Middle East and Africa |
| By Vehicle Type | Forklifts | |
| Tow Tractors | ||
| Container Handling Trucks | ||
| Industrial Tractors | ||
| Automated Guided Vehicles (AGVs) | ||
| Personnel Carriers | ||
| Scissor Lifts | ||
| Boom Lifts | ||
| Others | ||
| By Propulsion Type | Internal Combustion Engine (ICE) | |
| Electric | ||
| Hybrid | ||
| CNG / LPG | ||
| By Application | Manufacturing | Automotive |
| Chemical | ||
| Food and Beverages | ||
| Metals and Machinery | ||
| Warehousing | ||
| Freight and Logistics | ||
| Construction | ||
| Agriculture | ||
| Retail | ||
| Others | ||
| By Weight Category | Light Duty | |
| Medium Duty | ||
| Heavy Duty | ||
| By Level of Autonomy | Non-Autonomous | |
| Semi-Autonomous | ||
| Fully Autonomous | ||
| By Geography | North America | United States |
| Canada | ||
| Rest of North America | ||
| South America | Brazil | |
| Argentina | ||
| Rest of South America | ||
| Europe | United Kingdom | |
| Germany | ||
| Spain | ||
| Italy | ||
| France | ||
| Russia | ||
| Rest of Europe | ||
| Asia-Pacific | India | |
| China | ||
| Japan | ||
| South Korea | ||
| Rest of Asia-Pacific | ||
| Middle East and Africa | United Arab Emirates | |
| Saudi Arabia | ||
| Turkey | ||
| Egypt | ||
| South Africa | ||
| Rest of Middle East and Africa | ||


Key Questions Answered in the Report
What is the projected value of the industrial vehicles market by 2030?
The sector is expected to reach USD 58.44 billion by 2030, reflecting a 4.84% CAGR from 2025.
Which application contributes the largest revenue share?
Warehousing accounted for 39.77% of 2024 revenue and continues to expand alongside e-commerce fulfillment.
Why are operators shifting toward electric powertrains?
Tougher emissions rules and lower lifetime energy costs make battery-electric fleets economically and regulatory attractive.
Which region shows the fastest forecast growth?
Asia-Pacific is set to expand at a 6.15% CAGR due to manufacturing expansion and logistics modernization.
Page last updated on:


