
Automotive High Performance Trucks Market Size and Share
Market Overview
| Study Period | 2020 - 2031 |
|---|---|
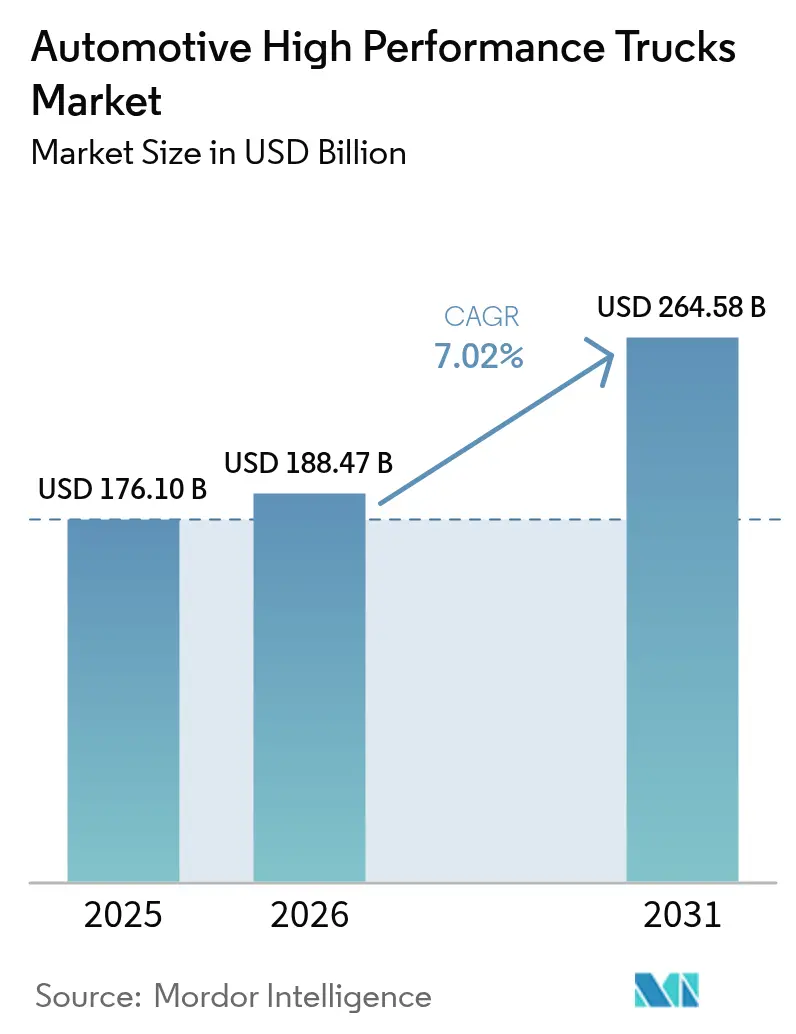
| Market Size (2026) | USD 188.47 Billion |
| Market Size (2031) | USD 264.58 Billion |
| Growth Rate (2026 - 2031) | 7.02 % |
| Fastest Growing Market | Asia Pacific |
| Largest Market | Asia Pacific |
| Market Concentration | Medium |
Major Players
*Disclaimer: Major Players sorted in no particular order Image © Mordor Intelligence. Reuse requires attribution under CC BY 4.0. |
|
Automotive High Performance Trucks Market Analysis by Mordor Intelligence
The automotive high-performance trucks market size is poised to reach USD 176.10 billion in 2025. Automotive high-performance trucks market size in 2026 is estimated at USD 188.47 billion, growing from 2025 value of USD 176.10 billion with 2031 projections showing USD 264.58 billion, growing at 7.02% CAGR over 2026-2031. Growth rests on three pillars: accelerating electrification that promises diesel-parity total cost of ownership, tighter global CO₂ regulations that penalize high-emission fleets, and infrastructure spending that sustains vocational demand even when long-haul freight cycles soften. Battery-electric adoption is most visible in regional and urban routes, yet diesel platforms retain scale advantages for heavy payloads. Meanwhile, megawatt-class charging pilots and joint-venture battery plants highlight how traditional manufacturers pool capital to address a USD 30 billion charging-network gap. The market also benefits from synchronous rebounds in construction and e-commerce logistics, which lift build rates across Classes 5-8 while driving premium specifications such as AMTs, predictive maintenance software, and driver-assistance suites.
Key Report Takeaways
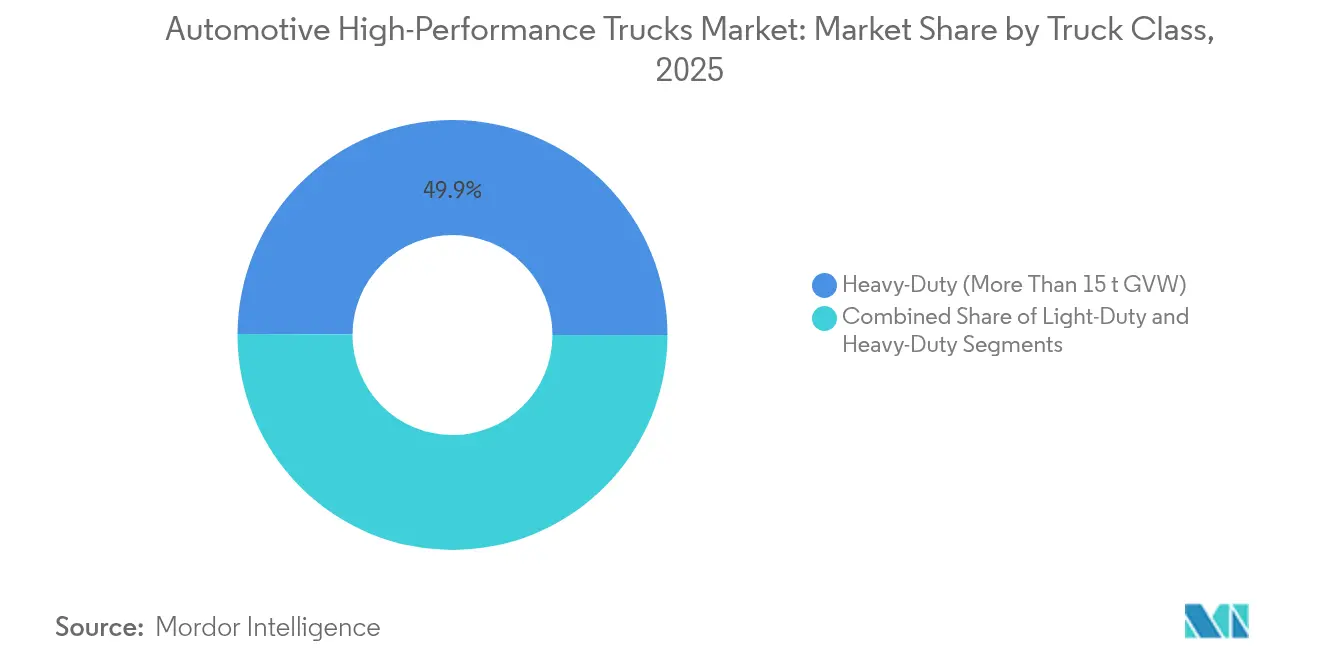
- By truck class, heavy-duty platforms (more than 15 t GVW) led with 49.93% of the automotive high-performance trucks market share in 2025 and are forecast to grow at a 6.82% CAGR through 2031.
- By drive type, internal combustion systems will retain a 79.05% revenue share of the automotive high-performance trucks market in 2025, while battery-electric trucks will post the fastest expansion at an 8.28% CAGR.
- By power output, the 250-400 hp band commanded a 44.02% share of the automotive high-performance trucks market size in 2025 and is projected to advance at a 10.18% CAGR by 2031.
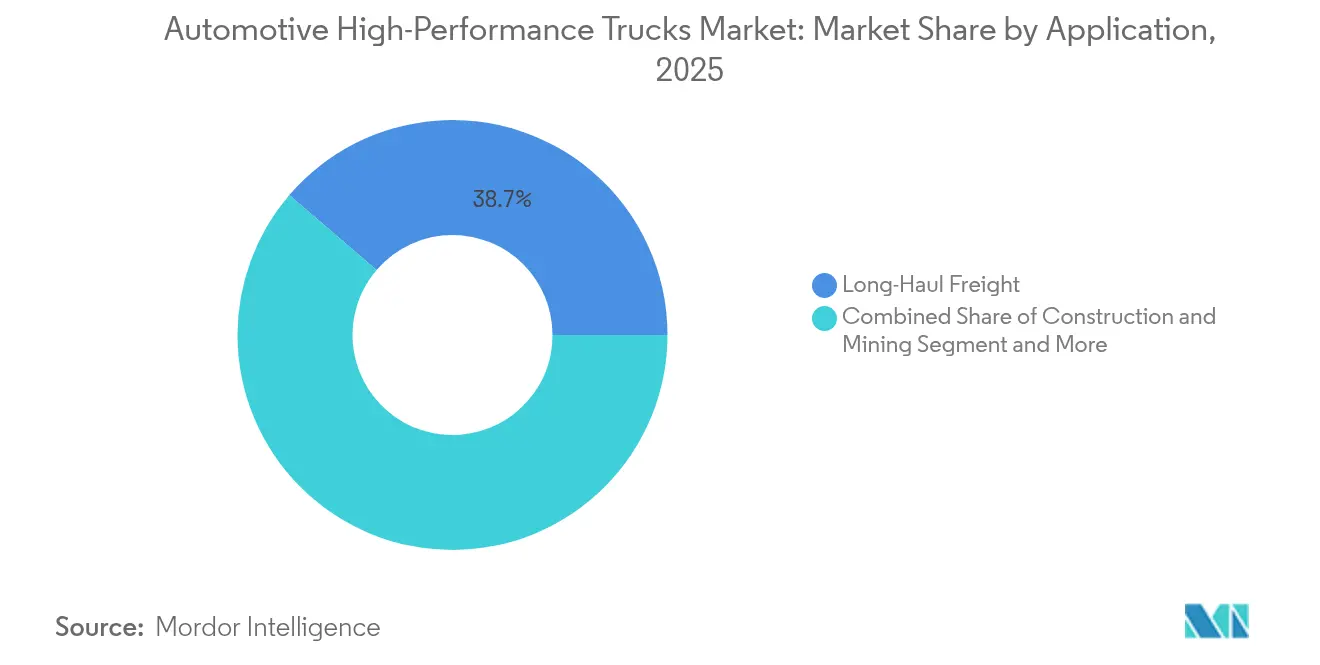
- By application, Long-haul freight applications command a 38.72% market share in 2025, and rise at an 8.62% CAGR through 2031.
- By transmission, manual transmissions account for a 33.35% share of the automotive high-performance trucks market size in 2025and are rising at a 8.94% CAGR through 2031 .
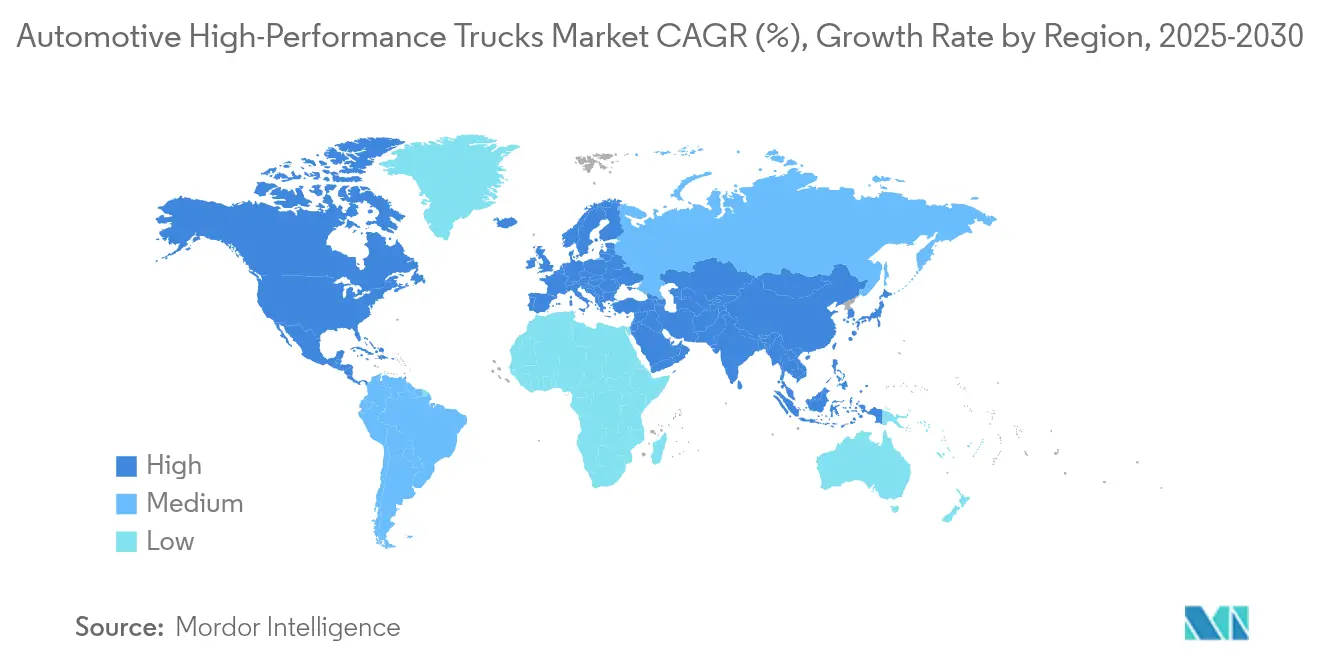
- By region, Asia-Pacific captured a 43.12% share of the automotive high-performance trucks market in 2025 and remains the fastest-growing geography, with a 9.08% CAGR through 2031.
Note: Market size and forecast figures in this report are generated using Mordor Intelligence’s proprietary estimation framework, updated with the latest available data and insights as of 2026.
Market Trends and Insights
Drivers Impact Analysis of Automotive High Performance Trucks Market*
| Driver | (~) % Impact on CAGR Forecast | Geographic Relevance | Impact Timeline |
|---|---|---|---|
| Rapid Battery-Price Decline Enabling ≥400 kWh Packs | +1.5% | Global, led by China manufacturing scale | Medium term (2–4 years) |
| Rise in Long-Haul E-Commerce Freight Volumes | +1.2% | Global, with concentration in North America and Asia-Pacific | Medium term (2–4 years) |
| Fleet-Wide CO₂ Caps in EU and China Phase-IV Norms | +1.1% | EU and China core, with regulatory spillover to other regions | Long term (≥ 4 years) |
| Infrastructure-Stimulus Boosting Vocational Truck Demand | +0.9% | North America and EU, with spillover to emerging markets | Short term (≤ 2 years) |
| Data-Driven Predictive Maintenance Lowering TCO | +0.8% | Global, with early adoption in developed markets | Medium term (2–4 years) |
| OEM Direct-to-Fleet Subscription Models | +0.6% | North America and EU, expanding to Asia-Pacific | Long term (≥ 4 years) |
| Source: Mordor Intelligence | |||
Rapid Battery-Price Decline Enabling More Than 400 kWh Packs
Battery cost reductions accelerate electric truck adoption by enabling larger battery packs that meet long-haul performance requirements while achieving total cost of ownership parity with diesel alternatives. Battery prices have declined over 85% in the past decade, with current costs at USD 135 per kWh expected to reach USD 60 per kWh by 2025-2030, making electric freight trucks potentially 50% cheaper to own than diesel by 2030. The Department of Energy's 2025 Incremental Purchase Cost Report shows battery costs for commercial vehicles at USD 128-133 per kWh, down from USD 150 per kWh in 2022[1]"2025 Incremental Purchase Cost Methodology and Results for Clean Vehicles", U.S. Department of Energy, energy.gov.. This trajectory enables Class 8 electric trucks with 375-mile range to achieve 13% lower total cost of ownership than diesel trucks, with payback periods of approximately 3 years. Battery pack costs could decline by 64% to 75% by 2050, while energy density improvements support larger pack configurations without compromising payload capacity. The cost reduction cycle creates positive feedback loops where increased production scale drives further cost improvements, accelerating market adoption.
Rise in Long-Haul E-Commerce Freight Volumes
E-commerce logistics transformation drives sustained demand for high-performance trucks with increased freight density and delivery frequency requirements. The American Trucking Associations projects truck volumes will grow 1.60% in 2025, with total tonnage rising from 11.27 billion tons in 2024 to 13.99 billion tons by 2035, maintaining trucking's 76.80% market share. This growth pattern reflects structural shifts in supply chain architecture, where last-mile delivery consolidation centers require trucks with enhanced payload optimization and route flexibility. E-commerce's impact extends beyond volume increases to performance specifications, with logistics companies investing in electric and alternative fuel vehicles to reduce emissions while exploring more efficient routing strategies. The sector's evolution toward smaller, frequent shipments necessitates trucks with advanced telematics and real-time tracking capabilities, creating opportunities for OEMs to differentiate through connectivity features. Capacity constraints in traditional freight networks amplify demand for high-performance trucks that maximize utilization rates while meeting stricter environmental standards.
Fleet-Wide CO₂ Caps in EU and China Phase-IV Norms
Regulatory mandates create compliance imperatives that drive technology adoption and reshape competitive dynamics across global truck markets. The EU's revised CO2 standards require 43% emissions reduction by 2030, 65% by 2035, and 90% by 2040, with financial penalties of EUR 4,250 per gCO2/tkm in 2025 and EUR 6,800 in 2030 for non-compliance. These regulations apply to a broader range of vehicles, including smaller trucks and urban buses, with 90% of new city buses required to be zero-emission by 2030. China's Phase-IV norms similarly drive electrification, with the country's heavy-duty truck market rebounding to approximately 900,000 trucks in 2023, driven by domestic recovery and export growth. The regulatory framework includes incentive mechanisms for zero- and low-emission vehicles, promoting hydrogen fuel cell technology adoption alongside battery-electric alternatives. Compliance strategies vary by region, with European manufacturers focusing on integrated powertrain solutions while Chinese OEMs leverage manufacturing scale advantages in battery production.
Infrastructure-Stimulus Boosting Vocational Truck Demand
Government infrastructure investments create sustained demand for specialized vocational trucks across construction, mining, and utility applications, with vocational production reaching record levels despite overall market softness. The Inflation Reduction Act and infrastructure bill stimulate demand for Class 5 trucks essential for utilities and municipalities, while medium-duty vehicle market projections show growth potential reaching USD 85.31 billion by 2032 from USD 51.8 billion in 2023. This demand pattern reflects federal spending priorities that favor domestic manufacturing and clean energy infrastructure deployment. Heavy equipment market stabilization after COVID-19 volatility benefits from federal infrastructure bills, though challenges remain in fully transitioning to electric powertrains for heavy-duty applications. Vocational truck specifications increasingly incorporate electrification capabilities, particularly for urban applications where emissions regulations are strictest. The sector's resilience stems from its essential role in infrastructure maintenance and expansion, creating predictable demand cycles that support long-term investment planning.
Restraints Impact Analysis of Automotive High Performance Trucks Market*
| Restraint | (~) % Impact on CAGR Forecast | Geographic Relevance | Impact Timeline |
|---|---|---|---|
| Megawatt-Charging Infrastructure Gaps | -1.8% | Global, with acute shortages in rural and developing regions | Medium term (2-4 years) |
| Supply-Chain Crunch for Power-Electronics Grade SiC | -1.2% | Global, with particular impact on premium segments | Short term (≤ 2 years) |
| Class-8 Driver Shortage Curbing Utilization | -0.9% | North America and EU, with spillover effects globally | Long term (≥ 4 years) |
| High Insurance Premiums for More Than 500 HP Pickups | -0.4% | North America, with emerging concerns in other markets | Medium term (2-4 years) |
| Source: Mordor Intelligence | |||
Megawatt-Charging Infrastructure Gaps
Infrastructure deployment lags behind vehicle availability, creating range anxiety and limiting electric truck adoption in long-haul applications where charging time and availability remain critical operational constraints. Current megawatt charging systems can deliver up to 3.75 MW of power, significantly exceeding the 350 kW limit of passenger vehicle charging systems. Yet, deployment remains concentrated in pilot projects across major freight corridors. WattEV's 25-megawatt electric truck stop in California represents early infrastructure development, while Daimler's USD 650 million investment in charging and hydrogen networks demonstrates the scale of required investment. The infrastructure challenge extends beyond charging stations to grid capacity and renewable energy integration, with California planning 160,000 heavy-duty chargers by 2035 to support truck electrification. Charging infrastructure gaps particularly affect rural and developing regions, where grid capacity limitations and investment economics create deployment barriers. Establishing common megawatt charging standards through industry collaboration aims to accelerate infrastructure rollout, but coordination challenges between utilities, OEMs, and fleet operators slow progress.
Supply-Chain Crunch for Power-Electronics Grade SiC
Silicon carbide semiconductor shortages constrain electric truck production and increase costs for power electronics systems essential for high-performance electric drivetrains. The Power SiC market grew from USD 1.1 billion in 2021 to USD 1.8 billion in 2022, with automotive applications dominating at 70% market share and projections reaching nearly USD 9 billion by 2028. SiC semiconductors enable higher efficiency power conversion in 400V and 800V battery systems, but supply constraints limit availability for commercial vehicle applications. Major players, including STMicroelectronics and Infineon, are expanding SiC production capacity, yet demand growth outpaces supply expansion in the near term. The supply chain crunch particularly affects premium high-performance trucks that require advanced power electronics for optimal efficiency and performance. European companies maintain competitive positions in SiC device processing and packaging, though global capacity expansion remains necessary to meet automotive electrification demands.
*Our forecasts treat driver/restraint impacts as directional, not additive. The impact forecasts reflect baseline growth, mix effects, and variable interactions.
Automotive High Performance Trucks Market Segment Analysis
By Truck Class:
Heavy-Duty Dominance Drives Market ScaleHeavy-duty trucks above 15 tons GVW command 49.93% market share in 2025 and maintain leadership with 6.82% CAGR through 2031, reflecting their critical role in long-haul freight and construction applications where payload capacity and durability requirements favor larger platforms. This segment's dominance stems from economic advantages in freight transportation, where larger trucks achieve better ton-mile efficiency and lower per-unit transport costs. Medium-duty trucks (3.5 to 15 tons GVW) serve regional distribution and urban delivery markets, experiencing growth driven by e-commerce logistics and last-mile delivery requirements. Light-duty trucks below 3.5 tons GVW address specialized applications including service vehicles and small-scale construction, though their market share remains limited by payload constraints.
The heavy-duty segment's evolution toward electrification faces unique challenges related to battery weight and charging infrastructure, with manufacturers developing specialized solutions including battery swapping and megawatt charging compatibility. Class 8 truck production reached approximately 330,168 units in 2024, driven by vocational demand linked to infrastructure investments, though inventory overhangs constrained growth. Regulatory pressures, including the EPA 2027 rules, create pre-buy opportunities for model years 2025 and 2026, with potential price increases of USD 20,000 to USD 30,000 driving fleet purchasing decisions. The segment's technological advancement focuses on integrated powertrain solutions that optimize performance across diverse operating conditions while meeting increasingly stringent emissions standards.



By Drive Type:
Electrification Momentum Accelerates Despite ICE DominanceInternal combustion engines maintain 79.05% market share in 2025, reflecting established infrastructure and operational familiarity, while battery-electric systems lead growth projections at 8.28% CAGR through 2031 as cost parity approaches and charging infrastructure expands. The drive type transition reflects fundamental shifts in total cost of ownership calculations, where declining battery costs and rising fuel prices favor electric alternatives for specific applications. Hybrid systems (PHEV/HEV) serve as transitional technologies, offering reduced emissions without range limitations, which is particularly valuable for mixed-duty cycles. Fuel cell electric vehicles represent emerging alternatives for long-haul applications, with Hyundai's XCIENT fuel cell trucks achieving 10 million kilometers cumulative driving distance in Switzerland.
Battery-electric adoption accelerates in urban and regional applications where charging infrastructure availability and duty cycle predictability support operational requirements. The transition timeline varies by application, with urban delivery and drayage operations leading adoption while long-haul freight remains predominantly diesel-powered. Fuel cell technology gains traction for heavy-duty applications requiring long-range and fast refueling. PACCAR and Toyota expand their hydrogen fuel cell truck collaboration to include commercialization, with initial customer deliveries planned for 2024.
By Power Output:
Mid-Range Segment Balances Performance and EfficiencyThe 250-400 horsepower segment leads with 44.02% market share in 2025 and fastest growth at 10.18% CAGR through 2031, representing the optimal balance between performance capability and fuel efficiency for diverse commercial applications. This power range accommodates most regional hauling and construction requirements while maintaining reasonable fuel consumption and emissions profiles. Lower power outputs below 250 horsepower serve specialized applications including urban delivery and light construction, where maneuverability and operating cost efficiency outweigh maximum performance requirements. High-power segments above 400 horsepower address heavy-haul and severe-duty applications, though their market share remains constrained by fuel consumption and emissions considerations.
Power output optimization increasingly incorporates electrification technologies, where electric motors provide instant torque delivery and precise power control across operating ranges. Ford's Super Duty lineup exemplifies high-performance capabilities with diesel engines producing up to 500 horsepower and 1,200 lb-ft of torque, achieving a 40,000-pound towing capacity. The segment's evolution reflects broader powertrain integration trends, where engine, transmission, and vehicle systems coordinate to optimize performance and efficiency. Advanced engine technologies including turbocharging, direct injection, and hybrid assistance enable higher specific power outputs while meeting emissions standards. Electric powertrains challenge traditional power output classifications, as electric motors deliver different torque and power characteristics compared to internal combustion engines.
By Application:
Long-Haul Freight Maintains Leadership Despite DiversificationLong-haul freight applications command a 38.72% market share in 2025, with 8.62% CAGR through 2031, driven by sustained demand for intercity goods and e-commerce logistics expansion. This segment's requirements emphasize fuel efficiency, reliability, and driver comfort for extended operating periods, influencing vehicle specifications and technology adoption patterns. Construction and mining applications demand rugged durability and specialized equipment integration, with growth tied to infrastructure investment cycles and commodity demand. Refrigerated and cold-chain transport requires specialized temperature control systems and represents approximately 15.2% of total trailer production in North America, with Utility holding a 55% market share in refrigerated trailers.
Emergency and specialty services applications encompass fire, rescue, and utility vehicles with unique performance and equipment requirements that often justify premium pricing and specialized configurations. The application diversity drives segmented technology adoption, where urban delivery favors electric powertrains while long-haul freight remains predominantly diesel-powered due to range and infrastructure constraints. Refrigerated transport increasingly adopts electric-powered trailer refrigeration units (eTRUs) to reduce diesel fuel consumption and maintenance costs, with potential annual savings of USD 5,500 per unit when connected to grid electricity. Application-specific requirements create opportunities for specialized OEMs and technology suppliers to develop targeted solutions that command premium pricing while addressing unique operational needs.
By Transmission:
AMT Revolution Displaces Manual SystemsManual transmissions maintain a 33.35% market share in 2025 but face displacement by automated manual transmissions (AMTs) growing at 8.94% CAGR through 2031, reflecting industry-wide adoption of efficiency-enhancing technologies. Fully automatic transmissions gain market share in vocational applications where stop-and-go operation and precise control requirements favor torque converter systems over manual alternatives. The transmission evolution reflects broader vehicle electrification trends, where electric powertrains eliminate traditional transmission requirements while AMTs serve as transitional technologies for conventional powertrains.
Daimler Trucks North America reports a shift from over 85% manual transmission orders to less than 5% currently, while Mack Trucks sees 93% of Anthem models equipped with AMTs. The transition addresses driver shortage challenges, as younger drivers lack manual transmission experience and prefer automated systems for easy operation. AMT technology integration with engine management systems enables fuel economy improvements of 3% to 5% through optimized shift patterns and powertrain coordination.
Geography Analysis
APAC Automotive High Performance Trucks Market
Asia-Pacific accounted for 43.12% of 2025 revenue and is forecast to expand at 9.08% CAGR, keeping the automotive high-performance trucks market anchored in the region’s manufacturing and export heft. China’s heavy-truck exports jumped 58% year-on-year to 276,000 units in 2023, with state-owned and private OEMs leveraging low battery costs that already flirt with USD 100 /kWh. India, Indonesia, and Vietnam adopt similar platforms tailored to lower axle-load norms and mixed-fuel road maps. Japan and South Korea, meanwhile, specialize in premium low-emission technologies, supplying fuel-cell stacks and advanced ADAS software to regional assemblies.
North America Automotive High Performance Trucks Market
North America maintains robust freight demand supported by a 330,168-unit Class 8 built in 2024, even amid inventory overhangs. EPA Phase 3 rules prompt pre-buy waves for 2025-26 models, while federal infrastructure grants underpin steady vocational-truck backlogs. Hydrogen pilots in Canada and cross-border logistics with Mexico ensure diverse technology trials, from battery-electric drayage tractors in California ports to fuel-cell long-haul lanes in British Columbia.
Europe Automotive High Performance Trucks Market
Europe’s landscape is defined by a 43% CO₂-reduction mandate for 2030 and a 90% cut by 2040. These targets accelerate fleet turnover and incentivize both battery-electric and hydrogen fuel-cell solutions. Joint ventures among legacy OEMs streamline software platforms and networked safety systems, while governments pledge charging corridors to bridge interstate gaps. Economic headwinds and energy-price volatility remain challenges, but regulatory certainty anchors OEM investment decisions, keeping the automotive high-performance trucks market resilient across the continent.

Regulatory Landscape
Regulation is tightening around CO2 and safety performance in heavy vehicles, and regulators are also introducing short-cycle flexibility that can affect product planning and fleet buying. In the European Union, Regulation (EU) 2026/1046 entered into force in 2026, amending how CO2 emission credits are calculated for heavy-duty vehicles for the 2025-2029 reporting periods. The Council of the European Union also adopted a targeted amendment to Regulation 2019/1242 that allows manufacturers to manage compliance across 2025-2029 using annual-target based credit accumulation rather than a strictly linear trajectory.
In the United States, the EPA heavy-duty greenhouse gas program (Phase 3) continues to shape MY2027+ development and pre-buy dynamics. In July 2026, EPA proposed amendments that include shifting certain useful life period implementation for MY2027-2029 engines to MY2030 and maintaining current emission-related warranty periods for MY2027 engines, indicating an active rule-adjustment cycle that OEMs and fleets must monitor through the 2026 comment and revision process. Safety rule timing can also influence cab and chassis redesign schedules, reflected by NHTSA's June 2026 proposal to delay certain FMVSS 210 compliance dates for vehicles above 4,536 kg GVWR from September 1, 2027 to September 1, 2030.
Value Chain Analysis
The value chain covers raw materials and high-value components (powertrain, aftertreatment, batteries, inverters, and power electronics), vehicle engineering and assembly, body upfitting for vocational applications, and multi-channel distribution to fleets, dealers, and leasing providers. It then extends into parts, service, and software subscriptions. Electrification and automation raise the share of battery packs, e-axles, thermal systems, ADAS sensors, and compute hardware, while premium diesel platforms continue to rely on aftertreatment, engine controls, and automated-manual transmissions.
Recent moves point to more integrated, multilocal supply and logistics orchestration. In March 2025, Ford Trucks and IVECO signed a binding Joint Development Agreement to co-develop a new heavy-duty truck cabin, with an estimated EUR 343 million investment, reinforcing platform sharing and supplier consolidation around common modules. In December 2025, Daimler Truck and Torc Robotics selected Innoviz as a LiDAR supplier for series production of Level 4 autonomous trucks on the Freightliner Cascadia platform, bringing more semiconductor, sensing, and validation capability into the truck value chain. Logistics and cross-border flows remain important for build stability, with July 2026 developments such as Maersk Logistics (Shanghai) and FAW Jiefang Group International signing a strategic cooperation agreement for end-to-end supply chain services, alongside continued dependence on key corridors like the Ambassador Bridge for U.S.-Canada automotive trade volumes.
Competitive Landscape
The competition centers on electrification depth, software maturity, and customer service ecosystems. Market leaders like Daimler, Volvo, and PACCAR merge resources for unified operating systems that enable over-the-air feature deployment and predictive maintenance analytics. Joint ventures like Amplify Cell Technologies pool capital for a 21 GWh battery plant, locking supply and trimming cost curves. Mid-tier OEMs pursue alliances with fuel-cell innovators to hedge powertrain bets, while component suppliers race to secure SiC wafers and next-generation inverters.
Software-defined trucks shift revenue toward subscription models. Ford Pro, for example, scales connected-vehicle contracts that blend telematics, energy management, and fleet-financing packages into one invoice. Autonomous-driving startups secure minority stakes from incumbent OEMs, injecting AI expertise into product pipelines and shortening validation loops. Therefore, the automotive high-performance trucks market rewards firms integrating hardware, software, and infrastructure solutions into end-to-end value propositions.
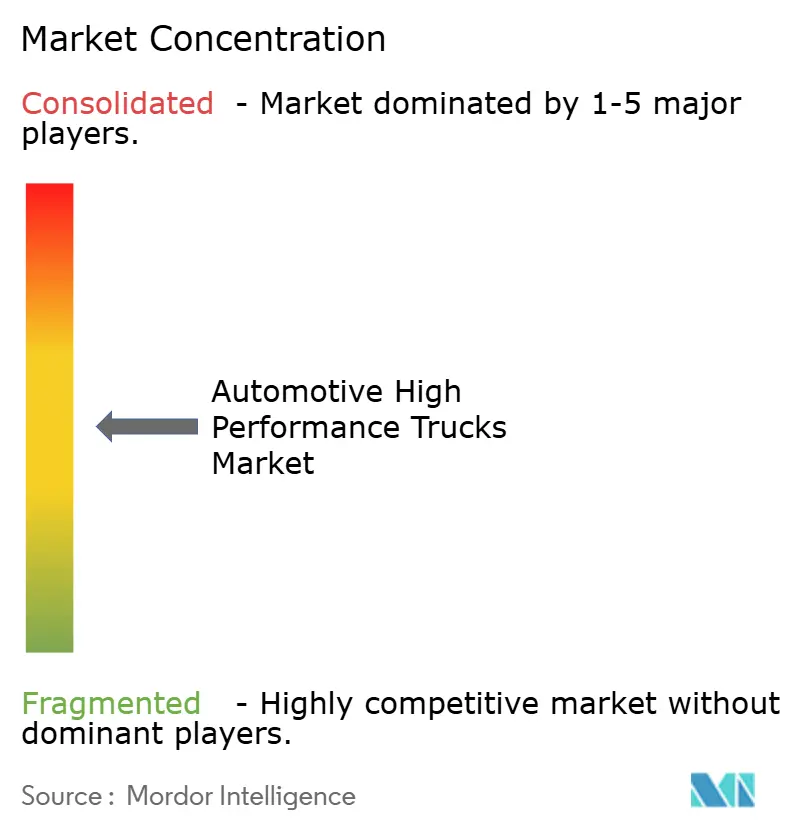
New entrants exploit white spaces in last-mile, vocational electric, and hydrogen corridors. However, steep homologation costs and warranty-reserve requirements keep the field moderately consolidated. The top five manufacturers account for roughly 72% of global revenue, yet no firm exceeds a 25% slice, preserving competitive tension and innovation pace.
Automotive High Performance Trucks Industry Leaders
-
PACCAR Inc
-
Scania AB
-
AB Volvo
-
Tata Motors Ltd.
-
Toyota Motor Corporation
- *Disclaimer: Major Players sorted in no particular order
Automotive High Performance Trucks Market Companies Covered in this Report
- Ford Motor Company
- General Motors Company
- Daimler Truck Holding AG
- Paccar Inc
- AB Volvo
- Toyota Motor Corporation
- Volkswagen AG (Traton and Scania)
- Tata Motors Ltd
- CNH Industrial NV
- Hyundai Motor Company
- BYD Auto Co.
- Isuzu Motors Ltd
- Navistar International
- Nikola Corporation
- Tesla Inc.
- Hino Motors Ltd
- FAW Jiefang Automotive
- Anhui JAC Auto
- Sinotruk Group
- Caterpillar Inc.
Read Analysis of Automotive High Performance Trucks Companies

Market Opportunities and Future Outlook
Product-cycle resets and manufacturing investments are creating near-term whitespace in regional hauling, vocational, and digitally managed fleets where high-performance specifications (powertrain efficiency, automation, connected services) translate into measurable utilization gains. In North America, Volvo Trucks started production of the all-new VNR regional hauler at its New River Valley Plant in February 2026 after a USD 400 million facility upgrade. Mack also began production of the redesigned Mack Anthem in January 2026 at Lehigh Valley Operations, reinforcing OEM focus on higher-efficiency, high-spec regional and on-highway platforms that provide a stronger base for software-led features.
The electrification opportunity is increasingly tied to industrialized production and modular architectures, not just pilots. In July 2026, MAN Truck & Bus started series production of the eTGL electric truck at its Krakow facility, its second electric truck production site after Munich, and aligned the plant to the TRATON Modular System approach to support battery-electric models. At the same time, OEMs are pairing hardware with digital ecosystems and configuration flexibility to raise attach rates for telematics, maintenance, and energy services, including IVECO's July 2026 launch of its Model Year 26 range with a broader digital integration ecosystem and extensive configuration sets. These steps support fleet modernization programs that bundle vehicle performance and uptime analytics with charging or energy management partnerships where infrastructure remains uneven, particularly on long-haul routes where megawatt-class charging is still a constraint.
Recent Industry Developments in Automotive High Performance Trucks Market
- July 2026: MAN Truck & Bus started series production of the eTGL electric truck at its Krakow, Poland facility, expanding its industrial footprint for battery-electric trucks beyond its Munich site. The move strengthens TRATON-aligned modular manufacturing and gives fleets a clearer supply signal for regional/urban electric duty cycles where charging can be planned.
- June 2026: Scania signed an agreement to sell 105 battery-electric trucks to Wibax for bulk transport operations. The order elevates the scale of electric truck deployments in Europe and increases competitive pressure on OEMs and suppliers to secure batteries, power electronics, and service coverage for multi-truck BEV fleets.
- December 2024: Hyundai Motor Group deployed 21 XCIENT hydrogen fuel-cell electric trucks for clean logistics at Metaplant America in Georgia and supported operations with a mobile hydrogen refueling setup. The deployment adds operational mileage and refueling learnings for fuel-cell trucks in industrial logistics, informing where hydrogen can complement battery-electric routes.


Automotive High Performance Trucks Market Report Scope and Research Methodology
Market Definition and Coverage
This market covers trucks sold and used with high-performance capability, where performance is expressed through higher horsepower, stronger powertrain tuning, and related performance-focused features. The market is measured in revenue from new vehicle sales across major regions.
Scope exclusions: Used truck resale values, standalone aftermarket performance parts, and general commercial trucks that do not meet the high-performance threshold are excluded.
Segments Covered in This Report
-
By Truck Class
- Light-Duty (Less Than 3.5 t GVW)
- Medium-Duty (3.5 to 15 t GVW)
- Heavy-Duty (More Than 15 t GVW)
-
By Drive Type
- Internal-Combustion Engine
- Battery-Electric
- Hybrid (PHEV / HEV)
- Fuel-Cell Electric
-
By Power Output
- Less Than 250 HP
- 250 to 400 HP
- More Than 400 HP
-
By Application
- Long-Haul Freight
- Construction and Mining
- Refrigerated and Cold-chain
- Emergency and Specialty Services
-
By Transmission
- Manual
- Automatic
- Automated-Manual (AMT)
-
By Geography
-
North America
- United States
- Canada
- Mexico
-
South America
- Brazil
- Argentina
- Rest of South America
-
Europe
- Germany
- United Kingdom
- France
- Italy
- Russia
- Rest of Europe
-
Asia-Pacific
- China
- India
- Japan
- South Korea
- Australia
- Rest of Asia-Pacific
-
Middle East and Africa
- Saudi Arabia
- United Arab Emirates
- Egypt
- South Africa
- Rest of Middle East and Africa
-
North America
Data Sources, Market Sizing, and Validation
Desk Research
Desk research was used to set the market boundary and to build an initial view of demand signals by region and truck class. We relied on public sources such as the International Organization of Motor Vehicle Manufacturers (OICA), the US EPA and US DOE for powertrain and emissions context, Eurostat for regional vehicle and trade indicators, and customs trade data portals that show truck and component flows.
We also reviewed company annual reports, earnings decks, and product announcements to understand how performance variants are positioned and priced, including where electric or hybrid variants are being introduced. When needed, paid subscriptions for company financials and news, patent databases, and shipment-level import-export records were used to cross-check model inputs such as pricing direction, technology adoption, and supply chain movement. The desk sources listed here are illustrative, and additional public documents and datasets were used for data collection, validation, and clarification.
Primary Interviews and Surveys
Primary work focused on validating what qualifies as high-performance in real buying decisions, and how that maps to truck classes and propulsion choices across regions. We spoke with a mix of OEM-side product and sales leaders, fleet decision makers, dealers, and industry experts across APAC, EMEA, and the Americas, so assumptions on performance trims, price premiums, and adoption pace could be checked and adjusted.
Distribution of primary research fieldwork respondents
| Company type | Respondent position | Region |
|---|---|---|
| Top tier: 35% | CXOs: 15% | APAC: 37% |
| Mid tier: 48% | Functional/Unit leaders: 34% | EMEA: 36% |
| Smaller Players: 17% | Managers: 51% | Americas: 27% |
Market-Sizing & Forecasting
The core sizing logic uses a top-down build where vehicle production and sales indicators are reconstructed by region and truck class, then filtered through a high-performance qualification step based on horsepower and performance-oriented variants. Once the eligible pool is formed, revenue is estimated using region-typical price bands and expected performance premiums, while the propulsion mix (ICE versus electric or hybrid) is handled separately where pricing and adoption differ.
To keep totals realistic, selective bottom-up checks were done using sampled model lineups, price lists, and channel feedback on mix shares. Inputs used in the model include truck sales volumes by class, the share of models above the 250+ HP threshold, the take-rate of performance trims, the split of ICE versus electric or hybrid, and observed ASP movements tied to feature content and emissions compliance. Where data on performance-variant penetration is thin in a country, the gap is handled by using close proxy markets and stress-testing it with interview feedback before finalizing.
For forecasting, scenario analysis is used with a base case that tracks macro indicators and truck demand cycles, then applies expected changes in powertrain adoption, regulation-driven technology shifts, and pricing direction. Assumptions are reviewed with experts to ensure the slope of adoption and the pace of premium expansion do not move faster than what product pipelines and buyer budgets support.
Data Validation & Update Cycle
Model outputs are checked against independent signals such as truck parc direction, OEM shipment commentary, and observed pricing trends by region, which helps catch totals that drift away from what the market can absorb. When a variance appears, the driver is isolated (volume, mix, or ASP) and then rechecked through desk evidence and follow-up calls before sign-off.
A multi-step internal review is completed so assumptions, conversions, and year alignment are consistent across regions and across truck classes. Reports are refreshed annually, and interim updates are triggered when material events occur, such as regulation changes, major product launches, or sharp shifts in commercial vehicle demand. Before delivery, an analyst performs a fresh pass to ensure the latest public data points and market signals are reflected.
Mordor Intelligence's Automotive High Performance Trucks Market Size Compared With Other Published Estimates
Published market values for high-performance trucks can differ widely because firms do not always apply the same performance threshold, the same revenue boundary, or the same timing for currency conversion and inflation treatment. Differences also show up when one estimate follows vehicle sales, while another leans more on broader truck demand narratives.
The benchmark table shows a much larger 2026 value than some other figures. In Mordor Intelligence's model, the count is limited to trucks that meet the defined high-performance horsepower cutoff (250+ HP) and are sized as new vehicle revenue, which reduces double counting with adjacent aftermarket spending but can increase totals when the performance-eligible share is applied across all truck classes and regions.
Benchmark comparison
| Source | Market Size | Gaps in Research Methodology |
|---|---|---|
| Mordor Intelligence | USD 188.47 B (2026) | |
| Industry Publisher A | USD 40.30 B (2025) | Uses an earlier base year and a narrower product boundary that appears to treat high-performance as a specialty subset, with segmentation that can undercount medium and heavy-duty performance variants and may not align currency timing to the same year. |
| Research Portal B | USD 103.28 B (2025) | Reports a different base year and likely applies a different inclusion rule for what qualifies as high-performance, which shifts the eligible volume pool and the assumed price premium used to convert units into revenue. |
The spread mainly comes from what is included as high-performance and how the revenue pool is constructed across truck classes, propulsion types, and regions. When the market is tied to clear qualifying rules and then checked with pricing and mix reality from interviews, the resulting number is easier to replicate and explain.


Key Questions Answered in the Report
What is the current size of the automotive high-performance trucks market?
The automotive high-performance trucks market was USD 188.47 billion in 2026 and is forecast to reach USD 264.58 billion by 2031.
Which region leads the automotive high-performance trucks market?
Asia-Pacific holds the top position with 43.12% market share and is also the fastest-growing region at a 9.08% CAGR through 2031.
How quickly are battery-electric high-performance trucks growing?
Battery-electric drive types register an 8.28% CAGR, the highest among all propulsion systems, as battery costs head toward USD 88 /kWh by 2030.
Why are automated manual transmissions gaining popularity?
AMTs improve fuel economy, reduce maintenance, and ease driver recruitment, leading to more than 80% penetration in new Class 8 builds.
Page last updated on:


 Your data is secure and never sold or shared.


