Market Overview
| Study Period | 2017 - 2029 |
|---|---|
| Forecast Data Period | 2025 - 2029 |
| Historical Data Period | 2017 - 2023 |
| Market Size (2025) | USD 2.66 Trillion |
| Market Size (2029) | USD 3.76 Trillion |
| Growth Rate (2025 - 2029) | 9.04% CAGR |
| Market Concentration | Low |
Major Players*Disclaimer: Major Players sorted in no particular order Image © Mordor Intelligence. Reuse requires attribution under CC BY 4.0. | |

Passenger Cars Market Analysis by Mordor Intelligence
The Passenger Cars Market size is estimated at 2.66 trillion USD in 2025, and is expected to reach 3.76 trillion USD by 2029, growing at a CAGR of 9.04% during the forecast period (2025-2029).
The passenger car industry is experiencing a profound transformation driven by technological innovation and changing consumer preferences. Advanced features like autonomous driving capabilities, connected car technologies, and sophisticated safety systems are becoming standard offerings across vehicle segments. Manufacturers are increasingly integrating Internet of Things (IoT) solutions with real-time information systems to enhance vehicle connectivity and user experience. The industry's digital transformation extends beyond vehicle features to encompass automotive manufacturing processes, with automakers implementing smart factory solutions and advanced robotics to improve production efficiency. Toyota Motor Corporation leads this evolution with a 10.2% market share, demonstrating the industry's competitive dynamics and the importance of technological leadership.
Consumer preferences are shifting dramatically towards vehicles that offer premium features, enhanced safety systems, and superior comfort levels. This trend is particularly evident in emerging markets where rising disposable incomes and improving living standards are driving demand for passenger cars with advanced features. The automotive industry has responded by introducing vehicles across different price points that incorporate premium features previously reserved for luxury segments. Major automotive manufacturers have collectively committed approximately USD 515 billion over the next five to ten years for developing and manufacturing next-generation vehicles, reflecting the industry's response to evolving consumer demands.
The manufacturing landscape is undergoing significant restructuring as automakers adapt to new market realities. Companies are reimagining their supply chain strategies, focusing on regional manufacturing hubs and localizing production to minimize disruptions and reduce dependency on single-source suppliers. The industry is witnessing increased investments in manufacturing facilities equipped with advanced technologies like artificial intelligence, machine learning, and predictive maintenance systems. These investments are aimed at enhancing production efficiency, reducing costs, and improving quality control processes.
Regulatory frameworks and emission standards continue to shape the industry's trajectory, with governments worldwide implementing increasingly stringent regulations. Nearly 70% of global passenger vehicle sales comprise passenger cars, highlighting the segment's significance in achieving environmental goals. Countries including China, India, France, and the United Kingdom have announced plans to phase out internal combustion engine vehicles by 2040, forcing manufacturers to accelerate their transition towards cleaner technologies. This regulatory push has catalyzed investments in research and development, particularly in areas like aerodynamics, lightweight materials, and efficient powertrains, as manufacturers strive to meet these environmental targets while maintaining performance standards.
Global Passenger Cars Market Trends and Insights
The rising global demand and government support propel electric vehicle market growth
- Electric vehicles (EVs) have become indispensable in the automotive industry, driven by their potential to enhance energy efficiency and reduce greenhouse gas and pollution emissions. This surge is primarily attributed to growing environmental concerns and supportive government initiatives. Notably, global EV sales witnessed a robust 10.82% growth in 2022 compared to 2021. Projections indicate that annual sales of electric passenger cars will surpass 5 million by the end of 2025, accounting for approximately 15% of total vehicle sales.
- Leading manufacturers and organizations, like the London Metropolitan Police & Fire Service, have been actively pursuing their electric mobility strategies. For instance, they have set a target of a zero-emission fleet by 2025, with a goal of electrifying 40% of their vans by 2030 and achieving full electrification by 2040. Similar trends are expected globally, with the period from 2024 to 2030 witnessing a surge in demand and sales of electric vehicles.
- Asia-Pacific and Europe are poised to dominate electric vehicle production, driven by their advancements in battery technology and vehicle electrification. In May 2020, Kia Motors Europe unveiled its "Plan S," signaling a strategic shift toward electrification. This decision came on the heels of record-breaking sales of Kia's EVs in Europe. Kia has ambitious plans to introduce 11 EV models globally by 2025, spanning various segments like passenger vehicles, SUVs, and MPVs. The company aims to achieve annual global EV sales of 500,000 by 2026.


OTHER KEY INDUSTRY TRENDS COVERED IN THE REPORT
- Africa's demographic evolution demonstrates consistent growth with a notable acceleration in recent years
- Several European countries are facing population declines, while others are growing, indicating a need for targeted policy interventions
- North America's demographic story highlights steady growth and adaptability, with each nation contributing uniquely to the region's vibrant mosaic, underlining its continued global significance
- Despite a GDP per capita decline in 2022-2023, Africa shows potential for future economic stability through trade agreements and infrastructure development
- Europe's GDP per capita is on track for steady growth, reflecting resilience and strategic policies
- Despite challenges in 2020, by 2023, the US experienced growth, Mexico displayed a robust recovery, while Canada witnessed a dip
- South Africa's consumer vehicle population shows signs of stabilization
- European countries are experiencing growth in CVP, driven by government incentives for eco-friendly vehicles
- North America exhibits diverse trends in CVP, with Canada experiencing a slight decrease, the US seeing an increase, and Mexico showing significant growth
- South Africa, Kenya, and Morocco exhibit declining inflation rates, while Nigeria faces a sharp inflation increase
- Europe is poised for economic stability, with concerted efforts to manage inflation and foster a balanced economic landscape
- From 2017 to 2023, North America, particularly countries like the US and Canada, navigated inflationary spikes, especially post-pandemic in 2022
- Auto interest rates across Africa, Asia-Pacific, and North America showed significant regional diversity, influenced by a combination of economic policies, market dynamics, and global conditions
- Global efforts to expand and enhance EV infrastructure are signaling a collective push toward electrification
- The demand for EVs in Asia-Pacific is fueled by falling battery prices
- The Middle East's battery market: A continuous descent in prices and promising energy trends
- South America’s surging demand for electric vehicle batteries: falling costs and strategic alliances
- The used car sales segment in Asia-Pacific is poised for growth, with China and India leading the expansion, reflecting strong economic signals and shifting consumer demands toward vehicle ownership
- Countries like Australia, India, and Indonesia project a steady upward trajectory in GDP per capita, suggesting robust economic strategies and potential investment in the automotive industries
- Saudi Arabia and UAE, both pivotal nations in the Middle East, demonstrated population growth from 2017 to 2023. While there were slight dips for both countries in between, the overarching upward trend indicates their significant roles and attractions in the region
- South America's demographic narrative, represented by Brazil and Colombia, showcases a story of consistent growth, with Brazil experiencing a pronounced surge
- Asia-Pacific displays a panorama of economic evolution: from the relentless pursuits of emerging economies to the recalibrations of established ones, painting a picture of resilience, adaptation, and ambition
- Projections for the coming years indicate a steady growth trajectory for both the UAE's diversified sectors and its role as a regional business hub. This growth can be attributed to the country's focus on diversification efforts and strategic partnerships
- During 2017-2030, Brazil and Colombia displayed contrasting economic paths. While both faced downturns around 2020, Brazil's GDP per capita showed recovery by 2023, whereas Colombia witnessed a slight decline
- The Asia-Pacific's diverse consumer spending trends on vehicle purchases not only reflect the region's evolving economic conditions but also highlight the shifting consumer preferences and vehicular market dynamics across countries
- In the short term (2022-2023), Saudi Arabia maintained stable consumer spending for vehicle purchases, while the UAE experienced a slight decline, suggesting differing market dynamics
- Brazil and Colombia are expected to see an increase in consumer spending for vehicle purchases (CVP), indicating a recovering automotive market and growing consumer confidence
- Asia-Pacific’s varied inflation rates reflect the diverse economic challenges and responses of each nation, from battling pandemic-induced fluctuations to aiming for future stability through strategic economic policies
- From 2017 to 2030, the Middle East is expected to display varied inflationary patterns, with countries like Iran facing significant challenges, while others like Saudi Arabia and the UAE expected to show stability
- Projections indicate a trend toward economic stabilization and controlled inflation in the region, highlighting a concerted push to restore equilibrium and foster growth
- The global MaaS market is growing significantly growth trajectory, indicating sustained expansion across all regions
- Battery pack prices in Africa continued to decline from USD 186 in 2022 to USD 176 in 2023, driven by technological advancements and increased market competition
- Declining battery prices and government initiatives drive demand for electric vehicles in Europe
- Declining prices of lithium-ion batteries drive the demand for electric vehicles in North America
- The global automotive industry will undergo a transformative phase, with a pronounced shift toward electrification from 2023 to 2025, followed by a period of refinement and consolidation in the subsequent years
- For over a year, Russia's invasion of Ukraine disrupted global crude oil and petroleum product markets
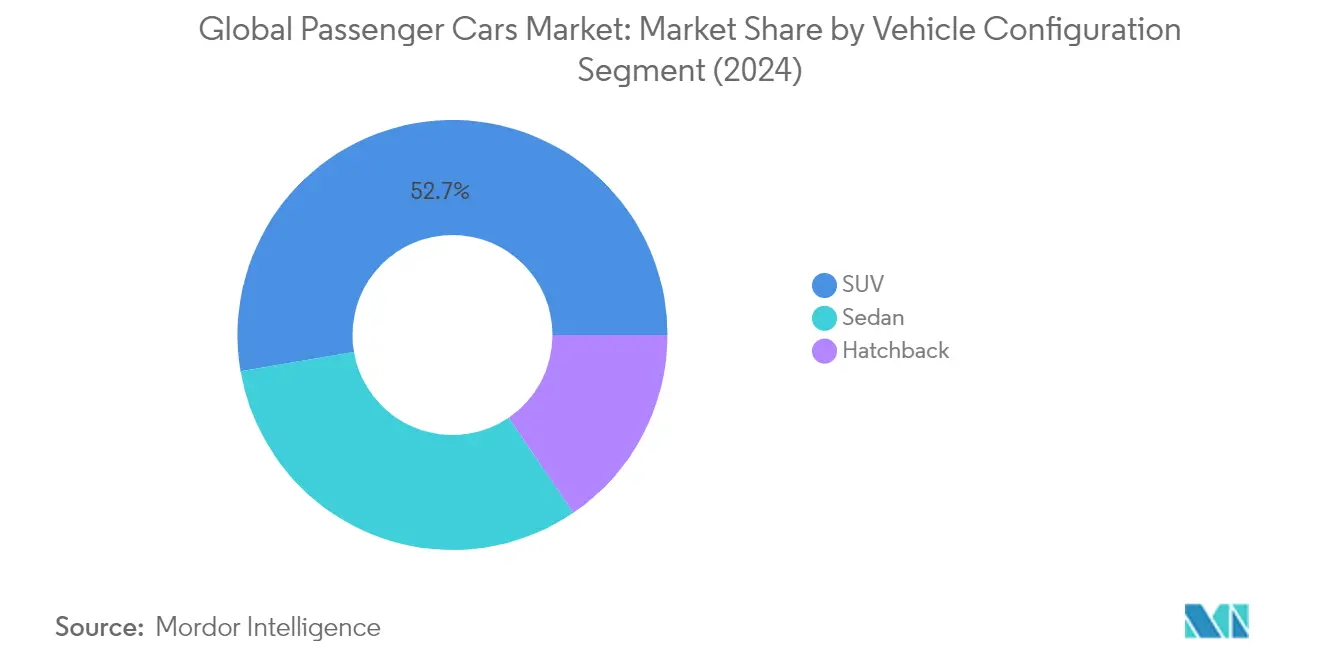
Segment Analysis: Vehicle Configuration
Sports Utility Vehicle (SUV) Segment in Global Passenger Cars Market
The Sports Utility Vehicle (SUV) segment has emerged as both the largest and fastest-growing segment in the global passenger cars market, commanding approximately 53% market share in 2024. This dominance can be attributed to SUVs' versatile design that effectively combines spaciousness and robustness with comfort and luxury features. The segment's popularity is driven by several factors, including higher ground clearance, a commanding driving position, enhanced safety features, and superior off-road capabilities. Modern SUVs have evolved to offer improved fuel efficiency, advanced driver assistance systems, and a wide range of powertrain options, including hybrid and electric variants. The segment's growth is further bolstered by increasing consumer preference for vehicles that offer both utility and style, making them ideal for both urban commuting and adventure travel. Manufacturers have responded to this demand by expanding their SUV portfolios across various price points and size categories, from compact crossovers to full-size luxury SUVs.

Remaining Segments in Vehicle Configuration
The sedan and hatchback segments continue to play vital roles in the global passenger cars market, each catering to distinct consumer preferences and needs. Sedans maintain their appeal through their elegant design, superior aerodynamics, and comfortable driving dynamics, particularly in markets where traditional passenger cars are still highly valued. The segment has evolved to incorporate advanced technologies and improved fuel efficiency while maintaining its characteristic sophistication. Hatchbacks, on the other hand, offer practical solutions for urban mobility with their compact size, excellent maneuverability, and efficient space utilization. These vehicles are particularly popular in regions with space constraints and among first-time car buyers. Both segments have adapted to changing market demands by introducing hybrid and electric variants, enhanced connectivity features, and advanced safety systems, ensuring their continued relevance in the evolving automotive landscape.
Segment Analysis: Propulsion Type
ICE Segment in Global Passenger Cars Market
The Internal Combustion Engine (ICE) segment continues to dominate the global passenger cars market, commanding approximately 99% market share in 2024. This substantial market presence is primarily driven by the widespread availability of fuel infrastructure, lower initial vehicle costs compared to alternative powertrains, and consumer familiarity with the technology. Within the ICE segment, gasoline-powered vehicles represent the largest sub-segment, followed by diesel engines, while CNG and LPG vehicles cater to specific regional markets where the infrastructure and regulations support these alternative fuels. The segment's dominance is particularly strong in emerging markets where charging infrastructure for electric vehicles remains limited and price sensitivity plays a crucial role in purchase decisions.
FCEV Segment in Global Passenger Cars Market
The Fuel Cell Electric Vehicle (FCEV) segment is emerging as the fastest-growing segment in the global passenger cars market, with a projected growth rate of approximately 35% during 2024-2029. This remarkable growth is driven by increasing investments in hydrogen infrastructure, particularly in developed regions like Europe, North America, and parts of Asia-Pacific. Major automotive manufacturers are expanding their FCEV offerings, supported by government initiatives promoting hydrogen technology as a viable solution for zero-emission transportation. The segment's growth is further bolstered by advancements in fuel cell technology, reducing production costs and improving overall vehicle performance and range capabilities.
Remaining Segments in Propulsion Type
The other segments in the propulsion type category include Battery Electric Vehicles (BEV), Hybrid Electric Vehicles (HEV), and Plug-in Hybrid Electric Vehicles (PHEV). These segments represent the automotive industry's transition toward electrification, with each serving distinct market needs. BEVs are gaining traction in urban environments and regions with well-developed charging infrastructure, while HEVs offer a balanced solution for consumers seeking improved fuel efficiency without range anxiety. PHEVs serve as a bridge technology, combining the benefits of both electric and conventional powertrains, making them particularly attractive in markets where charging infrastructure is still developing.
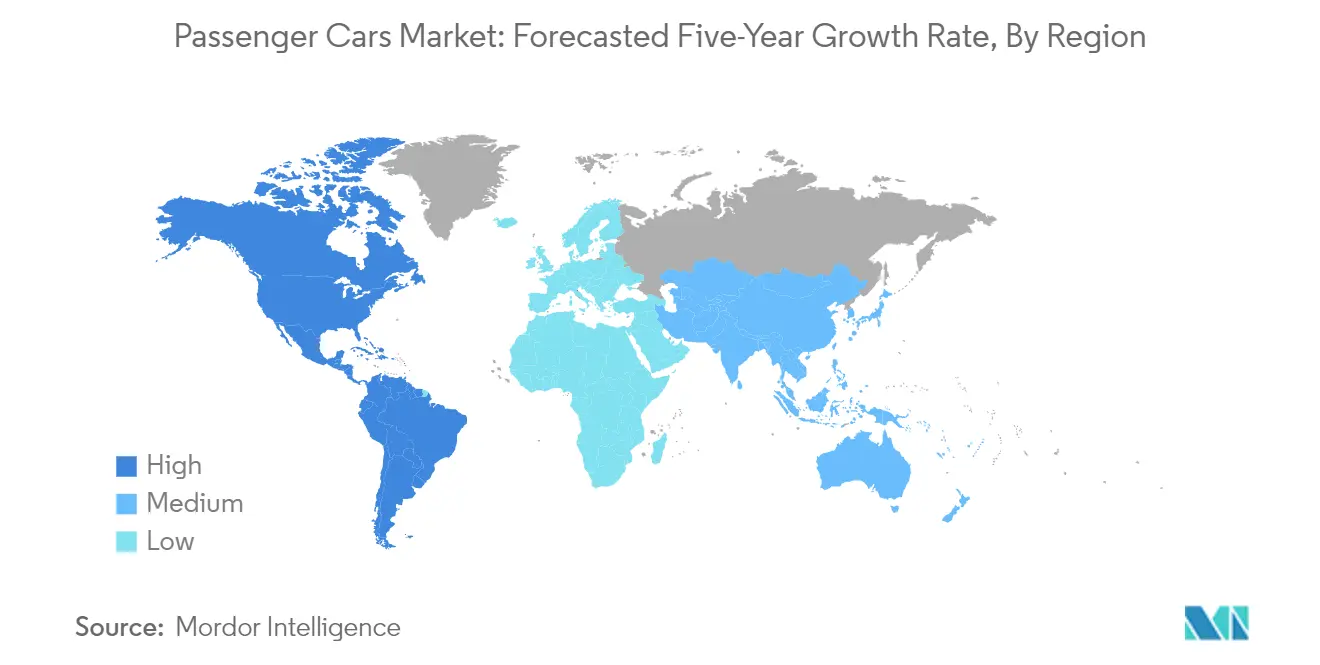
Passenger Cars Market Geography Segment Analysis
Passenger Cars Market in Asia-Pacific
The Asia-Pacific passenger cars market demonstrates robust growth driven by increasing urbanization, rising disposable incomes, and evolving consumer preferences. China, India, and Japan serve as the primary growth engines, each contributing uniquely to the region's automotive landscape. While China maintains its position as the manufacturing powerhouse with extensive vehicle production capabilities, India emerges as a rapidly growing market with strong domestic demand. Japan continues to lead in technological innovation, particularly in hybrid and electric vehicle development, setting new benchmarks for the industry.
Passenger Cars Market in China
China dominates the Asia-Pacific passenger cars market with approximately 47% market share in 2024. The country's automotive sector benefits from strong government support, extensive manufacturing infrastructure, and a large consumer base. Chinese automakers have made significant strides in electric vehicle production, supported by robust supply chains and advanced battery technology. The market shows particular strength in SUV and electric vehicle segments, with domestic brands gaining increased consumer trust. Local manufacturers continue to expand their product portfolios while international brands maintain their presence through joint ventures and strategic partnerships.
Passenger Cars Market in India
India emerges as the fastest-growing market in the Asia-Pacific region, with a projected growth rate of around 9% from 2024-2029. The country's automotive sector benefits from favorable demographics, increasing urbanization, and a rising middle-class population. Government initiatives promoting manufacturing through the 'Make in India' program and incentives for electric vehicle adoption have created a conducive environment for market expansion. The small car segment remains particularly strong, while SUVs gain increasing popularity among Indian consumers. Local manufacturing capabilities continue to expand, attracting both domestic and international investments in production facilities and technology development.
Passenger Cars Market in Europe
The European passenger cars market showcases a diverse landscape characterized by a strong emphasis on innovation, sustainability, and technological advancement. Countries like Germany, France, and the UK lead in traditional automotive manufacturing, while Norway spearheads electric vehicle adoption. The region's focus on reducing carbon emissions drives significant investments in electric and hybrid vehicle technology. Market dynamics vary across different European nations, with Western European countries showing mature market characteristics while Eastern European nations present growth opportunities.
Passenger Cars Market in Germany
Germany maintains its position as Europe's largest passenger cars market with approximately 25% market share in 2024. The country's automotive sector benefits from robust manufacturing infrastructure, strong research and development capabilities, and a premium brand reputation. German automakers continue to lead in technological innovation, particularly in autonomous driving and electric vehicle development. The market shows remarkable resilience through economic cycles, supported by strong domestic demand and export capabilities. The country's focus on premium vehicles and technological advancement continues to drive industry standards across Europe.
Passenger Cars Market in UK
The United Kingdom emerges as Europe's fastest-growing major passenger vehicle market, with a projected growth rate of around 11% from 2024-2029. The country's automotive sector demonstrates strong recovery potential, driven by increasing consumer confidence and growing demand for electric vehicles. British automotive manufacturing maintains its reputation for premium and luxury vehicles while adapting to changing market demands. The government's commitment to phasing out internal combustion engines by 2030 accelerates the transition to electric vehicles, supported by expanding charging infrastructure and consumer incentives.
Passenger Cars Market in North America
The North American passenger cars market represents a mature yet dynamic landscape, characterized by strong consumer preferences for larger vehicles and increasing adoption of electric mobility solutions. The United States, Canada, and Mexico each play distinct roles in the regional automotive landscape. While the US leads in market size and technological innovation, Canada excels in manufacturing quality, and Mexico provides significant production capabilities with cost advantages.
Passenger Cars Market in United States
The United States dominates the North American car market with approximately 40% market share in 2024. The country's automotive sector benefits from robust consumer demand, advanced technological infrastructure, and a strong regulatory framework. American consumers continue to show a strong preference for SUVs and pickup trucks, while electric vehicle adoption gains momentum in coastal regions. The market demonstrates particular strength in premium segments and innovative mobility solutions, supported by significant investments in autonomous driving technology and electric vehicle infrastructure.
Passenger Cars Market in Mexico
Mexico emerges as the fastest-growing passenger vehicle market in North America, with a projected growth rate of around 8% from 2024-2029. The country's automotive sector benefits from a strategic geographic location, competitive production costs, and strong trade agreements. Mexican manufacturing capabilities continue to expand, attracting investments from global automotive manufacturers. The domestic market shows increasing sophistication in consumer preferences, with growing demand for SUVs and crossover vehicles. The country's role in regional automotive production continues to strengthen, supported by a skilled workforce and improving infrastructure.
Passenger Cars Market in South America
The South American passenger cars market demonstrates resilience despite economic challenges, with Brazil and Argentina serving as key markets in the region. Brazil maintains its position as the largest automotive market in South America, benefiting from extensive manufacturing capabilities and strong domestic demand. Argentina shows promise as the fastest-growing market, driven by improving economic conditions and government initiatives to support the automotive sector. The region's automotive industry continues to adapt to changing consumer preferences, with increasing demand for SUVs and crossover vehicles. Both countries demonstrate growing interest in electric and hybrid vehicles, though adoption rates remain lower compared to other global regions due to infrastructure limitations and economic considerations.

Competitive Landscape
Top Companies in Passenger Cars Market
The global passenger cars market is characterized by intense competition among major automotive manufacturers who are rapidly adapting to evolving consumer preferences and technological advancements. Companies are heavily investing in electric vehicle development, with substantial commitments toward battery technology, charging infrastructure, and sustainable manufacturing practices. Product innovation remains a key focus, with manufacturers introducing advanced driver assistance systems, enhanced connectivity features, and improved fuel efficiency across their vehicle lineups. Operational agility has become crucial, with companies restructuring their supply chains, embracing digital transformation, and establishing strategic partnerships to maintain competitive advantages. Market leaders are expanding their geographical presence through new manufacturing facilities, particularly in emerging markets, while simultaneously strengthening their research and development capabilities to stay ahead in the electric mobility revolution.
Market Dominated by Established Global Players
The passenger cars market exhibits a high level of consolidation, with established global automotive automakers maintaining significant market share through their extensive manufacturing capabilities, strong brand recognition, and well-developed distribution networks. These industry giants leverage their diverse product portfolios, spanning from entry-level vehicles to luxury segments, to cater to various consumer segments across different geographical markets. The market structure is characterized by the presence of both traditional automotive conglomerates and emerging electric vehicle specialists, with the latter gaining prominence through technological innovation and focused market strategies. Joint ventures and strategic alliances have become increasingly common, particularly in emerging markets, as companies seek to combine their strengths and share risks in developing new technologies and entering new markets.
The industry has witnessed strategic mergers and acquisitions aimed at acquiring technological capabilities, particularly in electric vehicles, autonomous driving, and connected car technologies. Traditional automakers are actively acquiring or partnering with technology companies to accelerate their transition to electric and autonomous vehicles. Regional players, especially in emerging markets, are strengthening their positions through partnerships with global manufacturers, enabling technology transfer and market access. The competitive landscape is further shaped by vertical integration strategies, with manufacturers investing in battery production, software development, and charging infrastructure to control key aspects of the electric vehicle value chain.
Innovation and Sustainability Drive Future Success
Success in the car industry increasingly depends on manufacturers' ability to balance technological innovation with cost-effective production while meeting stringent environmental regulations. Companies must invest in research and development to improve battery technology, enhance vehicle range, and reduce production costs to make electric vehicles more accessible to mainstream consumers. Building strong supplier relationships and securing critical raw materials for battery production has become crucial for maintaining competitive advantages. Manufacturers need to develop flexible production platforms that can accommodate both internal combustion engine vehicles and electric vehicles to manage the transition period effectively. Additionally, establishing comprehensive after-sales networks and charging infrastructure will be vital for building consumer confidence and market share.
Market contenders can gain ground by focusing on specific market segments or geographical regions where they can build competitive advantages through specialized products or services. Success will depend on developing innovative business models, including subscription services, mobility solutions, and digital retail channels to meet evolving consumer preferences. Companies must also prepare for potential regulatory changes, particularly regarding emissions standards and safety requirements, which could significantly impact market dynamics. Building strong relationships with technology partners and maintaining flexibility in production capabilities will be essential for adapting to rapid technological changes and market shifts. Furthermore, companies need to invest in digital capabilities and data analytics to better understand consumer behavior and optimize their product development and marketing strategies.
Passenger Cars Industry Leaders
Ford Motor Company
General Motors Company
Nissan Motor Co. Ltd.
Toyota Motor Corporation
Volkswagen AG
- *Disclaimer: Major Players sorted in no particular order


Recent Industry Developments
- September 2023: The company has launched a new mini electric in South Africa with reduced pricing
- September 2023: The latest Cerato from Kia is unveiled in Brazil. In Brazil, Kia Motors is introducing the Cerato sedan of the newest generation. Similar to the 2.0-liter flex engine that powers the SUV Sportage SUV, the new Cerato is imported to Brazil with 167 horsepower.
- September 2023: Ford introduced a new website to improve consumer perception of electric vehicles.


Global Passenger Cars Market Report Scope
Passenger Cars are covered as segments by Vehicle Configuration. Hybrid and Electric Vehicles, ICE are covered as segments by Propulsion Type. Asia-Pacific, Europe, North America, South America are covered as segments by Region.Vehicle Configuration
| Passenger Cars | Hatchback |
| Sedan | |
| Sports Utility Vehicle |
Propulsion Type
| Hybrid and Electric Vehicles | By Fuel Category | BEV |
| FCEV | ||
| HEV | ||
| PHEV | ||
| ICE | By Fuel Category | CNG |
| Diesel | ||
| Gasoline | ||
| LPG |
Region
| Asia-Pacific | China |
| India | |
| Japan | |
| Europe | Belgium |
| Czech Republic | |
| France | |
| Germany | |
| Italy | |
| Norway | |
| Poland | |
| Russia | |
| Spain | |
| UK | |
| North America | Canada |
| Mexico | |
| US | |
| South America | Argentina |
| Brazil |
| Vehicle Configuration | Passenger Cars | Hatchback | |
| Sedan | |||
| Sports Utility Vehicle | |||
| Propulsion Type | Hybrid and Electric Vehicles | By Fuel Category | BEV |
| FCEV | |||
| HEV | |||
| PHEV | |||
| ICE | By Fuel Category | CNG | |
| Diesel | |||
| Gasoline | |||
| LPG | |||
| Region | Asia-Pacific | China | |
| India | |||
| Japan | |||
| Europe | Belgium | ||
| Czech Republic | |||
| France | |||
| Germany | |||
| Italy | |||
| Norway | |||
| Poland | |||
| Russia | |||
| Spain | |||
| UK | |||
| North America | Canada | ||
| Mexico | |||
| US | |||
| South America | Argentina | ||
| Brazil | |||


Market Definition
- Vehicle Type - The category includes passenger cars.
- Vehicle Body Type - This include various body types such as Hatchbacks, Sedans, Sports Utility Vehicles, and Multi-purpose Vehicles.
- Fuel Category - The category includes various fuel types such as Gasoline, Diesel, LPG (Liquefied Petroleum Gas), CNG (Compressed Natural Gas), HEV (Hybrid Electric Vehicles), PHEV (Plug-in Hybrid Electric Vehicles), BEV (Battery Electric Vehicles), and FCEV (Fuel Cell Electric Vehicles)
| Keyword | Definition |
|---|---|
| Electric Vehicle (EV) | A vehicle which uses one or more electric motors for propulsion. Includes cars, buses, and trucks. This term includes all-electric vehicles or battery electric vehicles and plug-in hybrid electric vehicles. |
| BEV | A BEV relies completely on a battery and a motor for propulsion. The battery in the vehicle must be charged by plugging it into an outlet or public charging station. BEVs do not have an ICE and hence are pollution-free. They have a low cost of operation and reduced engine noise as compared to conventional fuel engines. However, they have a shorter range and higher prices than their equivalent gasoline models. |
| PEV | A plug-in electric vehicle is an electric vehicle that can be externally charged and generally includes all-electric vehicles as well as plug-in hybrids. |
| Plug-in Hybrid EV | A vehicle that can be powered either by an ICE or an electric motor. In contrast to normal hybrid EVs, they can be charged externally. |
| Internal combustion engine | An engine in which the burning of fuels occurs in a confined space called a combustion chamber. Usually run with gasoline/petrol or diesel. |
| Hybrid EV | A vehicle powered by an ICE in combination with one or more electric motors that use energy stored in batteries. These are continually recharged with power from the ICE and regenerative braking. |
| Commercial Vehicles | Commercial vehicles are motorized road vehicles designed for transporting people or goods. The category includes light commercial vehicles (LCVs) and medium and heavy-duty vehicles (M&HCV). |
| Passenger Vehicles | Passenger cars are electric motor– or engine-driven vehicles with at least four wheels. These vehicles are used for the transport of passengers and comprise no more than eight seats in addition to the driver’s seat. |
| Light Commercial Vehicles | Commercial vehicles that weigh less than 6,000 lb (Class 1) and in the range of 6,001–10,000 lb (Class 2) are covered under this category. |
| M&HDT | Commercial vehicles that weigh in the range of 10,001–14,000 lb (Class 3), 14,001–16,000 lb (Class 4), 16,001–19,500 lb (Class 5), 19,501–26,000 lb (Class 6), 26,001–33,000 lb (Class 7) and above 33,001 lb (Class 8) are covered under this category. |
| Bus | A mode of transportation that typically refers to a large vehicle designed to carry passengers over long distances. This includes transit bus, school bus, shuttle bus, and trolleybuses. |
| Diesel | It includes vehicles that use diesel as their primary fuel. A diesel engine vehicle have a compression-ignited injection system rather than the spark-ignited system used by most gasoline vehicles. In such vehicles, fuel is injected into the combustion chamber and ignited by the high temperature achieved when gas is greatly compressed. |
| Gasoline | It includes vehicles that use gas/petrol as their primary fuel. A gasoline car typically uses a spark-ignited internal combustion engine. In such vehicles, fuel is injected into either the intake manifold or the combustion chamber, where it is combined with air, and the air/fuel mixture is ignited by the spark from a spark plug. |
| LPG | It includes vehicles that use LPG as their primary fuel. Both dedicated and bi-fuel LPG vehicles are considered under the scope of the study. |
| CNG | It includes vehicles that use CNG as their primary fuel. These are vehicles that operate like gasoline-powered vehicles with spark-ignited internal combustion engines. |
| HEV | All the electric vehicles that use batteries and an internal combustion engine (ICE) as their primary source for propulsion are considered under this category. HEVs generally use a diesel-electric powertrain and are also known as hybrid diesel-electric vehicles. An HEV converts the vehicle momentum (kinetic energy) into electricity that recharges the battery when the vehicle slows down or stops. The battery of HEV cannot be charged using plug-in devices. |
| PHEV | PHEVs are powered by a battery as well as an ICE. The battery can be charged through either regenerative breaking using the ICE or by plugging into some external charging source. PHEVs have a better range than BEVs but are comparatively less eco-friendly. |
| Hatchback | These are compact-sized cars with a hatch-type door provided at the rear end. |
| Sedan | These are usually two- or four-door passenger cars, with a separate area provided at the rear end for luggage. |
| SUV | Popularly known as SUVs, these cars come with four-wheel drive, and usually have high ground clearance. These cars can also be used as off-road vehicles. |
| MPV | These are multi-purpose vehicles (also called minivans) designed to carry a larger number of passengers. They carry between five and seven people and have room for luggage too. They are usually taller than the average family saloon car, to provide greater headroom and ease of access, and they are usually front-wheel drive. |


Research Methodology
Mordor Intelligence follows a four-step methodology in all its reports.
- Step-1: Identify Key Variables: To build a robust forecasting methodology, the variables and factors identified in Step-1 are tested against available historical market numbers. Through an iterative process, the variables required for market forecast are set and the model is built based on these variables.
- Step-2: Build a Market Model: Market-size estimations for the historical and forecast years have been provided in revenue and volume terms. Market revenue is calculated by multiplying the sales volume with their respective average selling price (ASP). While estimating ASP factors like average inflation, market demand shift, manufacturing cost, technological advancement, and varying consumer preference, among others have been taken into account.
- Step-3: Validate and Finalize: In this important step, all market numbers, variables, and analyst calls are validated through an extensive network of primary research experts from the market studied. The respondents are selected across levels and functions to generate a holistic picture of the market studied.
- Step-4: Research Outputs: Syndicated Reports, Custom Consulting Assignments, Databases & Subscription Platforms.


