Gaming Desktop PC Market Size and Share
Market Overview
| Study Period | 2020 - 2031 |
|---|---|
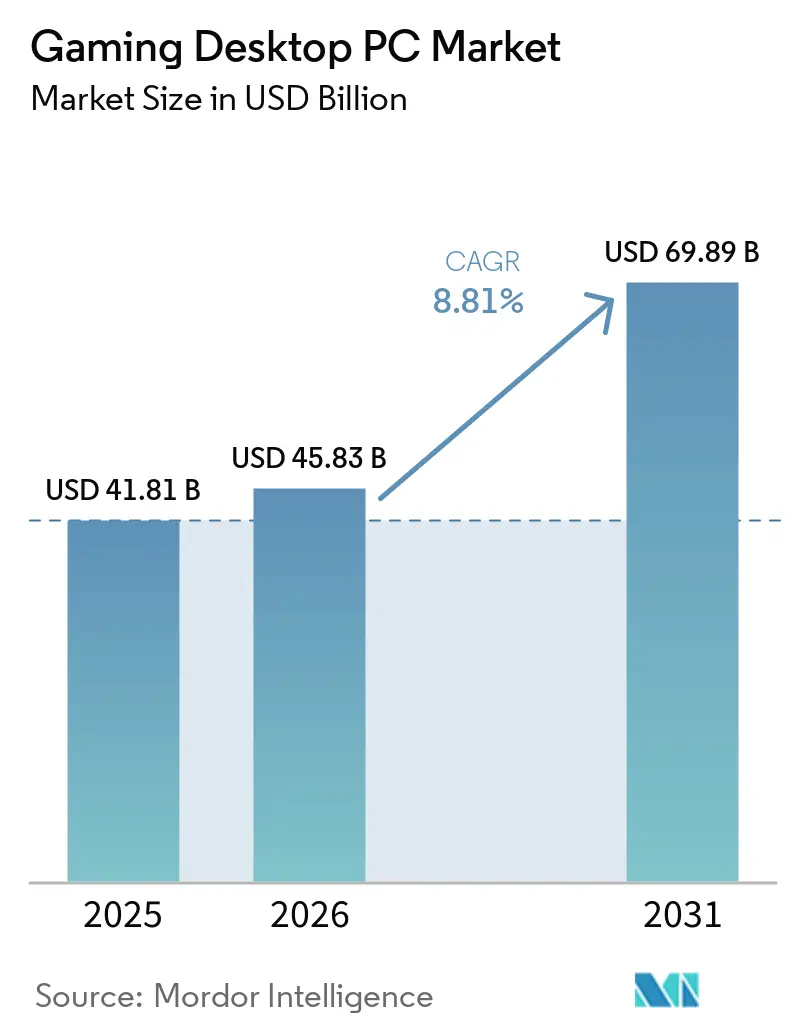
| Market Size (2026) | USD 45.83 Billion |
| Market Size (2031) | USD 69.89 Billion |
| Growth Rate (2026 - 2031) | 8.81% CAGR |
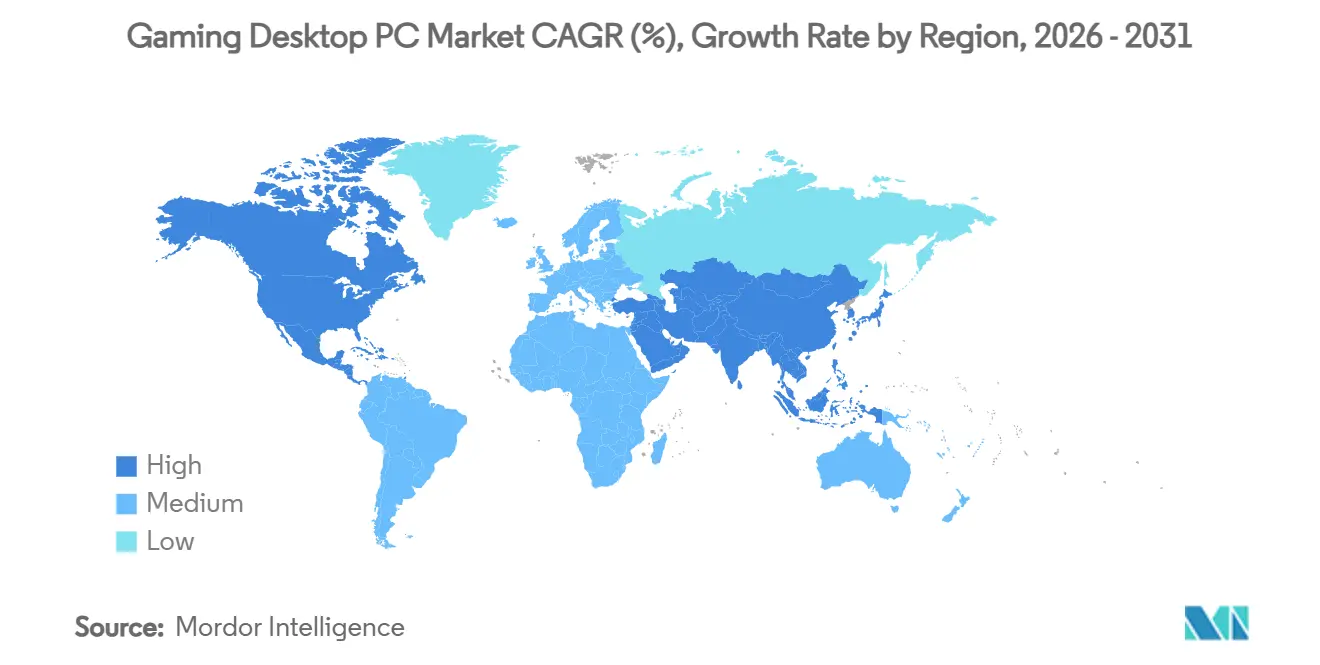
| Fastest Growing Market | North America |
| Largest Market | Asia Pacific |
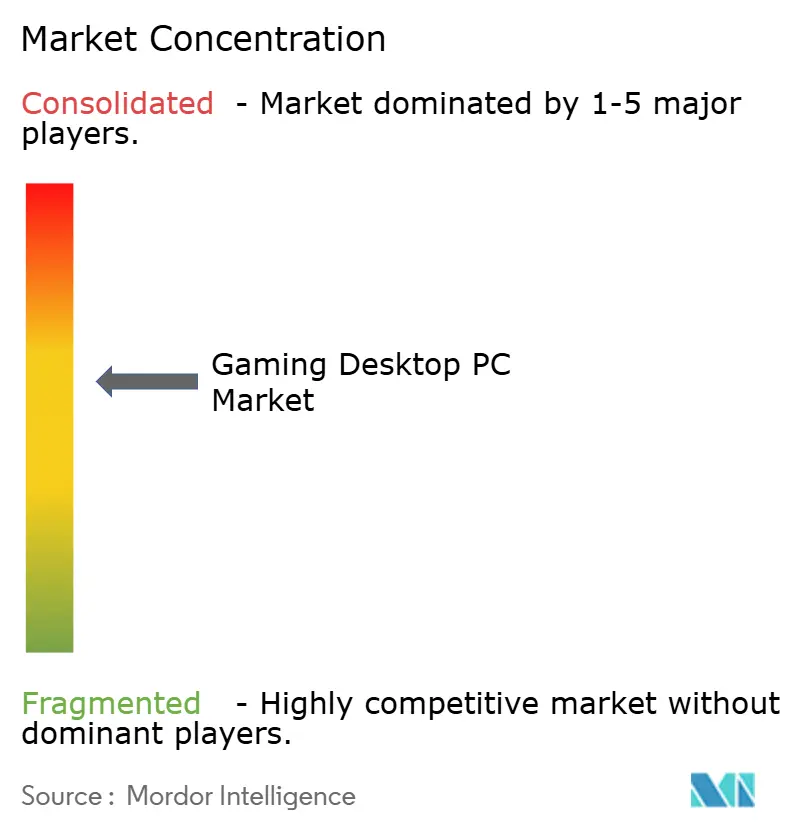
| Market Concentration | Medium |
Major Players *Disclaimer: Major Players sorted in no particular order Image © Mordor Intelligence. Reuse requires attribution under CC BY 4.0. | |
Gaming Desktop PC Market Analysis by Mordor Intelligence
The gaming desktop PC market size is expected to increase from USD 41.81 billion in 2025 to USD 45.83 billion in 2026 and reach USD 69.89 billion by 2031, growing at a CAGR of 8.81% over 2026-2031. Component upgrades are accelerating as AI-enhanced graphics pipelines make GPUs rather than CPUs the system bottleneck. Architectural leaps from NVIDIA, AMD, and Intel have shortened replacement cycles to roughly 24 months, while esports organizations continue to specify 360 Hz displays that demand extreme frame-rate headroom. E-commerce configurators now let buyers tailor every part of a build, sustaining the channel’s dominance despite rising memory prices. Geographically, Asia-Pacific’s expanding middle class and tournament infrastructure are set to overtake North America’s revenue leadership before the end of the decade.
Key Report Takeaways
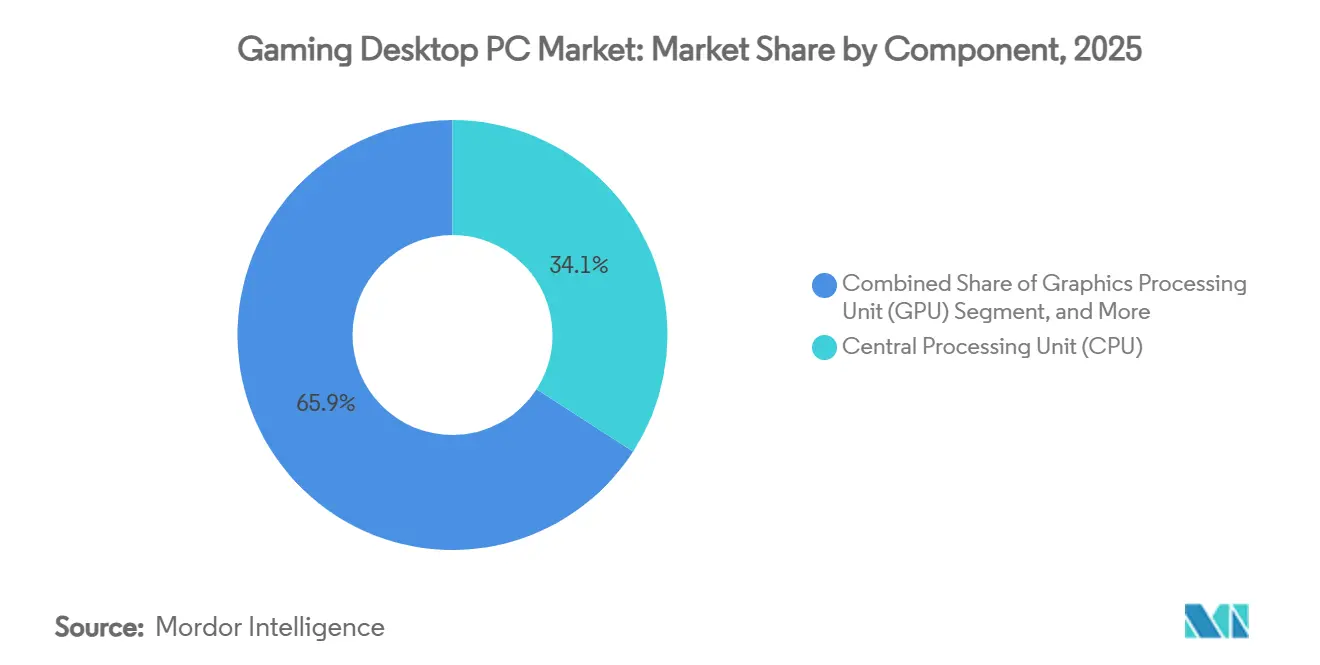
- By component, central processing units led with 34.13% revenue share in 2025, while graphics processing units are projected to expand at a 10.61% CAGR through 2031.
- By price range, mid-range systems (USD 1,000-1,999) accounted for 41.74% of 2025 revenue, yet enthusiast and extreme configurations above USD 3,000 are advancing at a 9.41% CAGR through 2031.
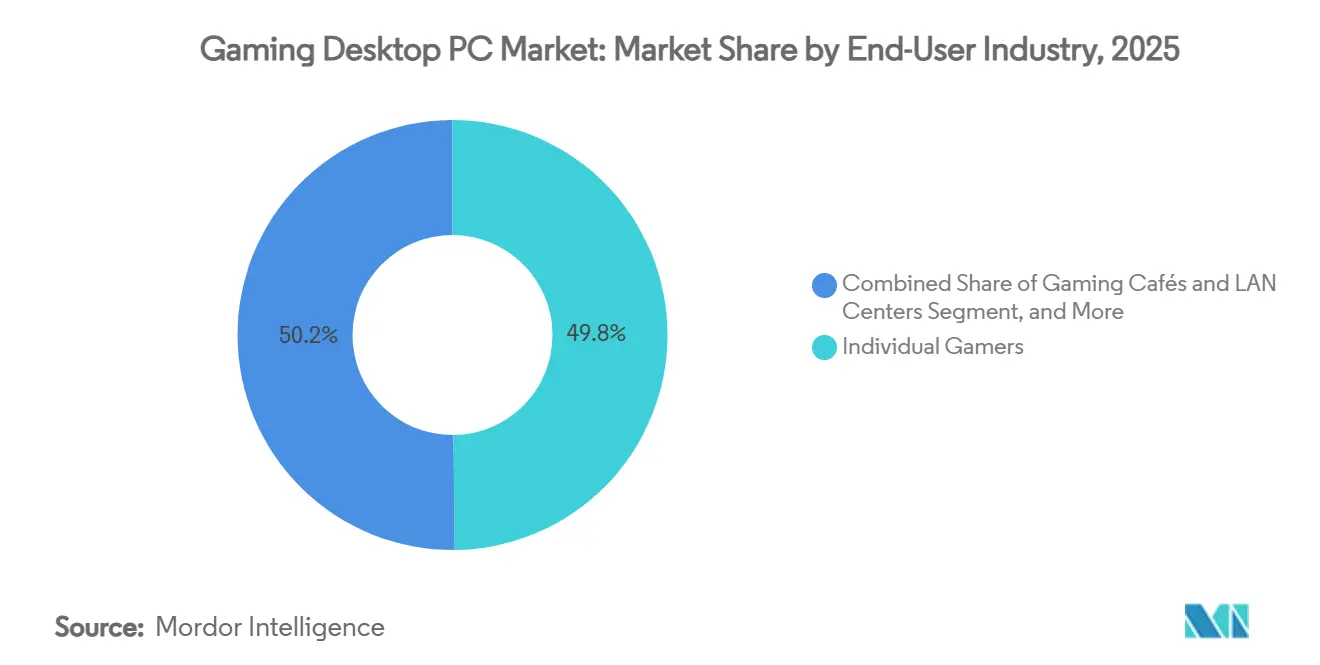
- By end user, individual gamers accounted for 49.84% of 2025 sales; professional esports teams and players record the highest projected CAGR at 9.61% through 2031.
- By distribution channel, online retail held 57.28% share in 2025 and is forecast to advance at a 9.79% CAGR to 2031.
- By geography, North America accounted for 46.13% of 2025 revenue, while Asia-Pacific is the fastest-growing region, with a 9.81% CAGR between 2026 and 2031.
Note: Market size and forecast figures in this report are generated using Mordor Intelligence’s proprietary estimation framework, updated with the latest available data and insights as of January 2026.
Global Gaming Desktop PC Market Trends and Insights
Driver Impact Analysis*
| Driver | (~) % Impact on CAGR Forecast | Geographic Relevance | Impact Timeline |
|---|---|---|---|
| Expanding AAA Game Titles Demanding High-End Hardware | +2.1% | Global, with concentration in North America, Europe and China | Medium term (2-4 years) |
| Rising Popularity of Competitive Esports Driving Desktop Preference | +1.8% | Global, strongest in Asia-Pacific (China, South Korea), North America | Long term (≥ 4 years) |
| Enhancements in CPU and GPU Architectures Accelerating Upgrade Cycles | +1.6% | Global, early adoption in North America and Europe | Short term (≤ 2 years) |
| Growth of Game Streaming Influencing High-Performance Desktop Adoption | +1.2% | North America, Europe, urban Asia-Pacific markets | Medium term (2-4 years) |
| Emergence of AI-Based Upscaling Technology Enabling Higher Frame Rates | +1.0% | Global, premium segment focus in developed markets | Short term (≤ 2 years) |
| Integration of Immersive 3D Audio Hardware in Gaming Desktops | +0.5% | North America, Europe, Japan | Medium term (2-4 years) |
| Source: Mordor Intelligence | |||
Expanding AAA Game Titles Demanding High-End Hardware
Blockbuster releases have lifted baseline specifications. Black Myth Wukong alone moved 18 million copies in its first six months and lists an NVIDIA GeForce RTX 4060 or an AMD Radeon RX 7600 as its minimum GPU requirement, proof that developers now tune assets for current silicon rather than legacy hardware.[1]Valve Corporation, “Black Myth: Wukong System Requirements,” store.steampowered.com Follow-up titles such as Alan Wake 2 require mid-tier Zen 4 or Raptor Lake CPUs paired with 16 GB of DDR5, underscoring the shift to memory. Looking ahead, Ghost of Yotei targets an RTX 5070 baseline, signaling even steeper hardware floors. Each specification bump compresses upgrade windows, directly expanding revenue within the gaming desktop PC market. Component vendors thus capture value every time a headline title resets consumer expectations.
Rising Popularity of Competitive Esports Driving Desktop Preference
Esports organizations have standardized on tower rigs to avoid thermal throttling and ensure sub-10 ms input latency. Team Liquid’s USD 50 million Los Angeles complex runs desktops built around RTX 5090 GPUs and 360 Hz monitors. Wolves Esports opened a EUR 23 million (USD 25 million) arena in Chongqing, embedding similar hardware for both competitors and augmented-reality broadcasts. China shipped 15.13 million gaming PCs in 2026 despite an overall PC contraction, and India posted 24.2% growth in workstation-class rigs, outcomes tightly linked to regional tournament ecosystems. As prize pools rise, professional teams refresh their desktops roughly every 18 months, setting aspirational benchmarks for amateurs and thus widening the market for gaming desktop PCs.
Enhancements in CPU and GPU Architectures Accelerating Upgrade Cycles
NVIDIA’s Blackwell-based RTX 5090 houses 92 billion transistors on a 4 nm process and delivers up to 2.5× the ray-tracing throughput of its predecessor.[2]NVIDIA Corporation, “GeForce RTX 50 Series Graphics Cards,” NVIDIA.com AMD answered with the RDNA 4 Radeon RX 9070 XT, posting a 20% rasterization gain while cutting power draw per frame by 15%. Intel’s Arrow Lake desktop CPUs, fabricated on 3 nm, pushed single-thread uplift into double digits. Together, these leaps justify a two-year refresh cadence for high-end buyers, tilting spend toward the newest silicon and inflating average selling prices within the gaming desktop PC market.
Growth of Game Streaming Influencing High-Performance Desktop Adoption
Content creators rely on dual-PC or high-core-count single-PC setups to stream 1080p video while rendering esports titles at triple-digit frame rates. Twitch and YouTube analytics show a 37% year-over-year increase in channels broadcasting from desktop towers equipped with discrete GPUs and hardware encoders. Hardware vendors now bundle capture cards and 10-gigabit networking as standard in streaming-focused SKUs. As streaming becomes a mainstream aspiration, more mid-range users migrate to desktops that can handle simultaneous encoding and playback, expanding the gaming desktop PC market’s addressable base.
Restraint Impact Analysis*
| Restraint | (~) % Impact on CAGR Forecast | Geographic Relevance | Impact Timeline |
|---|---|---|---|
| Supply Chain Volatility for Advanced Semiconductor Nodes | -1.4% | Global, acute in North America and Europe due to allocation priorities | Short term (≤ 2 years) |
| Inflation-Driven Surges in Component Pricing Affecting Affordability | -1.2% | Global, most pronounced in price-sensitive markets such as South America and Southeast Asia | Medium term (2-4 years) |
| Energy Consumption Concerns Prompting Regulatory Scrutiny | -0.6% | Europe, California, emerging in Asia-Pacific | Long term (≥ 4 years) |
| Niche Shift Toward Cloud Gaming Reducing Hardware Demand | -0.4% | North America, Europe, urban Asia-Pacific with high-speed broadband | Medium term (2-4 years) |
| Source: Mordor Intelligence | |||
Supply Chain Volatility for Advanced Semiconductor Nodes
TSMC’s 3 nm and 5 nm production lines remained fully booked throughout 2025, leading to wafer price increases of up to 10% and extending CoWoS package lead times to approximately 78 weeks. As a result, NVIDIA’s RTX 5090 launch faced significant supply constraints, with only 15%-20% of the planned volume being shipped. This limited availability caused street prices to surge by 30%, creating a challenging market environment. While scarcity prompted enthusiasts to pay higher premiums to secure the product, mid-range buyers opted to delay their upgrades. This trend ultimately dampened unit growth in the gaming desktop PC market during periods of component shortages.
Inflation-Driven Surges in Component Pricing Affecting Affordability
DDR5 modules jumped from USD 5.50 per GB in early 2024 to more than USD 20 by late 2025, now accounting for over 80% of GPU bill-of-materials costs. GPU launch MSRPs rose in tandem; RTX 50-series cards are 15%-32% dearer than their predecessors. In South America, tariffs and weak currencies pushed desktop ASPs up 22%, softening demand among first-time buyers. System integrators counter with financing plans, but affordability remains a drag on the gaming desktop PC market, where disposable income trails component inflation.
*Our forecasts treat driver/restraint impacts as directional, not additive. The impact forecasts reflect baseline growth, mix effects, and variable interactions.
Segment Analysis
By Component: GPUs Outpace CPUs in Growth Trajectory
Graphics cards are projected to grow 10.61% per year through 2031, outpacing every other hardware class as AI-enhanced frame generation and ray tracing raise performance ceilings. Central processing units still accounted for 34.13% of 2025 revenue, yet the spend tilt now approaches a 70-30 ratio in favor of GPUs in the enthusiast tier. Memory vendors benefit as DDR5 becomes the baseline, while PCIe Gen5 NVMe drives cut load times to seconds, reshaping player expectations for open-world latency.
The gaming desktop PC market continues to reward vendors that bundle premium cooling, PSU efficiency ratings, and RGB ecosystems. Corsair’s Vengeance i8200 line, priced from USD 2,499, pairs RTX 50-series GPUs with tempered-glass cases and sold-through within weeks of launch. Such turnkey rigs illustrate how aesthetic and thermal features lift margins beyond the core silicon play, a dynamic likely to persist as gamers equate visual flair with perceived value.


By Price Range: Enthusiast Tier Gains Momentum
Mid-range systems between USD 1,000 and 1,999 accounted for 41.74% of 2025 revenue, pairing Ryzen 7 or Core i7 chips with RTX 4060 Ti-class GPUs for 1440p at 120 fps. Yet builds costing above USD 3,000 are forecast to grow at 9.41% CAGR, the fastest among all brackets, because content creators and esports athletes require RTX 5090 horsepower and 64 GB of fast DDR5. Hardware scarcity has barely dented this cohort’s willingness to spend, as evidenced by ASUS’s USD 4,999 ROG Strix SCAR 18 desktop selling out inside 48 hours.
Conversely, entry-level towers priced under USD 1,000 are increasingly being replaced by gaming laptops and upgraded gaming consoles, which offer competitive performance and portability. This trend highlights the growing income disparity among consumers. Affluent enthusiasts continue to view desktops as long-term investments, often treating them as five-year capital goods. On the other hand, budget-conscious buyers are shifting towards cloud gaming sessions as a temporary solution until desktop prices stabilize. This shift in consumer behavior is slowing unit growth in the lower segment of the gaming desktop PC market.
By End User: Esports Professionals Drive Premium Demand
Individual gamers accounted for 49.84% of the total outlays in 2025, highlighting their significant contribution to the gaming desktop PC market. However, professional esports teams and players are expected to experience a robust annual growth rate of 9.61% through 2031, making them the fastest-growing segment among all user cohorts. Facilities such as Team Liquid’s Los Angeles training center emphasize hardware upgrades as strategic necessities, with specifications including RTX 5090 GPUs and 360 Hz monitors for every workstation. This trend underscores the growing demand for high-performance gaming desktops in the esports industry. Additionally, gaming cafés in regions like China and South Korea upgraded nearly one-third of their systems in 2025, focusing on durability to support extended 16-hour operational cycles, which are common in these establishments.
Although universities and vocational schools represent the smallest segment of the market, they still achieved a notable 7.8% growth rate in 2025. This growth is driven by the increasing adoption of design and simulation programs that require GPU acceleration, further validating the relevance of high-spec desktops in academic settings. The rising demand from educational institutions adds another layer of sustained revenue opportunities within the gaming desktop PC market, reinforcing its long-term growth potential.
By Distribution Channel: Online Retail Sustains Dominance
E-commerce accounted for 57.28% of the total revenue in 2025 and is expected to sustain a 9.79% compound annual growth rate (CAGR) over the forecast period. This growth is primarily driven by the availability of advanced build configurators that allow customers to customize every component, including motherboards, coolers, and lighting options, to meet their specific needs. Additionally, content-creator affiliate links have become a significant driver of sales, contributing approximately 45% of transactions for brands like CyberPowerPC and NZXT. This trend underscores the growing influence of social media platforms on consumer purchasing behavior. On the other hand, brick-and-mortar stores, which typically offer a limited selection of pre-configured SKUs, face constraints in upselling opportunities, restricting their market share to 22%.
Original Equipment Manufacturer (OEM) direct sales and Value-Added Reseller (VAR) integrators continue to play a vital role in catering to bulk buyers, such as educational institutions and esports arenas. These channels provide added value through bundled services, including extended warranties and asset-tagging solutions, which are particularly appealing to large-scale buyers. However, for individual consumers in the gaming desktop PC market, the convenience of online channels remains unparalleled. The ability to order customized systems with just a few clicks, combined with flexible financing options, has significantly lowered entry barriers for consumers, even as average selling prices (ASPs) continue to rise.
Geography Analysis
North America retained 46.13% of the gaming desktop PC market share in 2025, driven by the United States’ significant 38 million-unit install base and Canada’s ongoing investments in upgrading LAN centers to meet growing consumer demand. Mexico experienced a notable 9.3% growth rate, supported by the economic benefits of nearshoring, which boosted incomes in key manufacturing hubs and increased spending on gaming hardware. The region’s projected compound annual growth rate (CAGR) of 7.9% highlights the market's transition toward maturity, indicating that the slower growth is due to market saturation rather than a decline in consumer interest or enthusiasm for gaming desktop PCs.
Asia-Pacific is projected to grow 9.81% annually between 2026 and 2031, the swiftest pace worldwide. China’s 3.1% year-over-year unit gain in 2026 contrasts with an overall PC downturn, while India’s 10.2% desktop expansion highlights a pivot toward creator-grade rigs. South Korea’s 3,200 PC bangs, Japan’s niche full-tower revival, and Southeast Asia’s double-digit gains underscore a broad-based ascent that will reshape the global gaming desktop PC market size landscape.
Europe contributed 28% of 2025 sales, but new efficiency caps limiting idle power to 50 W and active draw to 200 W threaten ultra-high-end builds, especially RTX 5090 configurations.[3]European Commission, “Ecodesign Directive for Computers,” ec.europa.eu Germany remained the regional bellwether, the United Kingdom grappled with post-Brexit import costs, and Southern Europe logged above-average growth as younger demographics bought first-time towers. South America’s trajectory stayed subdued by currency swings, while the Middle East and Africa posted resilient 8.1% growth thanks to esports-centric public investment.

Competitive Landscape
The gaming desktop PC market is moderately fragmented. The top five vendors, ASUS, MSI, Dell, HP, and Lenovo, captured about 52% of 2025 shipments. ASUS alone generated TWD 1.86 trillion (USD 60.3 billion) in 2024, with its Republic of Gamers line contributing 22% of sales. Corsair, NZXT and CyberPowerPC carve out profitable niches by offering bespoke aesthetics, liquid cooling and lifetime support, even though their combined volume share sits under 12%.
Upstream, NVIDIA and AMD wield bargaining power by allocating flagship silicon only to partners meeting marketing and volume thresholds. This gatekeeping favored vendors such as ASUS during the constrained RTX 5090 rollout, sidelining smaller integrators that rely on open allocations. Emerging challengers like Skytech Gaming exploit influencer partnerships to undercut incumbents by 12%-15% at the USD 1,500-2,500 price band, while NZXT’s BLD configurator simplified decision flows enough to secure 18% of that segment in 2025.
Technology-wise, thermal engineering and AI-driven frame generation dominate differentiation. ASUS’s ROG NUC 2025 crams an RTX 5080 into a 2.5-liter enclosure with vapor-chamber cooling validated under IEEE test protocols.[4]IEEE, “Desktop Computer Thermal Test Methods,” ieee.org Dell’s Alienware line now offers tool-less GPU swaps, signaling a shift toward sustainability and modularity that could lengthen chassis life even as silicon refreshes stay aggressive. Overall, price-performance, supply access and service ecosystems dictate share swings more than baseline component parity.
Gaming Desktop PC Industry Leaders
ASUSTeK Computer Inc.
Micro-Star International Co., Ltd.
Dell Technologies Inc.
HP Inc.
Lenovo Group Limited
- *Disclaimer: Major Players sorted in no particular order

Recent Industry Developments
- February 2026: Ryuku Studios confirmed Ghost of Yotei will launch in Q2 2026 and published PC requirements that list an NVIDIA RTX 5070 as the baseline GPU.
- January 2026: The European Union’s Ecodesign Directive for computers and displays entered into force, capping idle power at 50 W and active draw at 200 W for desktops with discrete GPUs.
- December 2025: Wolves Esports inaugurated a EUR 23 million (USD 25 million) arena in Chongqing outfitted with RTX 5090 desktop rigs and broadcast-grade infrastructure.
- March 2025: AMD rolled out the Radeon RX 9070 XT and RX 9070 GPUs on RDNA 4 architecture, delivering 20% higher raster efficiency versus the prior generation.


Global Gaming Desktop PC Market Report Scope
The Gaming Desktop PC Market refers to the global industry focused on the design, manufacturing, assembly, and distribution of high-performance desktop computers and related hardware components specifically optimized for gaming applications. These systems are engineered to deliver superior graphics rendering, high frame rates, low latency, and immersive experiences, supporting modern gaming demands, including AAA titles, esports competition, virtual reality, and game streaming.
The Gaming Desktop PC Market Report is Segmented by Component (CPU, GPU, Memory, Storage, Motherboards, PSU, Cooling Solutions, PC Cases, and Peripherals), Price Range (Mid-Range, High-End, and Enthusiast/Extreme), End-User Industry (Individual Gamers, Professional Esports, Gaming Cafés, and Educational Institutes), Distribution Channel (Online Retail, Offline Retail, OEM/Direct Sales, nd System Integrators), and Geography (North America, South America, Europe, Asia-Pacific, and Middle East and Africa). The Market Forecasts are Provided in Terms of Value (USD).
| Central Processing Unit (CPU) |
| Graphics Processing Unit (GPU) |
| Memory (RAM) |
| Storage (SSD and HDD) |
| Motherboards |
| Power Supply Units (PSU) |
| Cooling Solutions |
| PC Cases |
| Peripherals and Accessories |
| Mid-Range (USD 1,000-1,999) |
| High-End (USD 2,000-2,999) |
| Enthusiast / Extreme (USD 3,000 and Above) |
| Individual Gamers |
| Professional Esports Teams and Players |
| Gaming Cafés and LAN Centers |
| Educational and Training Institutes |
| Online Retail and E-commerce |
| Offline Retail Stores |
| OEM / Direct Sales |
| System Integrators and VARs |
| North America | United States | |
| Canada | ||
| Mexico | ||
| South America | Brazil | |
| Argentina | ||
| Rest of South America | ||
| Europe | United Kingdom | |
| Germany | ||
| France | ||
| Italy | ||
| Spain | ||
| Rest of Europe | ||
| Asia-Pacific | China | |
| Japan | ||
| India | ||
| South Korea | ||
| Rest of Asia-Pacific | ||
| Middle East and Africa | Middle East | United Arab Emirates |
| Saudi Arabia | ||
| Rest of Middle East | ||
| Africa | South Africa | |
| Egypt | ||
| Rest of Africa | ||
| By Component | Central Processing Unit (CPU) | ||
| Graphics Processing Unit (GPU) | |||
| Memory (RAM) | |||
| Storage (SSD and HDD) | |||
| Motherboards | |||
| Power Supply Units (PSU) | |||
| Cooling Solutions | |||
| PC Cases | |||
| Peripherals and Accessories | |||
| By Price Range | Mid-Range (USD 1,000-1,999) | ||
| High-End (USD 2,000-2,999) | |||
| Enthusiast / Extreme (USD 3,000 and Above) | |||
| By End-User Industry | Individual Gamers | ||
| Professional Esports Teams and Players | |||
| Gaming Cafés and LAN Centers | |||
| Educational and Training Institutes | |||
| By Distribution Channel | Online Retail and E-commerce | ||
| Offline Retail Stores | |||
| OEM / Direct Sales | |||
| System Integrators and VARs | |||
| By Geography | North America | United States | |
| Canada | |||
| Mexico | |||
| South America | Brazil | ||
| Argentina | |||
| Rest of South America | |||
| Europe | United Kingdom | ||
| Germany | |||
| France | |||
| Italy | |||
| Spain | |||
| Rest of Europe | |||
| Asia-Pacific | China | ||
| Japan | |||
| India | |||
| South Korea | |||
| Rest of Asia-Pacific | |||
| Middle East and Africa | Middle East | United Arab Emirates | |
| Saudi Arabia | |||
| Rest of Middle East | |||
| Africa | South Africa | ||
| Egypt | |||
| Rest of Africa | |||


Key Questions Answered in the Report
How fast is the gaming desktop PC market expected to grow through 2031?
Value is projected to advance from USD 45.83 billion in 2026 to USD 69.89 billion by 2031, posting an 8.81% CAGR.
Which component will contribute most to incremental revenue?
Graphics processing units are forecast to rise 10.61% annually, outpacing CPUs and driving most of the new spend.
Why are enthusiast-grade PCs growing faster than mid-range builds?
Esports professionals and content creators require RTX 5090-level performance and 64 GB DDR5 memory, pushing the USD 3,000+ bracket to a 9.41% CAGR.
What share of sales already flows through online channels?
E-commerce captured 57.28% of 2025 revenue and should maintain dominance thanks to build configurators and influencer referrals.
Which region will deliver the highest growth rate?
Asia-Pacific is set to expand at 9.81% between 2026-2031, fueled by China's shipment gains and India's creator economy.
How concentrated is vendor competition?
The top five brands hold 52% share, reflecting moderate concentration that still leaves room for boutique integrators.
Page last updated on:


