Computer Graphics Market Size and Share
Market Overview
| Study Period | 2019 - 2030 |
|---|---|
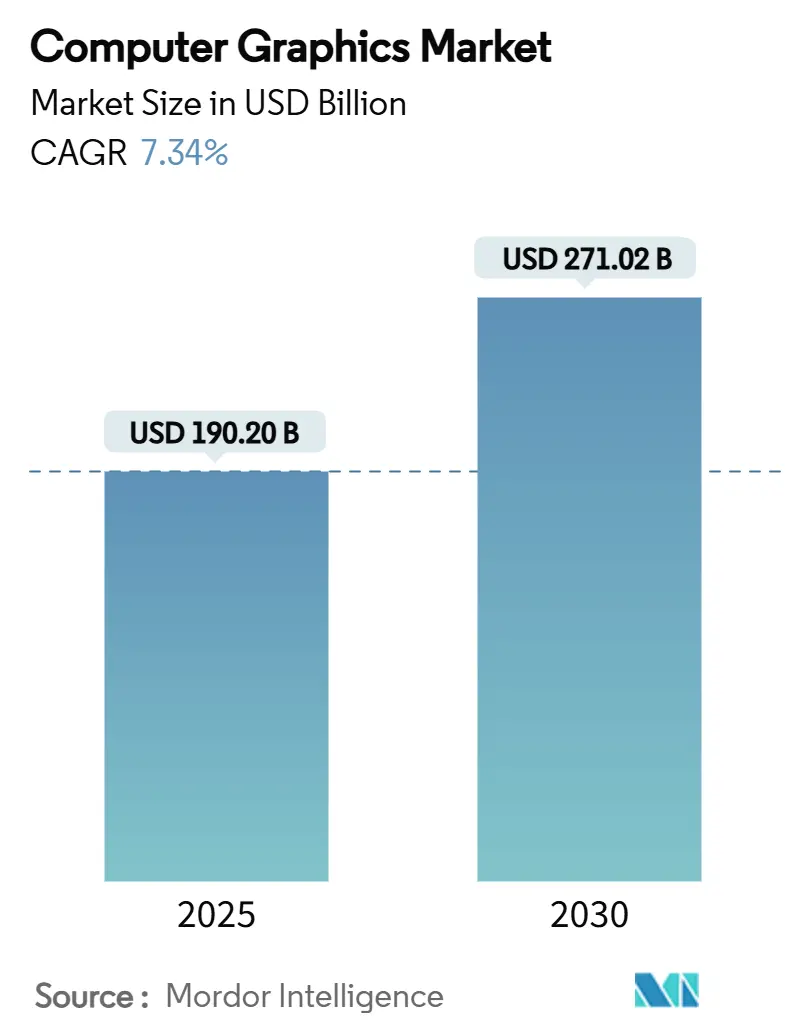
| Market Size (2025) | USD 190.20 Billion |
| Market Size (2030) | USD 271.02 Billion |
| Growth Rate (2025 - 2030) | 7.34% CAGR |
| Fastest Growing Market | Asia Pacific |
| Largest Market | North America |
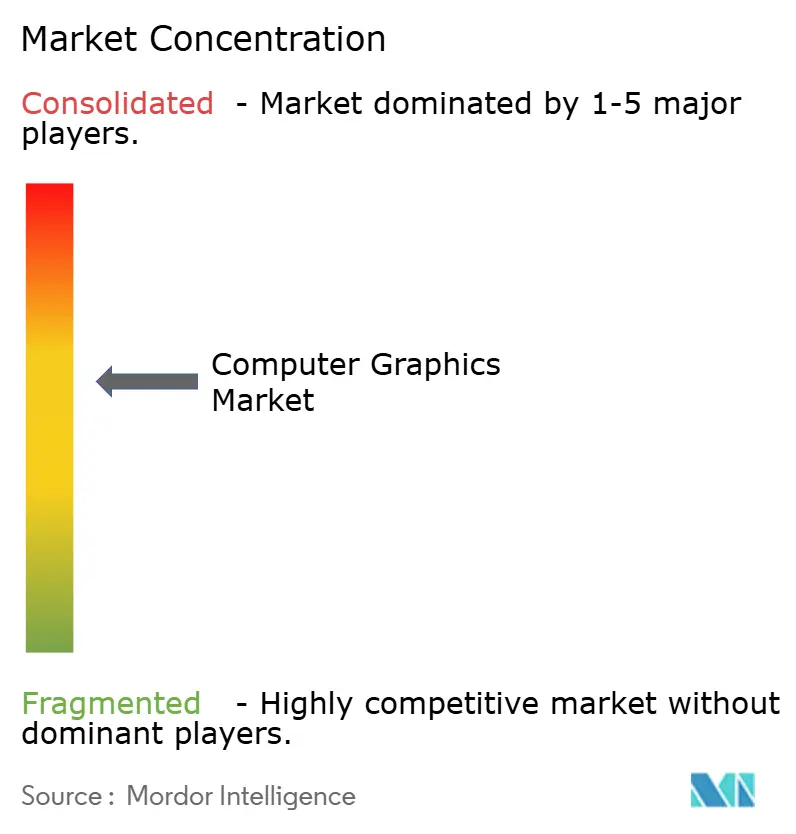
| Market Concentration | Medium |
Major Players
*Disclaimer: Major Players sorted in no particular order Image © Mordor Intelligence. Reuse requires attribution under CC BY 4.0. |
|
Computer Graphics Market Analysis by Mordor Intelligence
The computer graphics market size stands at USD 190.20 billion in 2025 and is on track to reach USD 271.02 billion by 2030, registering a 7.34% CAGR across the forecast window. This growth reflects sustained investments in GPU-accelerated infrastructure, the fusion of real-time rendering with artificial intelligence, and rising enterprise demand for cloud-hosted visualization workflows. North America maintains technology leadership through deep capital deployment in data-center GPUs, while Asia-Pacific accelerates on the back of manufacturing modernization and consumer electronics adoption. Software platforms capture the lion’s share of value creation as vendors bundle design, rendering, collaboration, and AI content generation under subscription models, while services grow fastest as enterprises outsource managed graphics environments. Hardware sales continue to rise even as supply chain volatility around advanced nodes exerts pricing pressure and reinforces the strategic value of in-house semiconductor design capability.
Key Report Takeaways
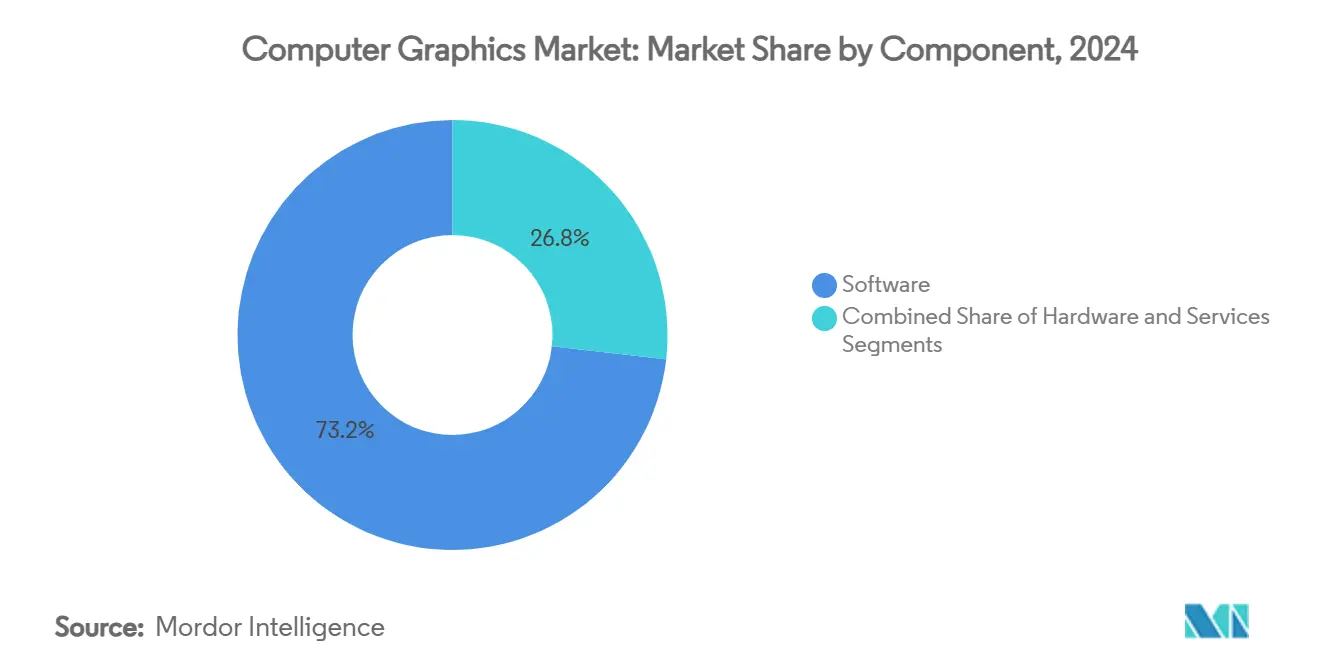
- By component, software held 73.2% of computer graphics market share in 2024, whereas services are forecast to post an 8.8% CAGR through 2030.
- By application, gaming and entertainment contributed 42.3% of the computer graphics market size in 2024; augmented and virtual reality is projected to advance at an 8.5% CAGR during the same period.
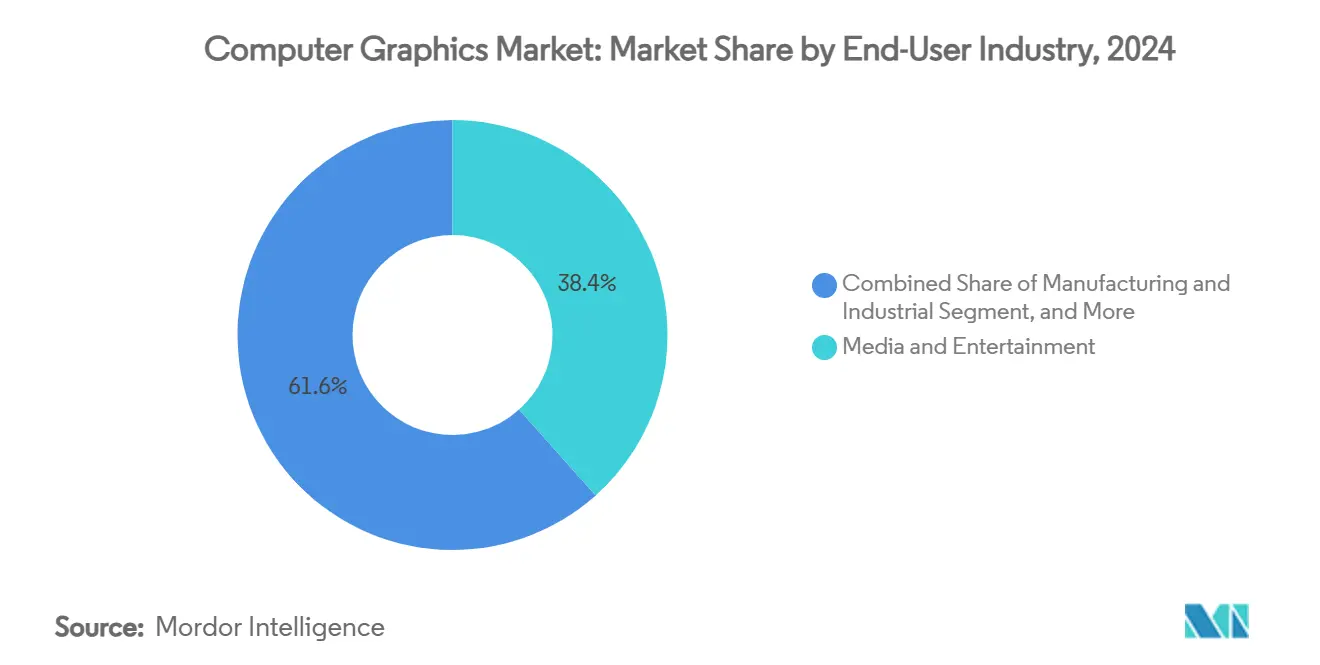
- By end-user industry, media and entertainment commanded 38.4% of the computer graphics market size in 2024, while healthcare and life sciences record the fastest growth at an 8.2% CAGR.
- By deployment model, on-premise systems accounted for 66.3% of computer graphics market share in 2024; cloud deployment is expanding at an 8.1% CAGR as GPU-as-a-Service gains traction.
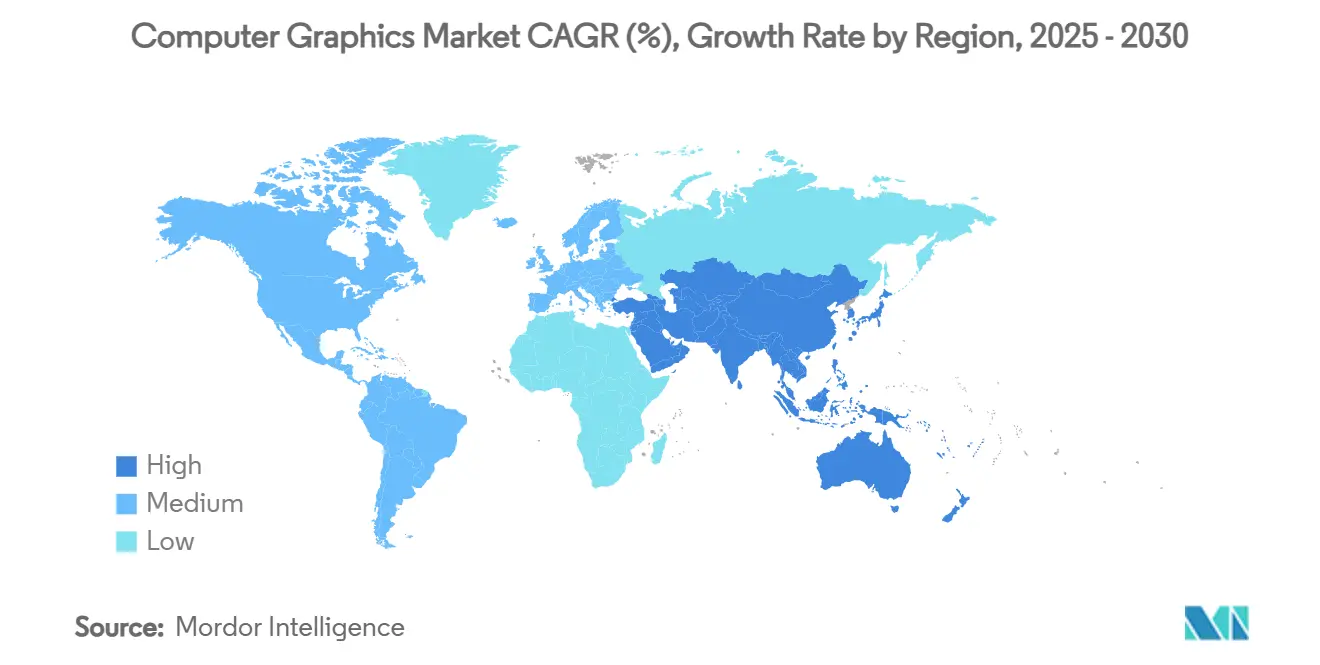
- By geography, North America led with 38.7% revenue share in 2024, whereas Asia-Pacific is set to grow at an 8.4% CAGR through 2030.
Global Computer Graphics Market Trends and Insights
Drivers Impact Analysis*
| Driver | (~) % Impact on CAGR Forecast | Geographic Relevance | Impact Timeline |
|---|---|---|---|
| Surging demand for immersive gaming and entertainment | +1.2% | Global, with concentration in North America and APAC | Medium term (2-4 years) |
| Rapid CAD and 3D-model adoption in AEC and manufacturing | +1.8% | North America & EU, expanding to APAC manufacturing hubs | Long term (≥ 4 years) |
| GPU-accelerated AI and data-center workloads expansion | +1.5% | Global, led by North America and China | Short term (≤ 2 years) |
| Proliferation of AR/VR devices and metaverse initiatives | +0.9% | North America & EU early adoption, APAC volume growth | Medium term (2-4 years) |
| Edge rendering for in-vehicle infotainment and ADAS visualization | +1.1% | Global automotive markets, led by Germany, Japan, China | Long term (≥ 4 years) |
| Cloud-native real-time collaborative rendering pipelines | +0.9% | Global, with enterprise concentration in developed markets | Medium term (2-4 years) |
| Source: Mordor Intelligence | |||
Surging Demand for Immersive Gaming and Entertainment
The transition to photorealistic ray-traced visuals pushes GPU architectures toward ever-higher concurrency, memory bandwidth, and latency reduction. More than half of AAA studios have migrated from proprietary engines to Epic Games’ Unreal Engine, creating standardized workload profiles that accelerate silicon optimization. [1]Karl Kontus, “The Big Game Engine Report of 2025,” INVESTGAME.NET, investgame.netCloud gaming multiplies compute requirements because each concurrent user session demands a dedicated virtualized GPU, intensifying capacity expansion cycles in hyperscale data centers. Techniques perfected for real-time game rendering now underpin virtual production stages in film and live event broadcasting, broadening the revenue base for GPU manufacturers. Cross-pollination between gaming and professional visualization sustains licensing growth for high-end middleware and shader toolchains. The feedback loop between software-defined visual fidelity and hardware specialization remains a structural driver for the computer graphics market.
Rapid CAD and 3D-Model Adoption in AEC and Manufacturing
Integrated design-to-manufacture workflows reduce change-order latency and rework, incentivizing enterprises to consolidate on end-to-end software suites. Autodesk posted double-digit revenue growth in its Architecture, Engineering, Construction and Operations segment through 2025, with recurring revenue exceeding 97%, underscoring strong lock-in once advanced CAD systems are embedded.[2]Autodesk Inc., “Autodesk, Inc. Announces Fiscal 2026 First Quarter Results,” autodesk.comDigital-twin programs in discrete and process industries demand continuous 3D visualization of production assets, driving multi-site deployments of workstation-class GPUs. Premium licensing—illustrated by Siemens NX crossing USD 9,000 per seat—signals sustained pricing power for vendors delivering physics-accurate surfacing, simulation, and generative design. Manufacturing clusters in Vietnam, India, and Mexico increasingly adopt such platforms to integrate design with flexible automation, reinforcing global demand diversification.
GPU-Accelerated AI and Data-Center Workloads Expansion
Graphics processors have become the default accelerator for large-language models and computer-vision inference, shifting the procurement calculus for cloud providers. Amazon Web Services engineered an in-row heat-exchanger system to cool high-density racks housing 72-GPU NVL72 nodes, validating new form-factor standards tailored to AI graphics processing. Performance metrics now prioritize tensor throughput and memory coherence over traditional frame-rate benchmarks, compelling vendors to optimize interconnect topologies and advanced packaging. The rise of neocloud providers that specialize in multi-tenant GPU clusters is opening an alternative channel projected to scale eightfold between 2024 and 2027. These dynamics strengthen vertical integration strategies among chipmakers and cloud operators, ultimately widening the total addressable computer graphics market.
Proliferation of AR/VR Devices and Metaverse Initiatives
Mixed-reality headsets are segmenting into premium professional solutions and cost-optimized consumer devices. Apple’s Vision Pro targets enterprise collaboration, remote assistance, and 3D content creation, while Meta’s Quest 3 concentrates on entertainment and social engagement, resulting in diverging GPU performance envelopes. This bifurcation compels silicon teams to balance rasterization efficiency, power budgets, and thermal constraints across product tiers. Industrial training, maintenance, and telepresence projects are moving from pilot to production, ensuring repeat hardware refresh cycles. Content developers leverage the same asset pipelines across two-dimensional screens and spatial canvases, smoothing the learning curve and spurring ecosystem expansion. Enterprise interest in secure metaverse environments ensures the longevity of AR/VR-driven demand inside the computer graphics market.
Restraints Impact Analysis*
| Restraint | (~) % Impact on CAGR Forecast | Geographic Relevance | Impact Timeline |
|---|---|---|---|
| High cost and power needs of high-end GPUs | -0.8% | Global, particularly affecting emerging markets | Short term (≤ 2 years) |
| Software piracy and open-source substitution | -0.6% | Global, with higher impact in price-sensitive markets | Medium term (2-4 years) |
| Advanced-node semiconductor supply-chain volatility | -0.7% | Global, with acute impact on North America and EU | Short term (≤ 2 years) |
| Talent shortage in real-time path-tracing and shader programming | -0.5% | North America & EU primarily, expanding to APAC | Long term (≥ 4 years) |
| Source: Mordor Intelligence | |||
High Cost and Power Needs of High-End GPUs
Flagship workstation cards now draw upward of 700 watts, necessitating upgraded power delivery, liquid cooling, and reinforced chassis, which together inflate acquisition budgets. For many mid-tier studios and universities, the total cost of ownership surpasses the gains from real-time path-tracing, prolonging refresh cycles. Foundry concentration at advanced nodes compounds scarcity premiums, with high-end AI-capable GPUs routinely allocated to hyperscalers first. Data center landlords confront power-usage-effectiveness constraints that limit rack densities, forcing costly real-estate expansions or off-site colocation. These economics temper near-term adoption rates and shave points off the aggregate computer graphics market CAGR.
Software Piracy and Open-Source Substitution
Community-driven applications such as Blender have reached functional parity in modeling, shading, and compositing, offering legitimate alternatives to costly licenses. Educational institutions in Southeast Asia and Eastern Europe frequently deploy open-source stacks to contain budgets, eroding the entry-level funnel for commercial vendors. Meanwhile, piracy persists despite cloud activation keys, with cracked versions circulating on peer-to-peer networks within weeks of release. Adobe counters by embedding proprietary generative AI engines like Firefly, which created 22 billion assets globally within its first year, reinforcing unique value behind paywalls [ADOBE.COM]. Vendors that cannot layer differentiated AI or cloud collaboration risk accelerated commoditization and revenue leakage.
*Our forecasts treat driver/restraint impacts as directional, not additive. The impact forecasts reflect baseline growth, mix effects, and variable interactions.
Segment Analysis
By Component: Software Dominance Drives Platform Integration
Software commanded 73.2% of computer graphics market share in 2024 as enterprises opted for cohesive ecosystems that unify creation, rendering, asset management, and AI-assisted content generation. Adobe recorded USD 5.87 billion in quarterly revenue during FY 2025 on the strength of its Digital Media cloud, while its Firefly AI suite generated USD 125 million in annualized recurring revenue, underscoring monetization upside from embedded generative tools. The computer graphics market size attributed to software subscriptions is projected to widen as standalone perpetual licenses fade in favor of value-added cloud services. Continuous delivery of new features via micro-updates locks customers into multi-year agreements, raising switching barriers and smoothing revenue visibility.
Services emerge as the fastest-growing component at an 8.8% CAGR through 2030, reflecting heightened demand for managed render pipelines, GPU cluster orchestration, and professional onboarding. Consulting majors are scaling practice lines to capture this momentum; Capgemini’s acquisition of Unity’s Digital Twin Professional Services arm brings real-time 3D implementation expertise to its industrial client base. Hardware, although essential, faces margin compression as node migrations grow costlier and supply tightness elevates wafer pricing. Nevertheless, novel chiplets and 2.5D packaging help vendors deliver performance gains while distributing thermal loads, keeping the hardware slice of the computer graphics market stable in absolute terms.


By Application: Gaming Leads While AR/VR Accelerates
Gaming and entertainment retained 42.3% of the computer graphics market size in 2024, buoyed by blockbuster releases and live-service update cycles that demand continuous asset production. However, Unity’s revenue slid to USD 1.813 billion in 2024, a 17.1% dip that signals intensifying competition from Unreal Engine, particularly among AAA projects. Cloud streaming of high-fidelity titles is a double-edged sword: it expands total addressable audiences yet shifts monetization toward platform-level subscriptions, prompting publishers to diversify revenue streams through in-game item marketplaces and ad placements.
Augmented and virtual reality applications are projected to grow at an 8.5% CAGR as enterprises co-opt immersive platforms for training, product visualization, and remote diagnostics. automotive, pharma, and energy firms increasingly integrate head-mounted displays into operational workflows, transferring skill retention benefits initially validated in gaming. Image and video processing workloads likewise expand, driven by short-form social content and AI-assisted editing that automates rotoscoping and color grading. The convergence of rendering and machine learning spawns hybrid applications such as text-to-3D asset generators, fostering fresh revenue streams across the computer graphics market.
By End-User Industry: Media Leads, Healthcare Surges
Media and entertainment held 38.4% of computer graphics market share in 2024, propelled by streaming platforms’ insatiable appetite for cinematic-quality originals and localized visual effects. Studios leverage virtual production stages that shorten shooting schedules and enable real-time set extensions, intensifying demand for high-refresh-rate LED walls and synchronized GPU clusters.
Healthcare and life sciences, advancing at an 8.2% CAGR, stand out as the fastest-growing end-user segment. GE HealthCare’s collaboration with NVIDIA on autonomous X-ray and ultrasound solutions demonstrates how graphics-accelerated AI is tackling clinician shortages while elevating diagnostic accuracy. [3]GE HealthCare, "GE HealthCare and NVIDIA reimagine diagnostic imaging with autonomous X-ray and ultrasound solutions," investor.gehealthcare.comSurgical planning simulators and molecule-level visualization for drug discovery extend use cases, unlocking new addressable pools within the broader computer graphics market. Architecture, engineering, and construction sustain momentum via building-information modeling mandates, whereas automotive and aerospace sectors deepen reliance on photorealistic simulation to validate designs before prototyping.
By Deployment Model: Cloud Migration Accelerates
On-premise environments retained 66.3% of computer graphics market share in 2024 due to latency-sensitive workflows and data-sovereignty obligations in defense, media, and financial services. Even so, cloud deployments will outpace, expanding at an 8.1% CAGR as hyperscalers roll out dedicated GPU instances and turnkey AI render stacks. AWS and NVIDIA’s Project Ceiba demonstrates this trajectory with a supercomputer hosting 20,736 B200 GPUs to serve generative workloads at scale.
Managed service providers are positioning alongside hyperscalers; Rackspace Technology introduced an on-demand H100 GPU platform that targets enterprises seeking elasticity without vendor lock-in [RACKSPACE.COM]. Hybrid blueprints—where burst rendering jobs overflow to cloud during production peaks—offer migration bridges, ensuring the computer graphics market continues to shift steadily toward consumption-based models while preserving existing capital assets.
Geography Analysis
North America captured 38.7% of 2024 revenue owing to its dense constellation of GPU design houses, content studios, and cloud data centers. The CHIPS Act’s incentives for domestic fabs further solidify local hardware supply, shortening lead times for workstation and server procurement. Public-sector investments in digital twin infrastructure for transport and energy projects add incremental vectors for graphics demand.
Asia-Pacific exhibits the strongest momentum, with an 8.4% CAGR forecast through 2030 as governments promote smart manufacturing and consumer electronics adoption surges. China’s ongoing capacity build-out for advanced packaging and Japan’s rebound in lithography equipment output underpin wider access to performance GPUs. Regional game publishers and social-video apps also cultivate content ecosystems that absorb substantial rendering cycles.
Europe maintains steady growth rooted in automotive visualization and compliance-driven BIM adoption, while Latin America and Middle East-Africa accelerate from a lower base through e-learning platforms and national media digitization initiatives. These geographical differentials collectively broaden the revenue mix for the computer graphics market.

Competitive Landscape
The computer graphics market is highly concentrated at both silicon and software layers. NVIDIA commands roughly 80-90% of AI-optimized GPU shipments, an advantage fortified by CUDA’s entrenched developer stack.[4]Michael Cusumano, “NVIDIA at the Center of the Generative AI Ecosystem – For Now,” Communications of the ACM, cacm.acm.orgAMD counters via an open-ecosystem strategy emphasizing ROCm and yearly cadence AI accelerators, a posture that yielded notable data-center revenue gains in early 2025. On the software side, Adobe and Autodesk wield premium pricing leverage through integrated creative and engineering clouds, recognizable brand equity, and deep workflows that expose high switching costs.
Emerging challengers exploit cloud-native specialization. CoreWeave’s filing for an IPO after securing an USD 11.9 billion multiyear deal with OpenAI illustrates the value in tailoring infrastructure expressly for large-scale generative models. White-space remains in edge-graphics silicon where power envelopes and thermal budgets impose new product constraints beyond traditional data-center GPUs.
Strategic M&A shapes the competitive chessboard: Autodesk’s purchase of Wonder Dynamics adds AI-assisted character animation, while NVIDIA’s acquisition of OctoAI extends enterprise model-optimization tooling. Overall, incumbents fortify moats through vertical integration, yet the rate of innovation ensures a constant influx of niche disruptors feeding dynamism into the computer graphics market.
Computer Graphics Industry Leaders
-
NVIDIA Corporation
-
Adobe Inc.
-
Autodesk, Inc.
-
Advanced Micro Devices, Inc.
-
Dassault Systèmes SE
- *Disclaimer: Major Players sorted in no particular order

Recent Industry Developments
- July 2025: NVIDIA introduced DiffusionRenderer, an AI approach for precise 3D scene editing and photorealistic image generation, streamlining content workflows in gaming and film.
- July 2025: CLO Virtual Fashion acquired swatchbook to expand digital material visualization for apparel design.
- May 2025: Autodesk reported 15% revenue growth for Q1 FY 2026, reaching USD 1.633 billion, with AECO segment up 20%.
- April 2025: Adobe launched Firefly, an integrated AI content-creation hub that has generated 22 billion assets globally.


Global Computer Graphics Market Report Scope
| Hardware |
| Software |
| Services |
| Computer-Aided Design (CAD) |
| Gaming and Entertainment |
| Visualization and Simulation |
| Image/Video Processing |
| Augmented and Virtual Reality |
| Media and Entertainment |
| Architecture, Engineering and Construction (AEC) |
| Manufacturing and Industrial |
| Healthcare and Life Sciences |
| Automotive and Transportation |
| Aerospace and Defense |
| Education and Research |
| On-premise |
| Cloud / GPU-as-a-Service |
| North America | United States | |
| Canada | ||
| Mexico | ||
| South America | Brazil | |
| Argentina | ||
| Rest of South America | ||
| Europe | Germany | |
| United Kingdom | ||
| France | ||
| Italy | ||
| Russia | ||
| Rest of Europe | ||
| Asia-Pacific | China | |
| Japan | ||
| India | ||
| South Korea | ||
| Rest of Asia-Pacific | ||
| Middle East and Africa | Middle East | Saudi Arabia |
| United Arab Emirates | ||
| Turkey | ||
| Rest of Middle East | ||
| Africa | South Africa | |
| Nigeria | ||
| Rest of Africa | ||
| By Component | Hardware | ||
| Software | |||
| Services | |||
| By Application | Computer-Aided Design (CAD) | ||
| Gaming and Entertainment | |||
| Visualization and Simulation | |||
| Image/Video Processing | |||
| Augmented and Virtual Reality | |||
| By End-User Industry | Media and Entertainment | ||
| Architecture, Engineering and Construction (AEC) | |||
| Manufacturing and Industrial | |||
| Healthcare and Life Sciences | |||
| Automotive and Transportation | |||
| Aerospace and Defense | |||
| Education and Research | |||
| By Deployment Model | On-premise | ||
| Cloud / GPU-as-a-Service | |||
| By Geography | North America | United States | |
| Canada | |||
| Mexico | |||
| South America | Brazil | ||
| Argentina | |||
| Rest of South America | |||
| Europe | Germany | ||
| United Kingdom | |||
| France | |||
| Italy | |||
| Russia | |||
| Rest of Europe | |||
| Asia-Pacific | China | ||
| Japan | |||
| India | |||
| South Korea | |||
| Rest of Asia-Pacific | |||
| Middle East and Africa | Middle East | Saudi Arabia | |
| United Arab Emirates | |||
| Turkey | |||
| Rest of Middle East | |||
| Africa | South Africa | ||
| Nigeria | |||
| Rest of Africa | |||


Key Questions Answered in the Report
How large is the computer graphics market in 2025 and how fast is it growing?
The computer graphics market size is USD 190.20 billion in 2025 and is forecast to grow at a 7.34% CAGR to 2030.
The computer graphics market size is USD 190.20 billion in 2025 and is forecast to grow at a 7.34% CAGR to 2030.
Software accounts for 73.2% of revenue thanks to subscription-based creative, CAD and AI platforms.
Which application segment is expanding fastest beyond gaming?
Augmented and virtual reality workloads are projected to grow at an 8.5% CAGR through 2030 on rising enterprise adoption.
What region offers the strongest growth outlook?
Asia-Pacific shows the highest trajectory with an 8.4% CAGR, driven by manufacturing modernization and consumer electronics demand.
Why are services outpacing hardware in growth?
Enterprises increasingly outsource GPU clusters, managed render farms and digital-twin rollouts, pushing services to an 8.8% CAGR.
Page last updated on:


