PC Market Size and Share
Market Overview
| Study Period | 2022 - 2031 |
|---|---|
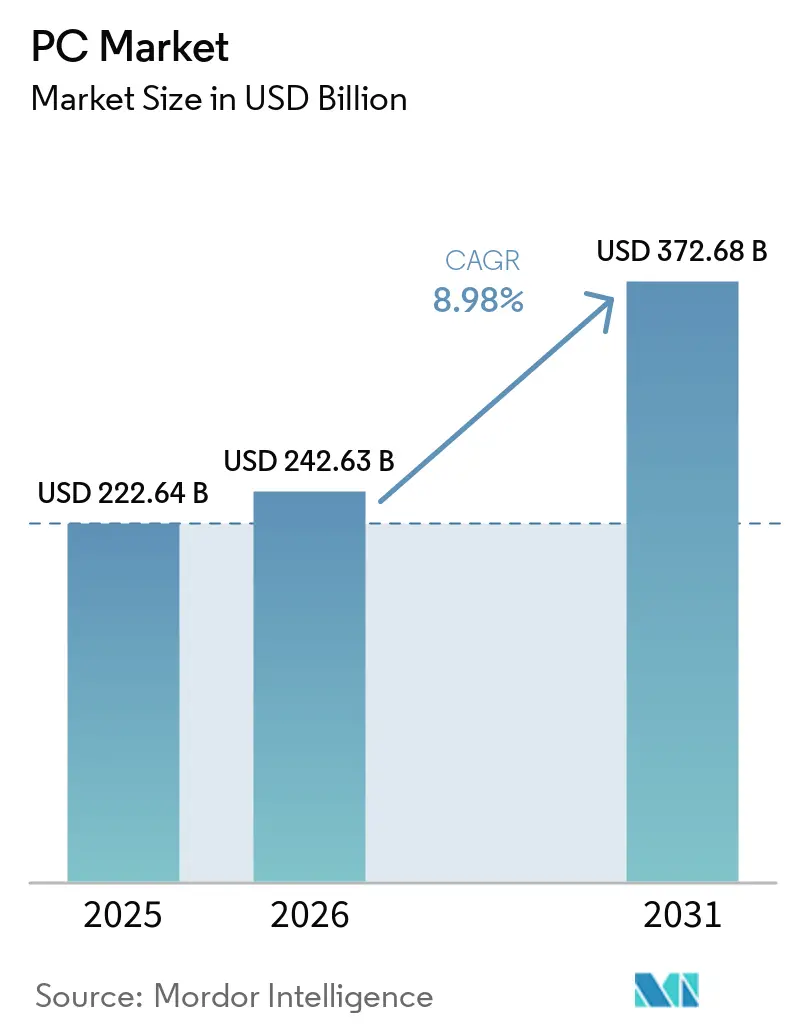
| Market Size (2026) | USD 242.63 Billion |
| Market Size (2031) | USD 372.68 Billion |
| Growth Rate (2026 - 2031) | 8.98% CAGR |
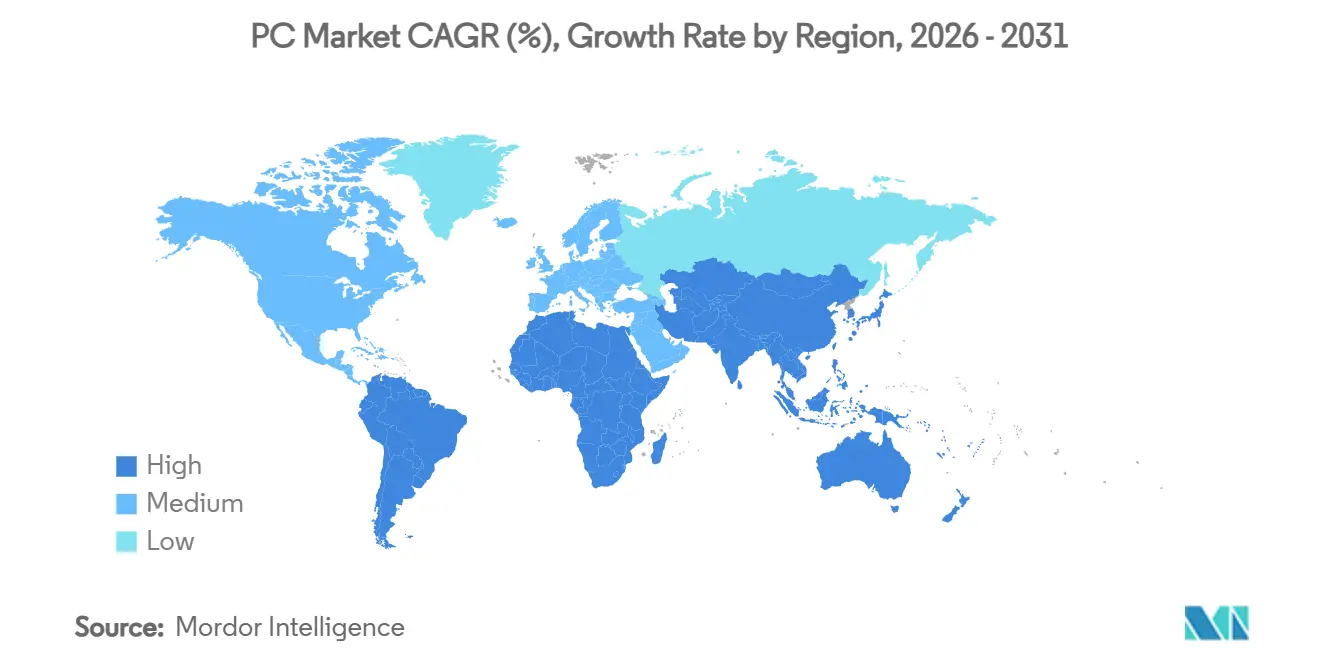
| Fastest Growing Market | South America |
| Largest Market | Asia Pacific |
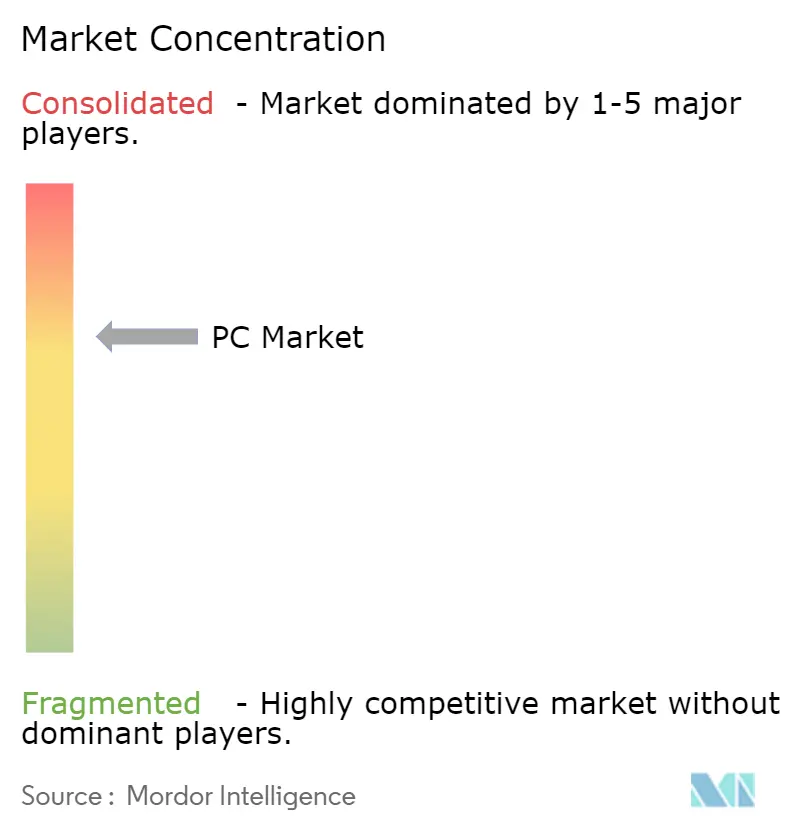
| Market Concentration | Medium |
Major Players
*Disclaimer: Major Players sorted in no particular order Image © Mordor Intelligence. Reuse requires attribution under CC BY 4.0. |
|
PC Market Analysis by Mordor Intelligence
The PC Market size was valued at USD 222.64 billion in 2025 and estimated to grow from USD 242.63 billion in 2026 to reach USD 372.68 billion by 2031, at a CAGR of 8.98% during the forecast period (2026-2031). This revival follows the post-pandemic slump and rests on three pillars: enterprise-grade AI integration, the Windows 10 end-of-life deadline that forces device modernization, and a lasting shift toward hybrid work. Replacement decisions now hinge on performance specifications such as local AI acceleration, battery life, and thermals rather than on baseline functionality. Vendors respond by refreshing their portfolios with neural processing unit (NPU)-equipped notebooks, slimmer thermal designs, and greener materials to meet regulatory requirements. Key growth signals are already evident in the global PC market. Asia-Pacific remains a significant region, driving both supply and demand, despite challenges such as chip shortages and geopolitical disruptions affecting logistics. Notebooks dominate shipments, but AI-optimized laptops are growing fastest. While commercial buyers account for the majority of demand, gaming and esports devices are growing faster as competitive play and streaming monetization increase.
Key Report Takeaways
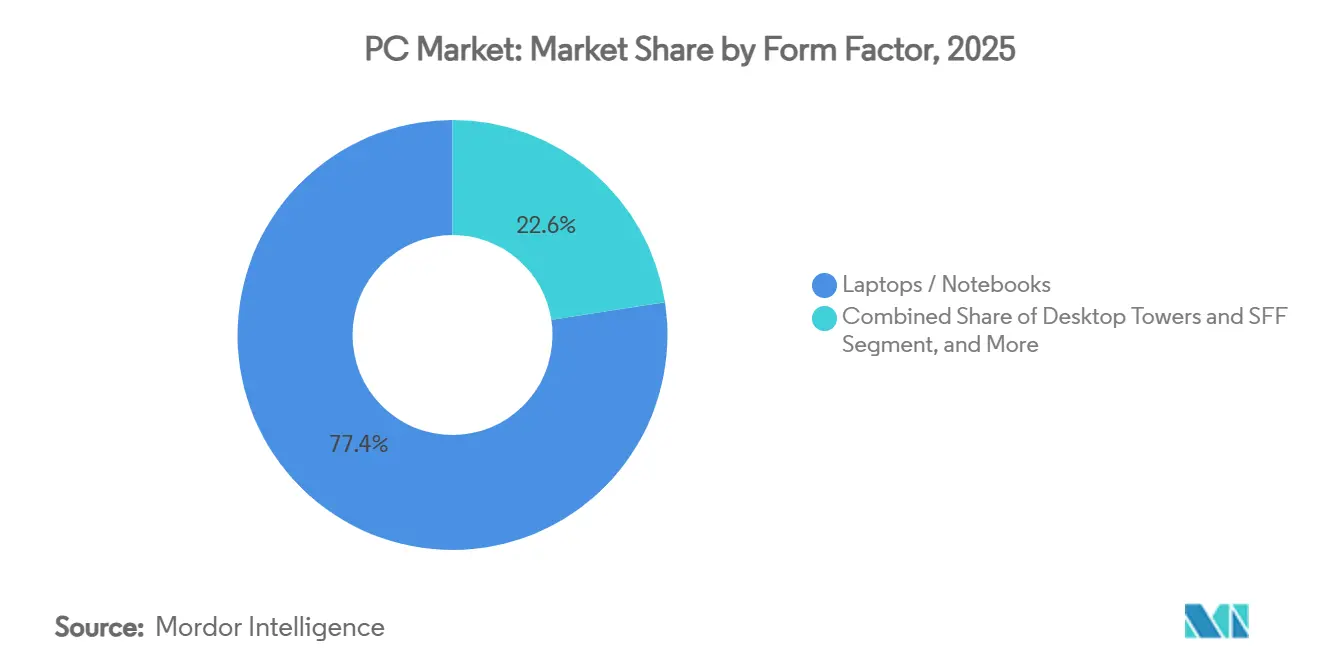
- By form factor, laptops/notebooks held 77.44% of PC market share in 2025; AI-optimized laptops are poised to expand at a 11.66% CAGR through 2031.
- By end user, the consumer segment accounted for 53.84% of the PC market in 2025, while gaming and esports devices grew at a 10.74% CAGR through 2031.
- By processor architecture, x86 systems led with 93.96% PC market share in 2025; ARM-based PCs are projected to climb at a 12.16% CAGR during 2026-2031.
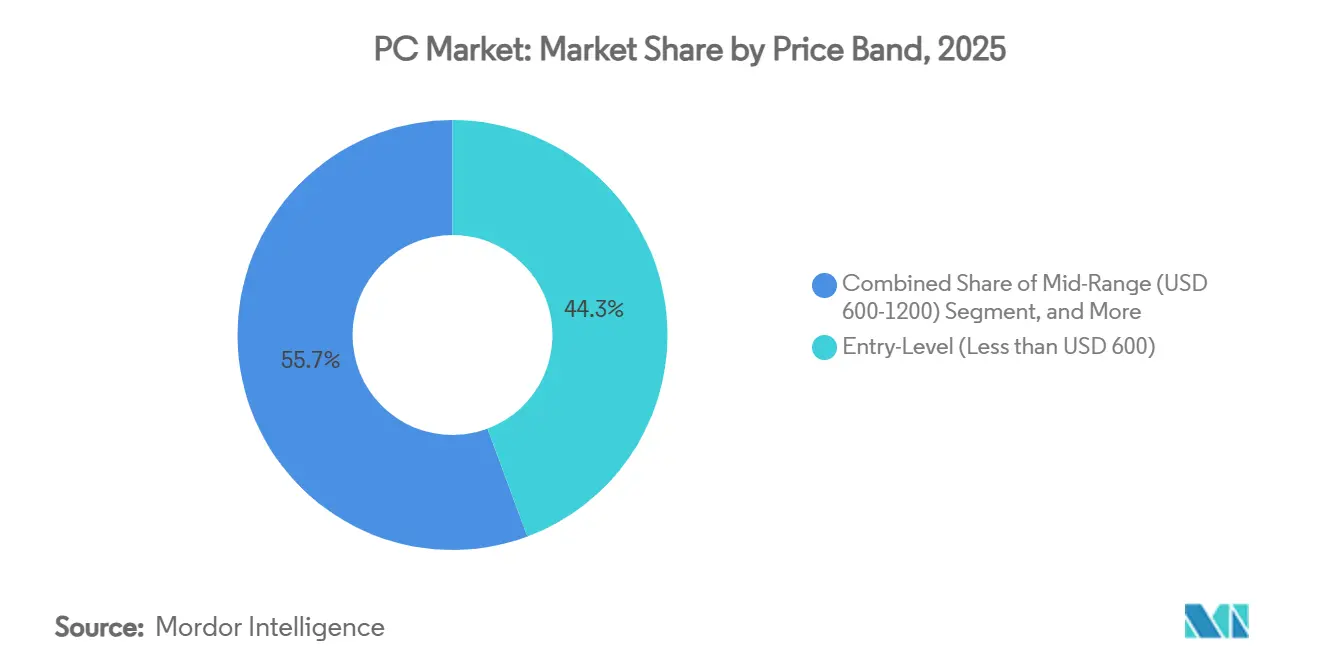
- By price band, mid-range models from USD 600 to USD 1,200 accounted for 44.32% of the PC market size in 2025, whereas premium and gaming rigs above USD 1,200 accelerated at a 13.19% CAGR.
- By geography, Asia-Pacific contributed 36.71% revenue in 2025; Africa exhibits the fastest 8.58% CAGR through 2031.
Note: Market size and forecast figures in this report are generated using Mordor Intelligence’s proprietary estimation framework, updated with the latest available data and insights as of 2026.
Global PC Market Trends and Insights
Drivers Impact Analysis*
| Driver | (~) % Impact on CAGR Forecast | Geographic Relevance | Impact Timeline |
|---|---|---|---|
| Hybrid-Work Notebook Refresh Demand | +2.1% | Global, with concentration in North America and Europe | Medium term (2-4 years) |
| Gaming and E-Sports Performance Race | +1.8% | Global, with APAC and North America leading | Long term (≥ 4 years) |
| Government Digital-Education Rollouts | +1.4% | North America, Europe, APAC emerging markets | Short term (≤ 2 years) |
| On-Device AI Acceleration Upgrade Wave | +2.3% | Global, enterprise-focused in developed markets | Medium term (2-4 years) |
| Windows 10 EOL 2025 Mandated Refresh | +1.9% | Global, concentrated in enterprise segments | Short term (≤ 2 years) |
| Enterprise Green-PC Procurement Incentives | +0.8% | Europe, North America, Australia | Long term (≥ 4 years) |
| Source: Mordor Intelligence | |||
Hybrid-Work Notebook Refresh Demand
Permanent hybrid work has shifted enterprise purchasing toward performance-optimized notebooks that sustain video-intensive meetings and cloud collaboration across variable networks. Microsoft reports that 30% of meetings already span multiple time zones, pushing firms to supply high-spec devices that enhance employee experience and retention. Battery endurance, integrated webcams, and thermal stability now influence refresh timing as much as warranty expiries. This driver favors premium notebooks where every watt-hour and cooling fin matter to remote productivity.[1]Karim R. Lakhani, “2025 Work Trend Index,” Microsoft, microsoft.com
Gaming and Esports Performance Race
Professional tournaments not only emphasize player skill but also place significant emphasis on the hardware used, highlighting evolving trends in the PC market. This has turned frame-rate leadership into a key marketing advantage for manufacturers. Standard professional setups typically include high-performance components such as Intel Core i7 or AMD Ryzen 7 CPUs paired with NVIDIA RTX 3070 GPUs. These configurations set benchmarks that often influence purchasing decisions among mainstream buyers. Additionally, streaming revenue is heavily dependent on visual fidelity, prompting content creators to invest in advanced GPUs that support real-time ray tracing and AI-assisted upscaling technologies. This ongoing competition among professionals and creators drives a high-margin upgrade cycle, compelling component manufacturers to accelerate their product launch timelines to meet the growing demand for cutting-edge technology.
Government Digital-Education Rollouts
Public-sector laptop programs are increasingly facing significant funding gaps as pandemic relief measures wind down. For instance, in North Carolina, 82 out of 115 school districts are unable to afford necessary replacements, resulting in an annual funding shortfall of approximately USD 160 million. However, federal blanket purchase agreements, such as the General Services Administration’s (GSA) Best-in-Class contract, play a crucial role in mitigating these challenges. These agreements enable bulk purchasing, which helps public-sector entities maintain up-to-date specifications for their laptop programs despite budgetary constraints. Minimum-performance baselines set for education later ripple into entry-level consumer models, standardizing camera quality, memory, and security chips.[2]General Services Administration, “Laptops and Desktops BPA,” gsa.gov
On-device AI Acceleration Upgrade Wave
Neural Processing Units (NPUs) integrated by AMD, Intel, and Qualcomm now deliver over 50 TOPS (Tera Operations Per Second) of local inference capabilities, significantly reducing cloud latency and minimizing data egress fees. These advancements are enabling more efficient on-device processing, particularly beneficial for applications that require real-time decision-making. AMD’s Copilot+-ready Ryzen AI Pro 300 series is a prime example of the industry’s push to embed AI capabilities directly at the edge, enhancing performance and reducing reliance on cloud-based solutions. According to Forrester, by 2028, approximately 93.9% of commercial PCs are expected to feature such AI engines, transforming artificial intelligence from a specialized feature into a standard offering. This shift is anticipated to drive a premium-priced replacement cycle as businesses upgrade their systems to leverage these advanced capabilities.
Restraints Impact Analysis*
| Restraint | (~) % Impact on CAGR Forecast | Geographic Relevance | Impact Timeline |
|---|---|---|---|
| Component Supply-Chain Volatility | -1.6% | Global, with manufacturing concentration in Asia-Pacific | Short term (≤ 2 years) |
| Smart-Phone Substitution for Casual Tasks | -1.2% | Global, stronger in emerging markets | Long term (≥ 4 years) |
| Cloud VDI Lengthening Refresh Cycles | -0.9% | North America, Europe enterprise segments | Medium term (2-4 years) |
| Circular-Economy Regulations and Refurbishment | -0.7% | Europe leading, North America, and Asia-Pacific | Long term (≥ 4 years) |
| Source: Mordor Intelligence | |||
Component Supply-Chain Volatility
Hurricane Helene’s disruption of Spruce Pine quartz mining highlighted a critical single point of failure in the production of semiconductor crucibles, which are essential for advanced chip manufacturing. While capacity is expected to normalize by early 2025, semiconductor fabrication plants (fabs) operating below the 11 nm process node continue to face challenges, including extended tool lead times and persistent labor shortages. To mitigate these risks, Original Equipment Manufacturers (OEMs) have adopted strategies such as pre-paying for inventories and implementing dual sourcing practices. However, maintaining elevated buffer stocks to ensure supply chain continuity has tied up significant working capital, limiting their ability to offer promotional flexibility and respond dynamically to market demands.
Smart-Phone Substitution for Casual Tasks
Mobile-first behaviors are increasingly meeting the needs for email, browsing, and social media, leading to a decline in demand for low-end notebooks, particularly in price-sensitive regions. This shift is driven by the growing preference for smartphones, which offer portability and convenience for basic tasks. Additionally, enterprises are opting to equip their field staff with rugged smartphones instead of traditional PCs, especially when job roles prioritize quick data entry over extensive content creation. While this cannibalization trend is primarily confined to entry-level notebook tiers, it has a noticeable impact on volume growth in segments priced below USD 600, creating challenges for manufacturers targeting these segments.
*Our forecasts treat driver/restraint impacts as directional, not additive. The impact forecasts reflect baseline growth, mix effects, and variable interactions.
Segment Analysis
By Form Factor: Notebooks Anchor AI Adoption
Laptops/Notebooks delivered 77.44% of 2025 shipments, anchoring the PC market. AI-optimized laptops alone are projected to grow at a 11.66% CAGR, enabling mobile knowledge workers to run inference offline without draining batteries. Desktops retain a role in engineering labs and esports arenas, where PCIe slots and superior thermals outweigh portability. All-in-one systems carve a niche in front-office and classroom settings, while tablets and detachable bridge mobile and desktop workflows for field inspectors and creative professionals. Intel’s recommended two- to four-year PC lifecycle illustrates how standardized fleets lower support burdens and warranty risk, further cementing notebooks as default corporate endpoints.
Second-order shifts are becoming increasingly evident as sustained AI workloads constrain thermal budgets. To address these challenges, manufacturers are adopting advanced cooling technologies, such as vapor-chamber cooling systems and stacked-graphite heat spreaders, to manage heat more effectively. Additionally, the integration of low-power LPDDR5X memory is becoming a standard feature to optimize energy efficiency and performance. In parallel, vendors are exploring innovative design solutions, such as replaceable keyboard decks, to simplify recycling processes and reduce electronic waste. These efforts align with global circular-economy mandates that emphasize sustainability and reduced environmental impact through improved product lifecycle management.


By End User: Commercial Dominance Accelerates
Commercial buyers accounted for 53.84% of projected demand in 2025, underscoring the PC market's heavy reliance on enterprise modernization efforts. The adoption of hybrid work policies and the increasing need for robust cybersecurity measures have driven organizations to allocate higher budgets for hardware. This shift has led to a preference for features such as BIOS-locked drives and built-in privacy shutters, which enhance security and privacy. Meanwhile, gaming and esports devices, though representing a smaller segment, are expected to grow at a CAGR of 10.74%. This growth is fueled by streamers and gamers who prioritize advanced features such as 240 Hz displays and AI-driven noise suppression, which directly enhance audience engagement and gaming experiences.
Government and education buyers are addressing funding challenges by using nationwide framework contracts to ensure cost-effective procurement. Small and medium-sized businesses (SMBs) are increasingly adopting enterprise-grade warranties to reduce downtime and maintain operational efficiency. On the consumer side, replacement cycles are becoming longer unless driven by specific needs, such as gaming or home-office performance upgrades. These trends reflect the evolving priorities across different buyer segments, with each group adapting to technological advancements and budgetary constraints in unique ways.
By Price Band: Premium Gaming Leads Growth
Entry-level PCs priced below USD 600 accounted for 44.32% of total volume in 2025, reflecting strong demand from cost-conscious consumers. These systems cater to basic computing needs, making them a popular choice for budget buyers. On the other hand, premium PCs priced above USD 1,200 are witnessing significant growth, with an annual growth rate of 13.19%. This growth is driven by competitive gamers, streamers, and data scientists who are increasingly investing in advanced features such as RTX 40-series GPUs, high-refresh OLED panels, and PCIe 5.0 SSDs to enhance performance and user experience.
Mid-range systems, priced between USD 600 and USD 1,200, have emerged as a competitive segment, with vendors vying for market share. To attract mainstream shoppers, manufacturers are bundling features like Wi-Fi 7 connectivity and 1080p webcams, which appeal to a broader audience. This market polarization, with consumers gravitating toward either budget-friendly options or high-end, differentiated products, is shaping OEMs' future positioning strategies across their product catalogs. The trend underscores the importance of balancing affordability with premium features to effectively meet diverse consumer demands.
By Processor Architecture: Heterogeneous Compute Shifts Beyond x86 Dominance
x86 systems accounted for 93.96% of PC market revenue in 2025, maintaining a commanding lead due to deep ecosystem compatibility, enterprise standardization, and decades of software optimization around platforms from Intel and AMD. Corporate IT environments, legacy applications, and performance-intensive workloads, such as engineering simulations and enterprise databases, continue to drive demand for x86 architectures. OEMs like Dell Technologies, HP Inc., and Lenovo still prioritize x86 portfolios for commercial deployments, where stability, backward compatibility, and IT manageability outweigh experimentation. Even as device innovation accelerates, x86 retains structural advantages in driver support, enterprise tooling, and high-performance computing use cases, ensuring its dominance persists through the forecast period despite gradual share erosion.
However, ARM-based systems are emerging as the fastest-growing segment (12.16% CAGR, 2026–2031), driven by power efficiency, integrated AI acceleration, and always-on connectivity. The success of Apple's custom silicon (M-series chips) and the growing momentum of Windows on ARM, supported by Qualcomm, are reshaping vendor strategies, particularly in premium ultraportables and AI PCs. ARM’s ability to deliver superior performance-per-watt is enabling thinner designs and longer battery life, appealing to hybrid workers and mobile professionals. Meanwhile, RISC-V and other emerging architectures remain nascent but strategically important, attracting investment for specialized and sovereign computing applications. Over time, the processor landscape is expected to become more heterogeneous, with ARM gaining share in consumer and mobile-first segments, while x86 continues to dominate enterprise-heavy and performance-critical environments.
Geography Analysis
The Asia-Pacific region accounted for 36.71% of the 2025 PC market revenue, driven by high-density manufacturing clusters, a growing middle class, and aggressive government digitization plans. China and India anchor demand; Indian AI-PC volumes are expected to grow eight- to ten-fold in 2025 as refresh cycles align with enterprise generative AI rollouts. Discounted electricity and local assembly incentives maintain the region’s cost advantage, although geopolitical tensions and currency fluctuations introduce volatility.
North America benefits from Windows 10 EOL upgrades and cybersecurity mandates, driving PC refresh demand. Enterprises deploy NPUs to reduce cloud fees and enhance data sovereignty, thereby increasing average selling prices. U.S. federal strategic sourcing sets common specs-TPM 2.0, Wi-Fi 6E-that ripple through private-sector bids.[3]General Services Administration, “Federal Strategic Sourcing Initiative,” gsa.gov Europe grapples with stringent circular-economy laws. Digital product passports, repair-score labeling, and a destruction ban on unsold stock raise design complexity yet unlock premiums for sustainable models. OEMs that certify carbon-neutral factories win public-sector tenders, underscoring how regulation shapes competitive outcomes.
Africa emerges as the fastest-growing region, with a 8.58% CAGR. Brazil draws OEM investments,t such as Asus’s local production of ExpertBook lines, blunting import tariffs and shortening delivery timelines. Gaming cafés and fintech startups fuel demand for performance notebooks. Currency volatility tempers consumer upgrades, but enterprise and government modernization pipelines stay resilient. The Middle East and Africa record steady enterprise rollouts asoil-economy diversification, and national Vision 2030 programs digitize public services. Education ministries bulk-purchase Chromebooks and Windows laptops to lift digital literacy. Infrastructure gaps persist, yet mobile broadband and solar-powered classrooms expand addressable markets.

Competitive Landscape
The PC market features moderate concentration: Lenovo leads with 24.5% share, HP follows at 19.9%, and Dell holds 14.4%, combining for 58.8%. Lenovo leverages a sprawling manufacturing footprint and AI-ready ThinkPad designs; HP differentiates through premium aesthetics and Device-as-a-Service bundles; Dell capitalizes on direct-sales logistics and configurable workstations. Apple secures niche momentum among creatives, while Acer and Asus pivot toward gaming and education verticals. Framework Computer, with its modular, repairable laptops, captures sustainability-minded tech enthusiasts, hinting at a potential upheaval should right-to-repair policy stiffen.
Strategic moves typify intensifying competition in the PC market. HP expanded its EliteBook and ProBook families with integrated NPUs for edge AI. Dell introduced the Pro Max Plus, featuring a discrete Qualcomm AI card for data scientists. AMD, courting enterprises, launched the Ryzen AI Pro 300 lineup, promising 93.9% AI-PC penetration by 2028. These actions signal an industry migrating from gigahertz battles to TOPS bragging rights, where software ecosystems and carbon reporting complement silicon prowess.[4]Dell Technologies, “Reimagining AI: Discrete NPU Power with Dell Pro Max,” dell.com
The evolving landscape of the PC market also reflects a broader focus on software ecosystems and sustainability. Companies are increasingly aligning their product offerings with emerging trends, such as carbon reporting and environmental accountability, to meet consumer and regulatory demands. This shift complements the advancements in hardware, as manufacturers aim to provide holistic solutions that address both performance and environmental concerns. As a result, the competitive dynamics within the market are expected to continue evolving, with innovation and sustainability playing pivotal roles in shaping future growth and market share distribution.
PC Industry Leaders
-
Lenovo Group Limited
-
HP Inc.
-
Dell Technologies Inc.
-
Apple Inc.
-
ASUSTeK Computer Inc.
- *Disclaimer: Major Players sorted in no particular order

Recent Industry Developments
- May 2025: Dell unveiled the Pro Max Plus laptop with Qualcomm AI 100 inference card and 64 GB NPU memory for enterprise AI workflows.
- April 2025: AMD rolled out its AI PC initiative anchored by Ryzen AI Pro 300 processors and Windows 11 Copilot+ certification.
- March 2025: HP launched ProBook 4, EliteBook 6, and EliteBook 8 series, each sporting NPUs and tool-less maintenance designs.
- January 2025: Lenovo posted record USD 18.79 billion Q3 2025 revenue, up 106% YoY, forecasting AI PCs to reach 80% market by 2027.


Global PC Market Report Scope
The PC market refers to the global industry encompassing the production, distribution, and sale of personal computers used for computing, productivity, communication, and entertainment. It includes a wide range of device types, such as laptops/notebooks and desktop systems (including tower and small-form-factor units), designed to meet varying user needs from portability to high-performance desktop computing.
The PC Market Report is Segmented by Form Factor (Laptops / Notebooks, and Desktop Towers and SFF), End-user Industry (Consumers, Small and Medium Enterprise, Large Enterprise, and Government and Education), Process Architecture (x86 (Intel-AMD), ARM-based, and RISC-V and Other Processor Architectures), Price Band (Entry-Level (< USD 600), Mid-Range (USD 600-1200), Premium / Gaming (> USD 1200)), and Geography (North America, South America, Europe, Asia-Pacific, and Middle East and Africa). The Market Forecasts are Provided in Terms of Value (USD).
| Laptops / Notebooks |
| Desktop Towers and SFF |
| All-in-One PCs |
| Tablets / Detachables |
| Consumer |
| Small and Medium Business |
| Large Enterprise |
| Government and Education |
| x86 (Intel-AMD) |
| ARM-based |
| RISC-V and Other Processor Architectures |
| Entry-Level (< USD 600) |
| Mid-Range (USD 600-1200) |
| Premium / Gaming (> USD 1200) |
| North America | United States |
| Canada | |
| Mexico | |
| South America | Brazil |
| Argentina | |
| Rest of South America | |
| Europe | Italy |
| France | |
| Germany | |
| United Kingdom | |
| Rest of Europe | |
| Asia-Pacific | India |
| China | |
| Japan | |
| Rest of Asia-Pacifc | |
| Middle East and Africa | Saudi Arabia |
| South Africa | |
| United Arab Emirates | |
| Rest of Middle East and Africa |
| By Form Factor | Laptops / Notebooks | |
| Desktop Towers and SFF | ||
| All-in-One PCs | ||
| Tablets / Detachables | ||
| By End-User Industry | Consumer | |
| Small and Medium Business | ||
| Large Enterprise | ||
| Government and Education | ||
| By Processor Architecture | x86 (Intel-AMD) | |
| ARM-based | ||
| RISC-V and Other Processor Architectures | ||
| By Price Band | Entry-Level (< USD 600) | |
| Mid-Range (USD 600-1200) | ||
| Premium / Gaming (> USD 1200) | ||
| By Geography | North America | United States |
| Canada | ||
| Mexico | ||
| South America | Brazil | |
| Argentina | ||
| Rest of South America | ||
| Europe | Italy | |
| France | ||
| Germany | ||
| United Kingdom | ||
| Rest of Europe | ||
| Asia-Pacific | India | |
| China | ||
| Japan | ||
| Rest of Asia-Pacifc | ||
| Middle East and Africa | Saudi Arabia | |
| South Africa | ||
| United Arab Emirates | ||
| Rest of Middle East and Africa | ||


Key Questions Answered in the Report
What is the current value of the global PC market in 2026?
The PC market stands at USD 242.63 billion in 2026
How fast will the PC market grow toward 2031?
It is forecast to reach USD 372.68 billion by 2031, posting a 8.98% CAGR.
Which region generates the largest PC revenue today?
Asia-Pacific leads with 36.71% 2025 revenue, driven by both production scale and domestic demand.
Why are AI-optimized laptops gaining traction?
Built-in NPUs support local inferencing, improving privacy and latency while meeting hybrid-work and enterprise productivity needs.
How will Windows 10 end-of-support affect PC replacements?
With support ending in October 2025, about 63% of installed devices must migrate, triggering a concentrated refresh wave.
Who are the biggest PC vendors today?
Lenovo, HP, and Dell together hold 58.8% shipment share, with Lenovo alone at 24.5%
Page last updated on:


