
Commercial Desktop PC Market Size and Share
Market Overview
| Study Period | 2020 - 2031 |
|---|---|
| Market Size (2026) | USD 31.83 Billion |
| Market Size (2031) | USD 49.38 Billion |
| Growth Rate (2026 - 2031) | 9.18 % |
| Fastest Growing Market | Asia Pacific |
| Largest Market | Africa |
| Market Concentration | Medium |
Major Players *Disclaimer: Major Players sorted in no particular order Image © Mordor Intelligence. Reuse requires attribution under CC BY 4.0. | |
Commercial Desktop PC Market Analysis by Mordor Intelligence
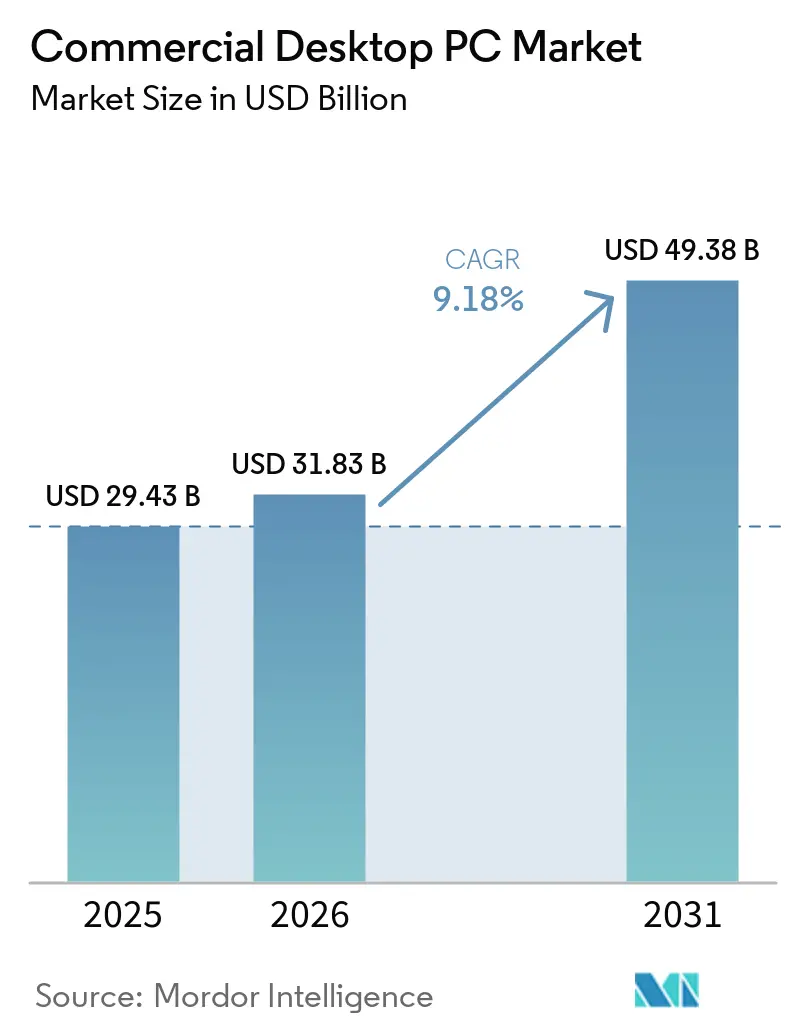
The commercial desktop PC market size is projected to be USD 29.43 billion in 2025, USD 31.83 billion in 2026, and reach USD 49.38 billion by 2031, growing at a CAGR of 9.18% from 2026 to 2031. Demand is accelerating as enterprises replace aging fleets ahead of the Windows 10 end-of-support deadline, a milestone that sparked a synchronized refresh cycle across North America, Europe, and Asia-Pacific. Corporate IT departments continue to value fixed workstations for data-sensitive roles, while esports facilities and AAA game studios are driving an incremental wave of high-spec desktop purchases. Supply-chain volatility in memory and storage components has lifted average selling prices and nudged some organizations toward longer refresh intervals, yet the need for on-premise processing, trusted platform modules, and AI-ready accelerators keeps the commercial desktop PC market firmly on an expansion track. New regulatory incentives for circular-economy designs and regional manufacturing programs are creating fresh opportunities for both global OEMs and locally anchored system builders.
Key Report Takeaways
- By form factor, towers held 56.31% of the commercial desktop PC market share in 2025, while mini PCs are forecast to advance at a 9.98% CAGR through 2031.
- By end-user industry, corporate buyers accounted for 41.89% of 2025 revenue, whereas gaming and entertainment is projected to expand at a 10.18% CAGR over the forecast window.
- By distribution channel, indirect and OEM routes accounted for 57.73% of 2025 revenue, and e-commerce is expected to post a 9.78% CAGR through 2031.
- By processor architecture, x86 platforms accounted for 88.98% of 2025 sales, and ARM-based systems are growing at a 9.18% CAGR overall.
- By geography, Asia-Pacific generated 29.32% of global revenue in 2025, while Africa is set to record a 10.13% CAGR between 2026 and 2031.
Note: Market size and forecast figures in this report are generated using Mordor Intelligence’s proprietary estimation framework, updated with the latest available data and insights as of January 2026.
Market Trends and Insights
Drivers Impact Analysis of Commercial Desktop PC Market*
| Driver | (~) % Impact on CAGR Forecast | Geographic Relevance | Impact Timeline |
|---|---|---|---|
| Corporate Fleet Refresh Cycles Post-Pandemic | +2.1% | Global hubs in North America, Europe, Asia-Pacific | Short term (≤ 2 years) |
| Expanding Esports and AAA Gaming Demand | +1.8% | North America, Europe, China, South Korea | Medium term (2-4 years) |
| Hybrid Work Models Requiring High-Performance Workstations | +1.5% | North America, Europe, urban Asia-Pacific centers | Medium term (2-4 years) |
| Government Digitalization Initiatives in Emerging Markets | +1.3% | South America, India, Indonesia, South Africa, Egypt | Long term (≥ 4 years) |
| Rise of Edge Computing Requiring On-Premise Processing | +0.9% | Manufacturing regions in Germany, Japan, China | Long term (≥ 4 years) |
| Growing Demand for Privacy-Controlled Local Data Storage | +0.7% | Europe, North America, regulated sectors worldwide | Medium term (2-4 years) |
| Source: Mordor Intelligence | |||
Corporate Fleet Refresh Cycles Post-Pandemic
Microsoft’s October 2025 retirement of Windows 10 compelled organizations to migrate hundreds of millions of machines to Windows 11-capable hardware. Many enterprises had already deferred desktop spending during 2020-2022, leaving fleets well beyond their five-year service life and exposed to security gaps. OEMs responded with tightly integrated AI-ready desktops that meet Windows 11 hardware baselines and remote management mandates. Dell Technologies launched its Pro 5 Micro desktop in March 2026, featuring integrated AI-inference accelerators and a Trusted Platform Module 2.0 to meet Windows 11's stringent hardware requirements.[1] Procurement peaked in late 2025, and a second wave is unfolding in 2026 as late adopters finalize budget approvals. Although memory inflation has stretched refresh intervals for a minority of buyers, the compliance deadline has largely locked in near-term demand.
Expanding Esports and AAA Gaming Demand
Permanent esports arenas, collegiate programs, and broadcast studios are moving away from improvised rigs toward purpose-built towers equipped with discrete GPUs and high-frequency CPUs. Hardware configured for 4K, 240 Hz gameplay also doubles as a production workstation for live-stream overlays and content editing, making commercial desktops indispensable for venue operators. OEMs now offer factory-overclocked systems with liquid cooling and hot-swap storage to meet demanding workload profiles. Growth remains fastest in China, the United States, and South Korea, but public gaming centers funded by European municipalities are adding incremental volume.
Hybrid Work Models Requiring High-Performance Workstations
Engineering firms, media agencies, and quantitative trading desks increasingly split staff between office and remote sites, yet latency-sensitive tasks still demand local compute. Enterprises are adopting a two-tier hardware strategy: thin clients for routine knowledge workers and desktop workstations with 8-core or higher CPUs, ample VRAM, and on-device neural engines for power users. Small-form-factor and mini-tower designs that fit hot-desking layouts are favored because they lower power draw without compromising thermal headroom. This shift supports above-average unit spending and sustains the premium end of the commercial desktop PC market.
Government Digitalization Initiatives in Emerging Markets
Brazil, India, and Indonesia are issuing multi-year tenders for desktops that power e-governance portals, school labs, and health-care kiosks. Contracting agencies typically require locally assembled or regionally sourced hardware, giving domestic system integrators and tier-two OEMs an advantage. Financing models such as PC-as-a-Service spread costs over operating budgets, ensuring order stability even during economic swings. These programs underpin long-tail growth in regions where private-sector refresh cycles are more volatile.
Restraints Impact Analysis of Commercial Desktop PC Market*
| Restraint | (~) % Impact on CAGR Forecast | Geographic Relevance | Impact Timeline |
|---|---|---|---|
| Prolonged Component Supply Chain Volatility | -1.2% | Global dependence on Taiwan and South Korea semiconductor fabs | Short term (≤ 2 years) |
| Increasing Adoption of High-End Laptops as Desktop Replacements | -0.9% | North America, Europe, urban Asia-Pacific | Medium term (2-4 years) |
| Macroeconomic Uncertainty Dampening CapEx Budgets | -0.6% | Emerging markets with currency or debt stress | Short term (≤ 2 years) |
| Environmental Regulations Driving Refurbishment over New Purchases | -0.4% | Europe and selected North American jurisdictions | Long term (≥ 4 years) |
| Source: Mordor Intelligence | |||
Prolonged Component Supply Chain Volatility
Foundries have diverted DRAM and NAND capacity to AI accelerators, triggering price spikes of up to 100% and spot shortages for PC-grade memory. OEM gross margins have contracted, and many buyers are pushing refresh cycles out from 4 to 5 years. Micron Technology's USD 1.8 billion acquisition of Powerchip Semiconductor Manufacturing Corporation's P5 fabrication site in Tongluo, Taiwan, was announced in January 2026 and closed in March 2026.[2] Strategic responses include life-cycle extension programs, preferred-supplier agreements, and exploratory trials of desktop-as-a-service contracts that shift inventory risk to managed-service providers. Relief is unlikely before additional wafer capacity comes online in late 2027, leaving the commercial desktop PC market exposed to cost-driven procurement pauses.
Increasing Adoption of High-End Laptops as Desktop Replacements
Mobile processors now pair high-performance cores with power-efficient clusters and integrated graphics robust enough for most office workloads. Combined with docking stations and multi-monitor hubs, premium notebooks satisfy the portability requirements of hybrid staff and negate the need for separate desktop installations for many roles. Education and government buyers that once deployed rows of desktops are reallocating budgets toward versatile laptops, eroding potential desktop volumes in price-sensitive segments. The trend is most pronounced in developed economies where mobile workstyles and device-as-a-service agreements are already entrenched.
*Our forecasts treat driver/restraint impacts as directional, not additive. The impact forecasts reflect baseline growth, mix effects, and variable interactions.
Commercial Desktop PC Market Segment Analysis
By Form Factor:
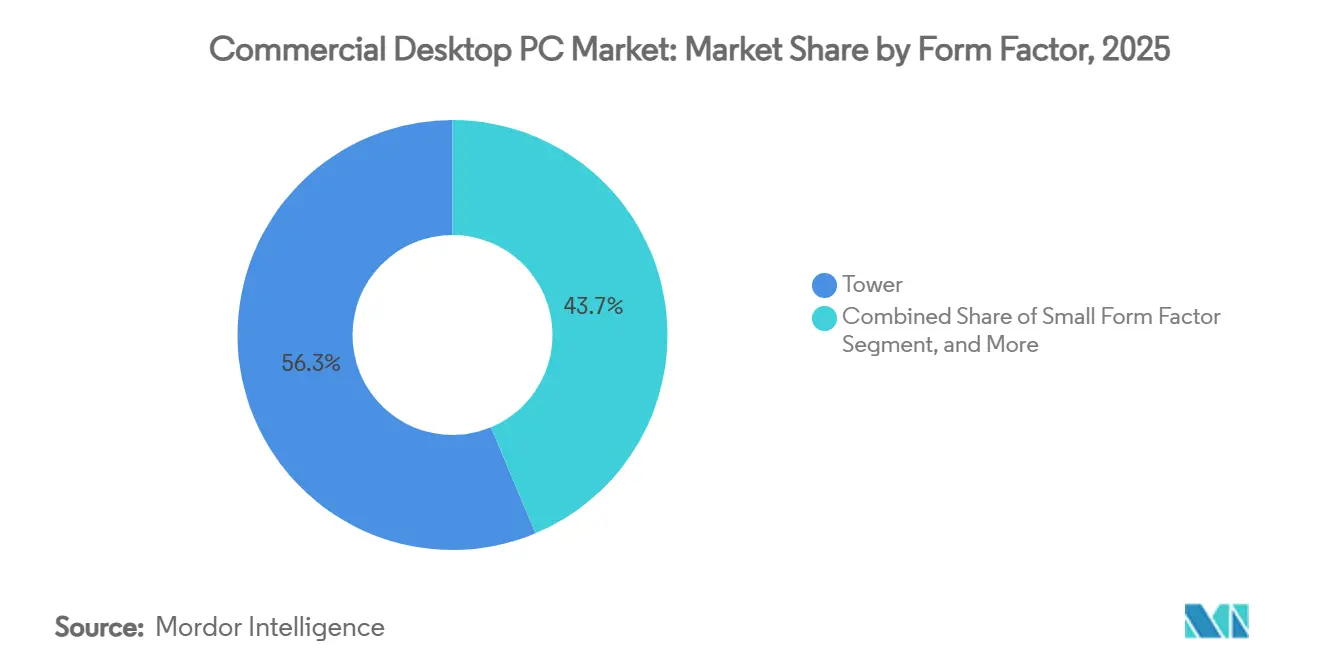
Towers Remain Core While Mini PCs Surge in Edge DeploymentsTower systems accounted for 56.31% of 2025 revenue, illustrating their pivotal role in enterprise IT closets and engineering labs where serviceability and PCIe expansion are essential. The commercial desktop PC market size for tower configurations is poised to climb steadily as organizations integrate AI accelerator cards and high-capacity storage into legacy racks. Mini PCs, on the other hand, are projected to log a 9.98% CAGR, fueled by smart-factory controllers and digital-signage endpoints that demand fanless, palm-sized designs. Although all-in-ones simplify cabling for reception desks and small offices, their non-upgradable nature makes them less attractive in cost-sensitive deployments. Over the forecast window, towers will retain the lead but cede incremental share to mini PCs in edge and hot-desking scenarios.
Across product roadmaps, vendors are compressing workstation-grade performance into ever-smaller footprints. Mini models that once ran low-watt CPUs now ship with 45 W silicon, dual-NVMe slots, and integrated neural processing units. Lenovo's Yoga Mini i, launched in June 2026 at USD 699.99, exemplifies this trend with a palm-sized enclosure housing Intel Core Ultra processors and dual HDMI outputs for digital signage and kiosk applications.[3] Conversely, next-generation towers emphasize modularity, allowing power supplies, storage sleds, and side panels to be swapped for refurbishment under European circular-economy rules. These complementary innovations ensure that every workspace, from the trading floor to the smart-factory cell, can find the right-sized platform within the commercial desktop PC market.

By End-User Industry:
Corporate Still Leads as Gaming AcceleratesCorporate buyers accounted for 41.89% of 2025 revenue, underscoring their reliance on standardized images, Active Directory integration, and long-term support contracts. Their steady refresh cadence underpins a large share of the commercial desktop PC market, even as some roles migrate to laptops or thin clients. Gaming and entertainment buyers, however, are set to expand spending at a 10.18% CAGR, transforming specialist rigs into broadcast-quality workhorses for esports and content creation. Government and education remain volume purchasers, but budget cycles and bidding rules moderate their growth trajectory.
Within corporations, a dual-approach deployment strategy is becoming increasingly common. Organizations are opting for cost-optimized small-form-factor units to handle administrative and routine tasks efficiently, while GPU-rich towers are being deployed for resource-intensive operations such as data analysis, 3D modeling, and other high-performance computing needs. Meanwhile, esports organizers and AAA game developers are gravitating toward high-end configurations, including top-tier CPUs, discrete graphics cards, and high-refresh-rate displays. This preference for premium specifications is significantly driving up average selling prices, which remain well above the typical enterprise standards. This polarization in demand ensures that profit margins remain attractive, even as shipment growth slows in other segments of the commercial desktop PC industry.
By Distribution Channel:
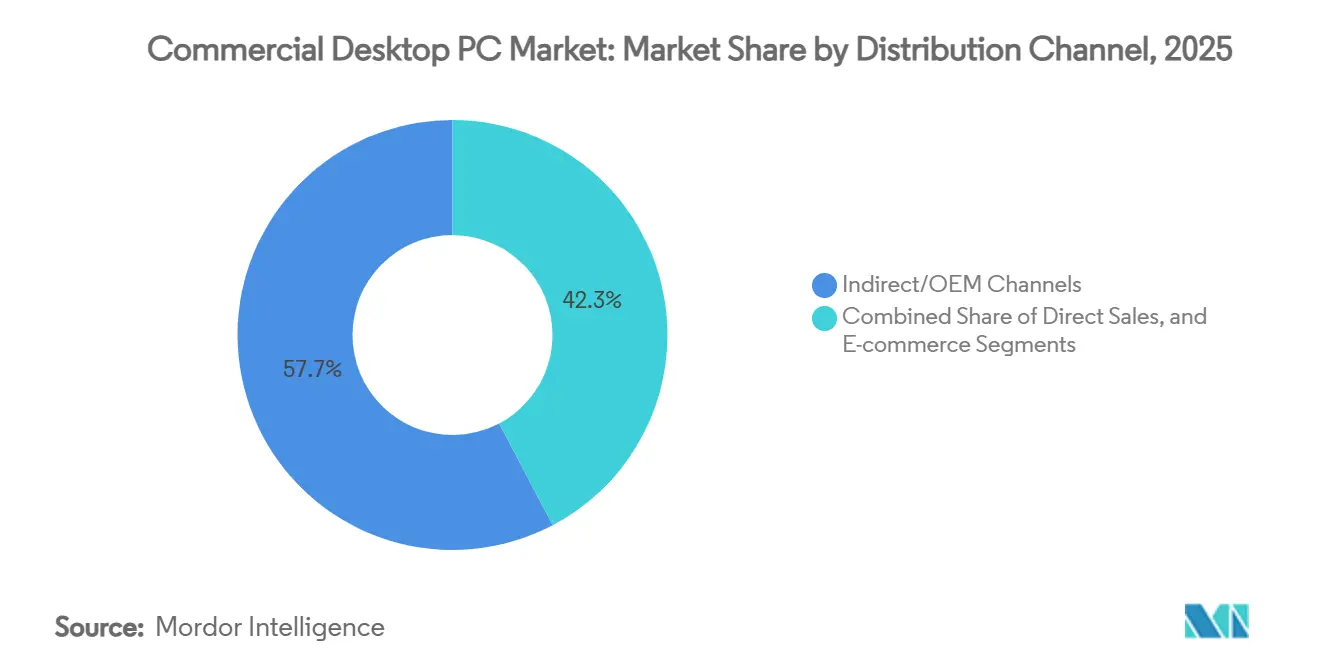
Indirect Dominates, E-Commerce Gains MomentumIndirect and OEM routes represented 57.73% of 2025 revenue, a testament to enterprise appetite for turnkey imaging, on-site rollout, and consolidated invoicing. The commercial desktop PC market size transacted through indirect partners will stay sizeable as contracts bundle hardware, software, and services. Nevertheless, e-commerce is slated to grow at a 9.78% CAGR because small and medium enterprises value transparent pricing and quick-ship customization. Direct sales to Fortune 500 accounts continue, yet many large buyers still route orders through preferred resellers to capture volume rebates and logistics support.
Vendors are increasingly investing in localized web stores, next-day fulfillment services, and online configuration tools, which are effectively reducing the usability gap between e-tail platforms and traditional procurement portals. These advancements are making online purchasing more accessible and efficient for businesses. Additionally, as payment gateway technologies continue to mature in emerging markets, a growing number of first-time business buyers are expected to transition to online platforms. This gradual shift is expected to erode the dominance of indirect channels in the commercial desktop PC market, as businesses increasingly favor the convenience and flexibility of e-commerce solutions.
By Processor Architecture:
x86 Retains Primacy, ARM Broadens Footholdx86 platforms held 88.98% of 2025 shipments, underscoring decades of software compatibility and IT skill-set inertia. ARM-based desktops are expanding at a 9.18% CAGR overall as Snapdragon-powered systems gain traction in power-constrained edge nodes and privacy-first offices. The commercial desktop PC market share for ARM remains modest, yet efficiency gains and integrated AI accelerators make it an attractive alternative for thin-client replacements and fanless deployments. RISC-V and other emergent architectures linger in niche industrial domains, unlikely to breach mass-market adoption this decade.
Intel and AMD are addressing ARM's efficiency claims by incorporating neural engines and advanced power-management features into their latest x86 processor families. These enhancements aim to bridge the performance-per-watt gap, ensuring that x86 processors remain competitive in terms of energy efficiency and computational power. This ongoing process of iterative advancements and technological leapfrogging indicates that architectural diversity within the commercial desktop PC market will continue to expand gradually. While x86 architecture is expected to maintain its dominance, it is becoming increasingly evident that it will no longer hold a monolithic position, as alternative architectures gain traction in specific use cases.
Geography Analysis
APAC Commercial Desktop PC Market
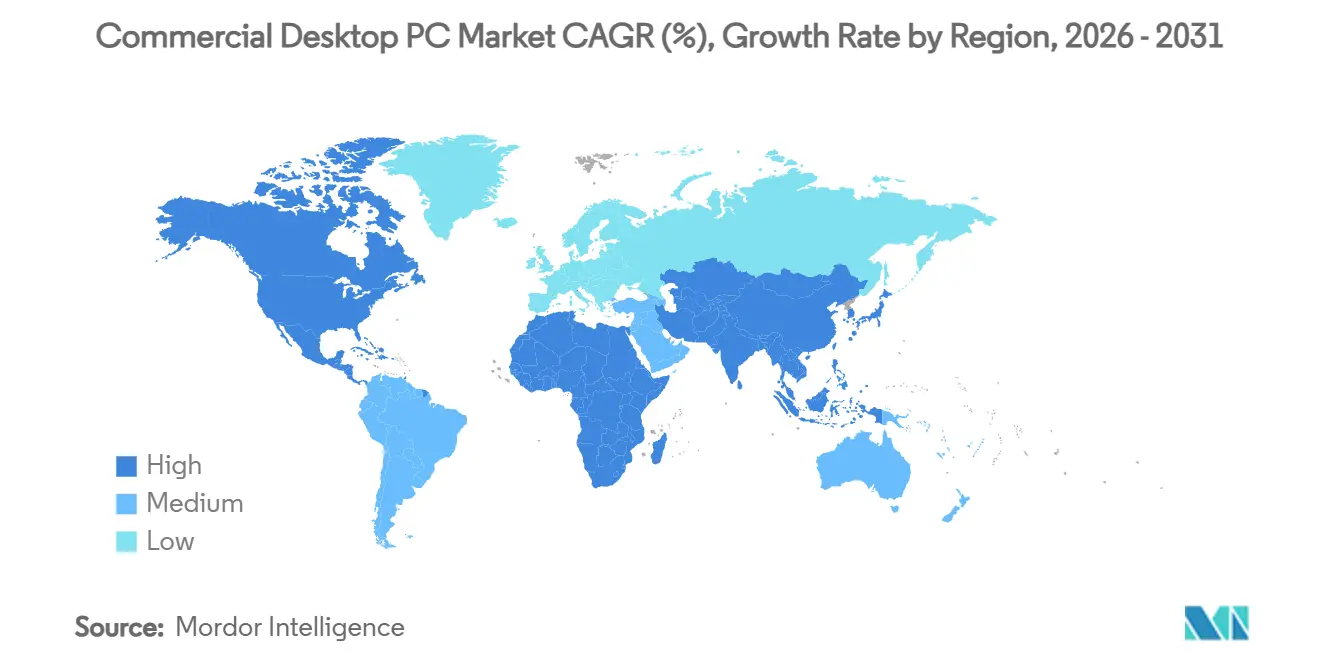
Asia-Pacific generated 29.32% of global revenue in 2025, buoyed by government digital tenders, robust manufacturing ecosystems, and synchronized Windows 11 migrations. Although shipments are expected to dip in 2026 due to cost headwinds, long-run prospects remain strong as India’s Make in India policy and Indonesia’s vocational center rollouts mature. China’s role as an assembly hub ensures supply continuity, while Japan and South Korea demand premium desktops certified for low-failure rates and extended warranties.
Europe and North America Commercial Desktop PC Market
Europe experienced a 48% year-on-year revenue spike in the fourth quarter of 2025 as enterprises raced to comply with cybersecurity mandates before component inflation set in. The revised WEEE Directive, effective in 2026, is already steering purchasing toward modular designs and OEM-led refurbishment programs.[4] North America posted single-digit growth, with purchases tilting toward AI-enabled workstations for engineering and finance, even as task-worker roles gravitate to virtual desktops.
MEA and South America Commercial Desktop PC Market
South America and Africa represent the fastest-growing territories. Africa is forecast to record a 10.13% CAGR through 2031, driven by smart-city and e-learning initiatives in South Africa, Egypt, and Nigeria. Brazil’s USD 130 million federal desktop tender and broader PC-as-a-Service uptake exemplify how budget-constrained governments can still catalyze significant volumes. The Middle East, particularly Saudi Arabia and the United Arab Emirates, is scaling Arabic-language desktops for public administrations, expanding the global footprint of the commercial desktop PC market.
Competitive Landscape
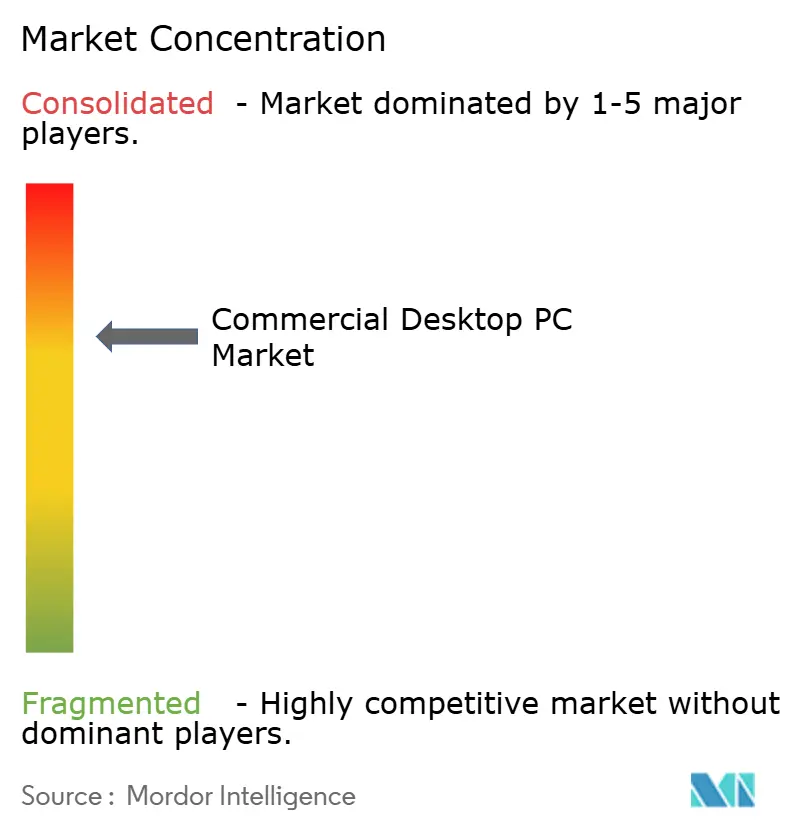
The market is moderately concentrated, with a few key players dominating a significant share of global enterprise contracts. Dell Technologies, Lenovo Group, and HP Inc. collectively hold well over half of these contracts, leveraging their extensive global service footprints, direct account control, and multiyear framework agreements. These companies have established themselves as leaders in the market by offering comprehensive solutions tailored to enterprise needs. Meanwhile, ASUS, Acer, and MSI are focusing on carving out profitable niches by developing AI-optimized desktops, mini PCs, and esports-focused rigs. Apple, on the other hand, maintains a strong presence in creative verticals, catering to professionals with its premium Mac-based workstations. Additionally, region-specific players like Positivo Tecnologia in Brazil and Hasee Computer in China are capitalizing on local-content regulations and their proximity to supply chains to strengthen their positions in their respective markets.
In recent years, strategic differentiation in the market has increasingly revolved around the integration of embedded AI engines, energy efficiency, and enhanced serviceability to align with circular-economy compliance. Dell Technologies, for instance, has announced its 2026 portfolio, which will feature vPro-grade management capabilities and on-device neural acceleration within compact chassis designs under one liter. Lenovo has introduced its Yoga Mini i, which delivers signage-ready performance at competitive price points below USD 700, targeting cost-conscious businesses. Similarly, ASUS has positioned its ExpertCenter Pro ET900N G3 as a desk-side AI supercomputer for enterprises seeking high-performance computing solutions. These advancements highlight the growing emphasis on innovation and sustainability within the market.
Looking ahead, the market is poised for further evolution driven by technological advancements and changing business models. Qualcomm’s ARM-based reference designs suggest potential long-term architectural disruptions, which could reshape the competitive landscape. Additionally, the emergence of desktop-as-a-service (DaaS) models offered by managed service providers has the potential to transform the economics of hardware ownership in the commercial desktop PC industry. By shifting from traditional ownership to subscription-based models, businesses may gain greater flexibility and cost efficiency. These developments indicate that the market will continue to adapt to emerging trends and customer demands, ensuring sustained growth and innovation in the forecast period.
Commercial Desktop PC Industry Leaders
-
Lenovo Group Limited
-
Dell Technologies Inc.
-
HP Inc.
-
Apple Inc.
-
Acer Inc.
- *Disclaimer: Major Players sorted in no particular order
Commercial Desktop PC Market Companies Covered in this Report
- Dell Technologies Inc.
- Lenovo Group Limited
- HP Inc.
- Acer Inc.
- ASUSTeK Computer Inc.
- Apple Inc.
- Micro-Star International Co., Ltd.
- Samsung Electronics Co., Ltd.
- Fujitsu Limited
- Dynabook Inc.
- Gigabyte Technology Co., Ltd.
- NEC Corporation
- Huawei Technologies Co., Ltd.
- Positivo Tecnologia S.A.
- Elitegroup Computer Systems Co., Ltd.
- Chuwi Innovation Limited
- Hasee Computer Co., Ltd.
- Tongfang Co., Ltd.
- Velocity Micro, Inc.
- Clevo Co.
Global Commercial Desktop PC Market Report Scope
The Commercial Desktop PC Market refers to the global industry encompassing the development, production, distribution, and deployment of desktop computing systems designed primarily for enterprise, institutional, government, and professional use cases. These systems are optimized for productivity, manageability, security, and performance in business environments and include a range of form factors, including tower desktops, small-form-factor PCs, all-in-one systems, and mini PCs.
The Commercial Desktop PC Market Report is Segmented by Form Factor (Tower, Small Form Factor, All-in-One, and Mini PC), End-user Industry (Corporate, Government, Educational Institutions, Gaming and Entertainment, and Other End Users), Distribution Channel (Direct Sales, Indirect/OEM Channels, and E-commerce), Processor Architecture (x86-based, ARM-based, and Other Architectures), and Geography (North America, South America, Europe, Asia-Pacific, and Middle East and Africa). The Market Forecasts are Provided in Terms of Value (USD).
Segmentation Overview
| Tower |
| Small Form Factor |
| All-in-One |
| Mini PC |
| Corporate |
| Government |
| Educational Institutions |
| Gaming and Entertainment |
| Other End Users |
| Direct Sales |
| Indirect/OEM Channels |
| E-commerce |
| x86-based |
| ARM-based |
| Other Architectures |
| North America | United States | |
| Canada | ||
| Mexico | ||
| South America | Brazil | |
| Argentina | ||
| Rest of South America | ||
| Europe | United Kingdom | |
| Germany | ||
| France | ||
| Italy | ||
| Spain | ||
| Rest of Europe | ||
| Asia-Pacific | China | |
| Japan | ||
| India | ||
| South Korea | ||
| Rest of Asia-Pacific | ||
| Middle East and Africa | Middle East | United Arab Emirates |
| Saudi Arabia | ||
| Rest of Middle East | ||
| Africa | South Africa | |
| Egypt | ||
| Rest of Africa | ||
| By Form Factor | Tower | ||
| Small Form Factor | |||
| All-in-One | |||
| Mini PC | |||
| By End-user Industry | Corporate | ||
| Government | |||
| Educational Institutions | |||
| Gaming and Entertainment | |||
| Other End Users | |||
| By Distribution Channel | Direct Sales | ||
| Indirect/OEM Channels | |||
| E-commerce | |||
| By Processor Architecture | x86-based | ||
| ARM-based | |||
| Other Architectures | |||
| By Geography | North America | United States | |
| Canada | |||
| Mexico | |||
| South America | Brazil | ||
| Argentina | |||
| Rest of South America | |||
| Europe | United Kingdom | ||
| Germany | |||
| France | |||
| Italy | |||
| Spain | |||
| Rest of Europe | |||
| Asia-Pacific | China | ||
| Japan | |||
| India | |||
| South Korea | |||
| Rest of Asia-Pacific | |||
| Middle East and Africa | Middle East | United Arab Emirates | |
| Saudi Arabia | |||
| Rest of Middle East | |||
| Africa | South Africa | ||
| Egypt | |||
| Rest of Africa | |||
Key Questions Answered in the Report
How large will the global commercial desktop PC market be by 2031?
It is projected to reach USD 49.38 billion by 2031, growing at a 9.18% CAGR from 2026.
Which form factor is expanding fastest in commercial desktop deployments?
Mini PCs are expected to post a 9.98% CAGR through 2031 thanks to edge-computing and hot-desking use cases.
Why do enterprises still choose desktops over laptops for certain roles?
Desktops offer superior thermal headroom, PCIe expansion, and physical-security options that remain essential for engineering, contact-center, and data-sensitive environments.
What impact will component price volatility have on desktop refresh cycles?
Memory and storage inflation is lengthening refresh intervals from four to five years for some buyers, though compliance and performance needs still anchor demand.
Which region is forecast to grow quickest after 2026?
Africa leads with a projected 10.13% CAGR as government infrastructure and educational deployments accelerate.
How are environmental regulations influencing desktop design?
The 2026 EU WEEE revision is pushing OEMs toward modular towers and certified refurbishment programs to improve material recovery and extend product life.