
Data Governance Market Size and Share
Market Overview
| Study Period | 2020 - 2031 |
|---|---|
| Market Size (2026) | USD 4.60 Billion |
| Market Size (2031) | USD 9.68 Billion |
| Growth Rate (2026 - 2031) | 16.05% CAGR |
| Fastest Growing Market | Asia Pacific |
| Largest Market | North America |
| Market Concentration | Medium |
Major Players *Disclaimer: Major Players sorted in no particular order Image © Mordor Intelligence. Reuse requires attribution under CC BY 4.0. | |
Data Governance Market Analysis by Mordor Intelligence
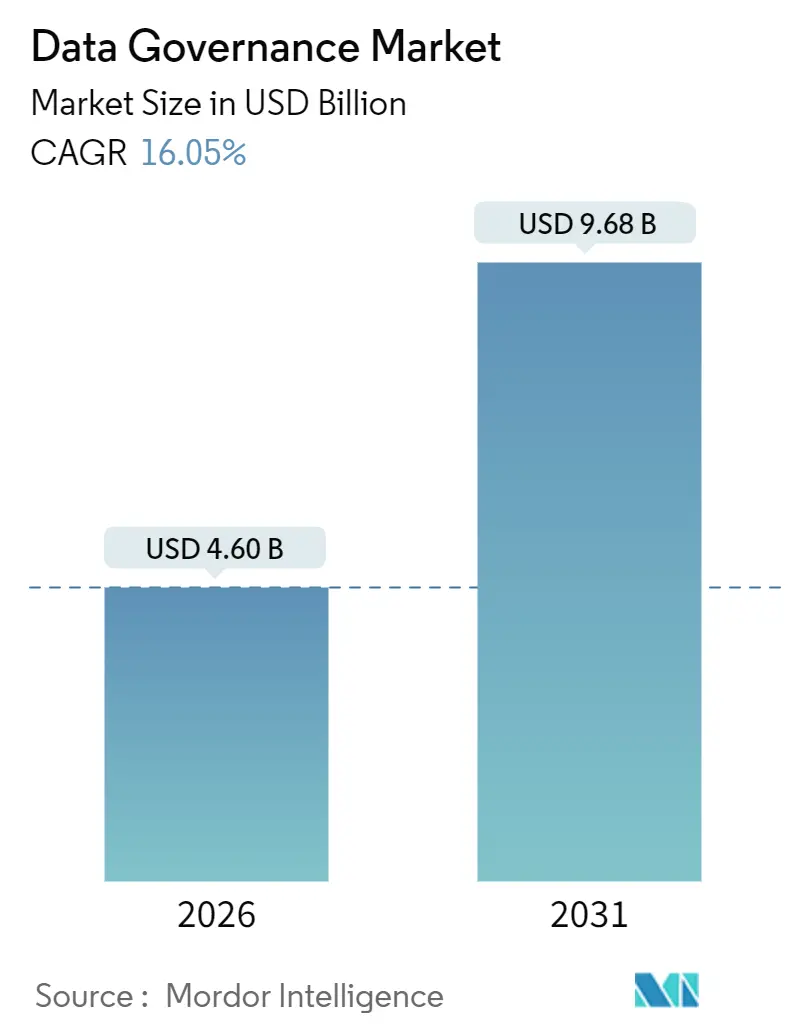
The data governance market size stood at USD 4.60 billion in 2026 and is projected to reach USD 9.68 billion by 2031, translating into a robust 16.05% CAGR across the forecast window. Strategic stewardship of enterprise data is replacing compliance-only postures as regulators demand explainable lineage for AI, real-time payment rails collapse batch reconciliation windows, and sovereign-cloud mandates force in-country catalog replication. Software continued to dominate with 65.66% revenue share in 2025, though data security and privacy governance tools are scaling fastest at 19.62% CAGR. Cloud deployment already accounts for 72.44% of installations and is growing at 17.42% CAGR because hyperscalers embed lineage and quality controls directly into managed pipelines. Large enterprises generated 70.24% of 2025 spending, yet small and medium enterprises are accelerating at 18.76% CAGR as modular SaaS pricing lowers entry barriers for firms lacking seven-figure budgets.
Key Report Takeaways
- By component, software led with 65.66% of revenue in 2025, while data security and privacy governance tools are set to expand at a 19.62% CAGR through 2031.
- By deployment, cloud commanded a 72.44% share of the data governance market size in 2025 and is poised to advance at a 17.42% CAGR to 2031.
- By organization size, large enterprises held 70.24% of 2025 spending, yet small and medium enterprises are projected to grow at an 18.76% CAGR during the same period.
- By business function, IT and operations captured 34.56% of 2025 revenue, whereas legal and compliance is forecast to expand at a 16.38% CAGR through 2031.
- By application, risk management accounted for 29.56% of the data governance market share in 2025, and data quality management is tracking a 17.58% CAGR to 2031.
- By end-user industry, BFSI led with 25.38% of 2025 spending; manufacturing shows the fastest momentum with an 18.96% CAGR through 2031.
- By geography, North America remained the largest region at 42.64% share in 2025, while Asia Pacific is advancing at an 18.22% CAGR toward 2031.
Note: Market size and forecast figures in this report are generated using Mordor Intelligence’s proprietary estimation framework, updated with the latest available data and insights as of January 2026.
Global Data Governance Market Trends and Insights
Drivers Impact Analysis*
| Driver | (~) % Impact on CAGR Forecast | Geographic Relevance | Impact Timeline |
|---|---|---|---|
| EU AI Act and Global AI-Regulation Requiring Explainable Data Lineage | +3.2% | Global, with early enforcement in EU27 and spillover to UK, Canada | Medium term (2-4 years) |
| FedNow and Real-Time Payment Rails Forcing Sub-millisecond Data Integrity in North American BFSI | +2.8% | North America, with parallel initiatives in Brazil (PIX) and India (UPI) | Short term (≤ 2 years) |
| Asia Pacific Sovereign-Cloud Mandates Accelerating In-Country Data Catalog Investments | +3.5% | APAC core (India, Indonesia, Vietnam), spillover to Middle East and Africa | Medium term (2-4 years) |
| Retail-Media Monetisation Elevating Product-Master Data Quality Spend | +2.1% | Global, concentrated in North America and Western Europe | Short term (≤ 2 years) |
| Edge Analytics in Manufacturing 4.0 Demands Near-Edge Metadata Federation | +2.4% | Global, with manufacturing hubs in Germany, China, United States, Japan | Long term (≥ 4 years) |
| Generative AI Governance Use Cases Elevating Automated Metadata Discovery Spend | +3.0% | Global, led by technology firms in North America and Asia Pacific | Medium term (2-4 years) |
| Source: Mordor Intelligence | |||


EU AI Act and Global AI-Regulation Requiring Explainable Data Lineage
The EU AI Act has been in force since August 2024 and classifies high-risk systems, compelling deployers to maintain end-to-end lineage that documents data provenance, bias-mitigation steps, and retraining triggers. Multinationals now standardize on automated lineage platforms that parse SQL, Python, and ETL workflows for cross-jurisdictional audit readiness, a trend already mirrored by Canada’s Artificial Intelligence and Data Act.[1]Government of Canada, “Artificial Intelligence and Data Act,” canada.ca Financial institutions face heightened exposure because algorithmic models intertwine AI Act duties with stringent GDPR obligations. Penalties reaching 6% of global turnover elevate governance from an IT concern to a board-level risk, quickly unlocking budget approvals for catalog and lineage projects in the data governance market.
FedNow and Real-Time Payment Rails Forcing Sub-Millisecond Data Integrity in North American BFSI
FedNow, which attained critical mass in 2025, processes payments within 10 seconds, compressing reconciliation cycles and demanding real-time data-quality checks at the transaction edge. Banks have retired nightly profiling jobs in favor of streaming tools that validate Kafka topics or Flink state stores in milliseconds. Comparable dynamics in Brazil’s PIX system and India’s UPI underscore a global move toward instant payments, and a single data-quality lapse can cascade into millions of false declines or duplicate postings, far outweighing governance tool costs.
Asia Pacific Sovereign-Cloud Mandates Accelerating In-Country Data Catalog Investments
India’s Digital Personal Data Protection Act restricts cross-border transfers, obliging enterprises to run catalogs within national borders while still synchronizing global metadata.[2]Ministry of Electronics and Information Technology, “Digital Personal Data Protection Act, 2023,” meity.gov.in Indonesia and Vietnam have enacted similar localization laws, prompting hyperscalers to launch sovereign regions and enterprises to implement air-gapped governance stacks.[3]Amazon Web Services, “AWS Sovereign Cloud,” aws.amazon.com Financial services, healthcare, and telecom operators shoulder the heaviest burden as sectoral rules overlay general data-protection statutes, sparking double-digit catalog spending across the region.
Generative AI Governance Use-Cases Elevating Automated Metadata Discovery Spend
Large language models ingest terabytes of unstructured files, making manual tagging infeasible. Organizations now deploy discovery engines that apply NLP to flag sensitive documents before model training. Microsoft Purview and AWS Macie have added AI-specific classifiers, yet double-digit false-positive rates necessitate human-in-the-loop review. Demand is strongest in finance where generative models draft investment memos that must exclude embargoed content, turning automated discovery into a non-negotiable control for audit-ready transparency.
Restraints Impact Analysis*
| Restraint | (~) % Impact on CAGR Forecast | Geographic Relevance | Impact Timeline |
|---|---|---|---|
| High Total Cost of Ownership for Enterprise-Scale Data Lineage Tooling in Tier-1 Banks | -1.8% | Global, concentrated in North America and Europe | Short term (≤ 2 years) |
| Talent Shortage of Certified Data Stewards and DCAM Practitioners | -1.5% | Global, acute in North America and Western Europe | Medium term (2-4 years) |
| Legacy Mainframe Interoperability Issues Limiting Real-Time Governance in Defense Agencies | -0.9% | National, with early challenges in United States, United Kingdom, France | Long term (≥ 4 years) |
| Limited Inter-Catalog Interoperability Creating Metadata Silos in Multi-Cloud Environments | -1.2% | Global, affecting enterprises with hybrid AWS, Azure, Google Cloud deployments | Medium term (2-4 years) |
| Source: Mordor Intelligence | |||
High Total Cost of Ownership for Enterprise-Scale Data Lineage Tooling in Tier-1 Banks
Full-stack governance programs can exceed USD 10 million during the first year when software licenses, professional services, and custom connectors are combined, with ongoing spend near USD 5 million annually. Budget approval therefore competes with revenue-generating priorities such as digital banking. Mid-tier banks struggle even more, lacking IT staff to configure complex lineage engines, which further inflates the effective cost per data asset and prolongs payback periods.
Talent Shortage of Certified Data Stewards and DCAM Practitioners
Fewer than 10,000 professionals worldwide hold CDMP or equivalent credentials, with median salaries in North America surpassing USD 120,000 and turnover exceeding 20%. Regulated industries suffer most because stewards must blend domain and compliance knowledge. Universities are only beginning to update curricula, so enterprises adopt AI-assisted classification tools to ease the load, yet those tools still demand human validation, leaving the shortage unresolved in the medium term.
*Our forecasts treat driver/restraint impacts as directional, not additive. The impact forecasts reflect baseline growth, mix effects, and variable interactions.
Segment Analysis
By Component: Software Dominates but Security Tools Surge
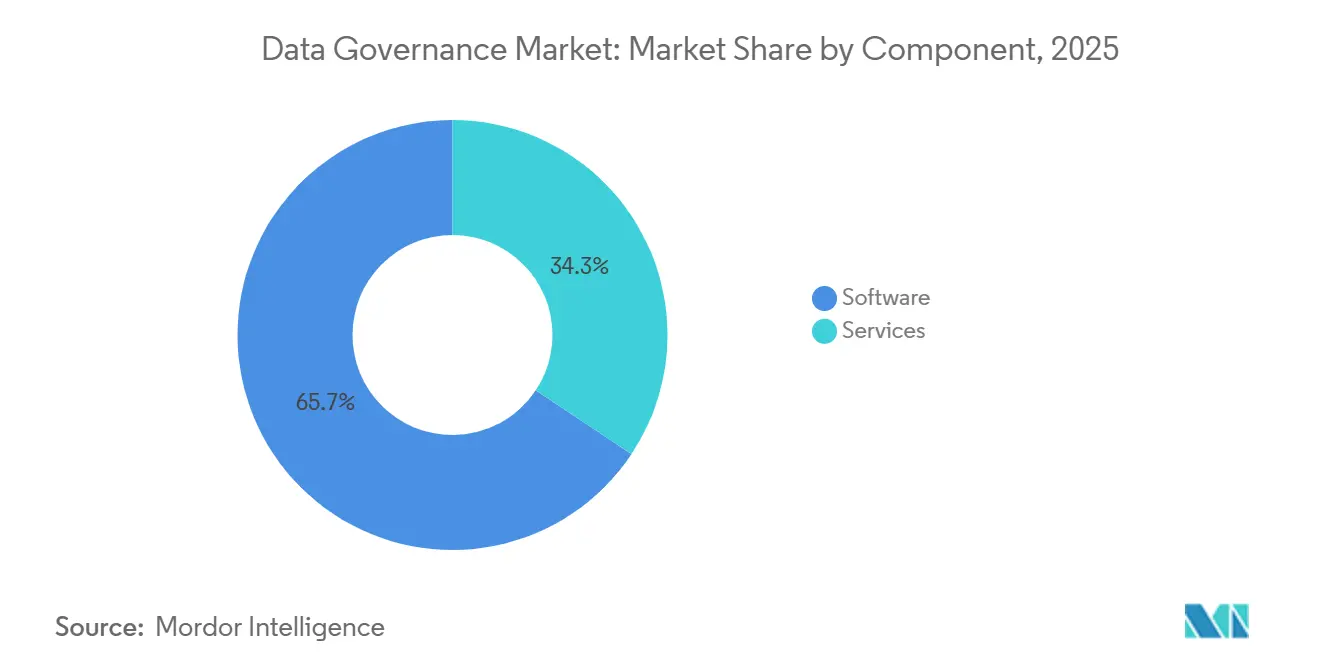
Software generated 65.66% of 2025 revenue as enterprises preferred best-of-breed catalogs, lineage, and master-data platforms over monolithic suites. Data security and privacy governance sub-segments are forecast to grow at 19.62% CAGR, propelled by EU AI Act transparency requirements and sovereign-cloud mandates. Services captured 34.34%, with professional engagements expanding as on-premise estates migrate to cloud architectures. Vendors now overlap governance and observability, folding lineage alerts into DevOps dashboards, although pure-play providers still hold the deepest catalog capabilities.
Demand patterns illustrate how governance converges with cyber postures. Security-oriented platforms automate consent tracking and cross-border transfer logs, while quality and profiling tools extend into machine learning pipelines. The data governance market size attributable to privacy tools is poised to double by 2031. Growth also benefits from ISO 27001 certification trends, because BFSI and healthcare buyers request third-party attestations as procurement prerequisites in the data governance market.

By Deployment: Cloud Leads with Hybrid Architectures Gaining
Cloud deployment owned 72.44% share in 2025 and is on track for a 17.42% CAGR. Hyperscaler services such as AWS Glue Data Catalog, Microsoft Purview, and Google Dataplex integrate lineage at the pipeline level, sidestepping separate catalog rollouts. Digital-native retailers and media firms favor these managed services to minimize operational overhead. On-premise installations remain relevant for defense, government, and highly regulated banks where data must stay behind firewalls, keeping hybrid architectures in play.
Cost dynamics are nuanced. Scanning millions of cloud objects daily can push monthly catalog fees beyond USD 50,000. Consequently, some enterprises repatriate governance workloads to self-hosted Kubernetes clusters, especially when GDPR transfer-impact assessments complicate standard hyperscaler contracts. Over the forecast period, cloud footprints will still expand, but tooling flexibility to trace data across hybrid estates will dictate vendor selection.
By Organization Size: SMEs Adopt Modular SaaS
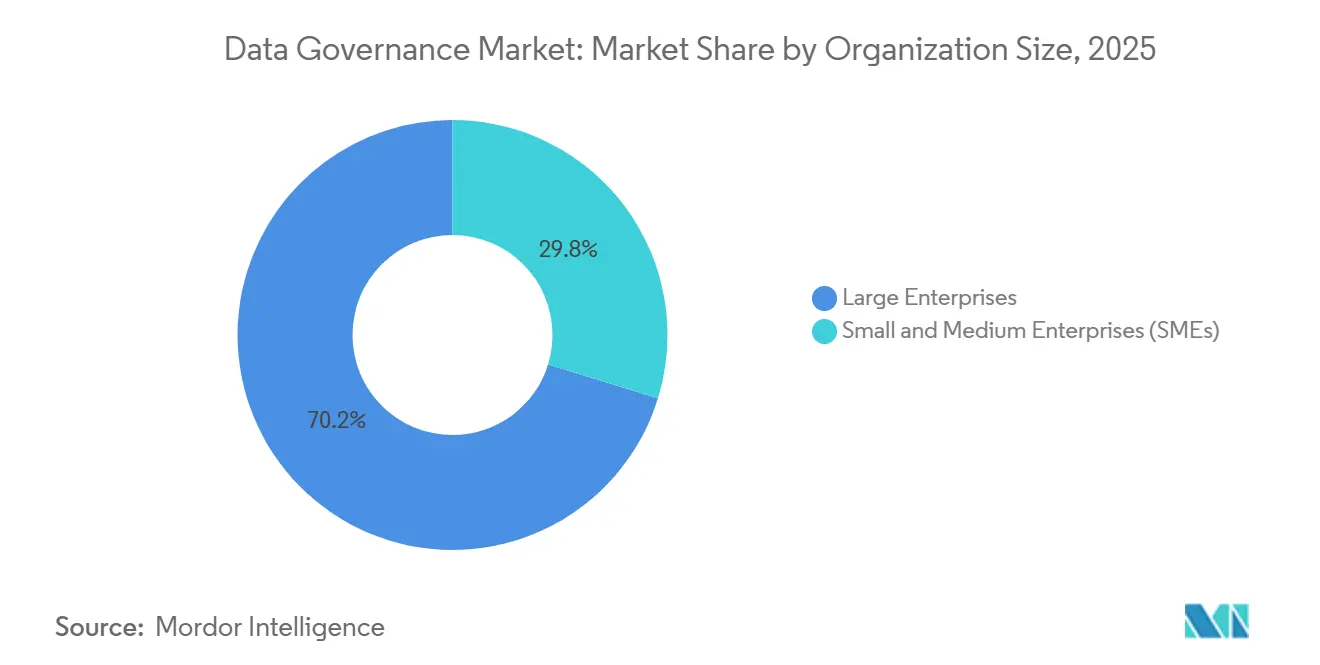
Large enterprises contributed 70.24% of 2025 revenue thanks to sprawling data estates and dedicated data-office teams. They run multi-year programs with budgets topping USD 1 million and require cross-cloud lineage plus role-based access control. Small and medium enterprises are growing at 18.76% CAGR as vendors unbundle features into per-user SaaS modules, eliminating six-figure upfront licenses.
Vertical-specific bundles are emerging, such as healthcare catalogs pre-populated with HIPAA taxonomies or retail templates that map product master data out of the box. The data governance market share for SMEs will climb as automated classification reduces the need for in-house stewards. Meanwhile, large enterprises experiment with federated governance where business units manage local catalogs but synchronize metadata centrally, heightening demand for inter-catalog APIs.
By Business Function: Legal and Compliance Accelerate
IT and operations sustained 34.56% share in 2025, reflecting ownership of infrastructure budgets. However, legal and compliance is advancing at a 16.38% CAGR because India’s Digital Personal Data Protection Act and the EU AI Act have pushed documentation duties onto in-house counsel. Finance and risk teams remain major users for Basel III and Solvency II reporting.
Marketing departments increasingly rely on catalogs to manage customer consent and retail-media data quality, while HR integrates governance to track diversity analytics under labor laws. Vendors pitching governance as a compliance enabler win quicker funding than those emphasizing productivity because penalties are quantifiable, whereas efficiency gains are harder to monetize.
By Application: Data Quality Management Gains Momentum
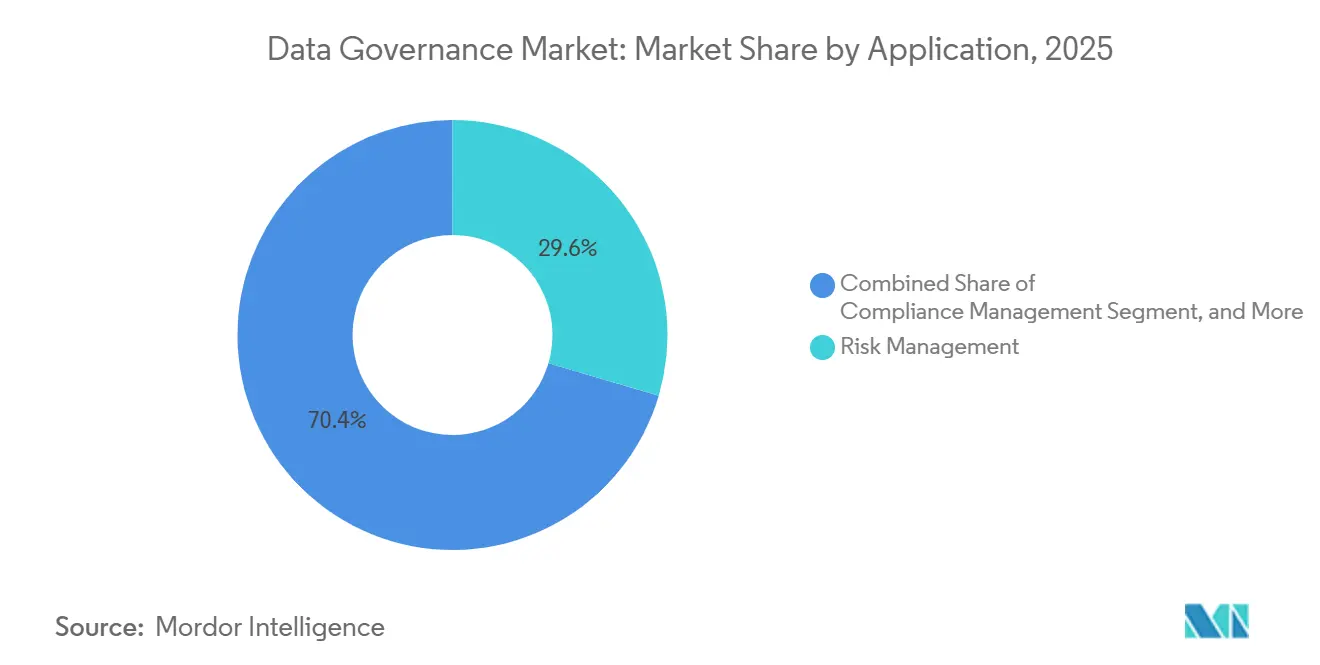
Risk management led with 29.56% share in 2025 due to stringent regulatory reporting in BFSI. Data quality management posts the fastest 17.58% CAGR, driven by retail-media networks that cannot tolerate duplicate product entries or stale inventory feeds. Compliance management also commands sizeable demand, automating GDPR and CCPA workflows.
Incident management remains niche but valuable for breach investigations. The data governance market size tied to data quality will swell as unstructured text, image, and IoT streams flood into AI models that require anomaly detection beyond relational profiling. Convergence with observability platforms enables automated quarantine of bad records, closing the loop from detection to remediation in minutes rather than days.

By End-User Industry: Manufacturing Surges on Edge Analytics
BFSI maintained the highest 25.38% share during 2025 as banks and insurers documented lineage for risk and regulatory audits. Manufacturing, however, is expanding at 18.96% CAGR because Industry 4.0 programs must reconcile sensor streams with ERP data in near real time. IT and telecom, healthcare, and retail each deploy governance for sector-specific needs such as 5G fraud detection, clinical-trial integrity, and omnichannel personalization.
In discrete manufacturing, recall liabilities push governance spending higher than in process industries. ISO 9001 and IATF 16949 traceability demands reinforce purchases of automated lineage that can capture shop-floor data without human intervention. As factories modernize MES and PLM systems, data catalog integration becomes an essential companion project.
Geography Analysis
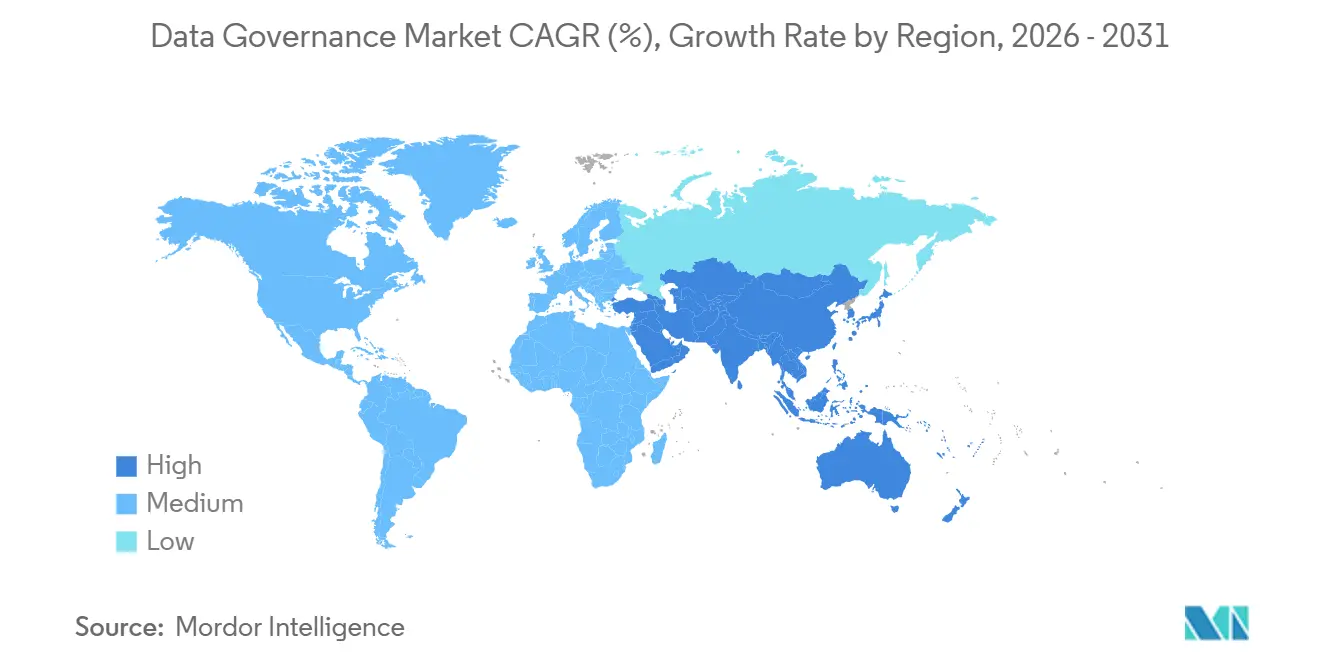
North America held 42.64% share in 2025, underpinned by FedNow adoption, major cloud hyperscalers, and AI regulations converging with Canada’s new federal act. Historical CAGR of roughly 13% has ticked upward as instant payments and generative AI elevate governance urgency. Mexico adds incremental upside as nearshoring extends U.S. supply-chain transparency frameworks.
Asia Pacific is the fastest-growing region at 18.22% CAGR. Sovereign-cloud mandates in India, Indonesia, and Vietnam oblige in-country catalogs, while China’s Personal Information Protection Law drives domestic demand for lineage tools embedded in Alibaba and Tencent clouds. Japan and South Korea invest steadily to support digital manufacturing and open banking, whereas mature Australian markets expand more modestly.
Europe continues to invest due to GDPR and the EU AI Act. Nordic governments adopt cloud-first strategies that favor managed governance services, but Southern and Eastern Europe lag owing to constrained budgets. The Middle East and Africa and South America remain smaller markets, yet sovereign investment funds and privacy statutes in the UAE, Brazil, and South Africa are catalyzing compliance-driven rollouts.

Regulatory Landscape
The regulatory environment for data governance is tightening and broadening from privacy-only obligations to enterprise-wide data asset control that supports AI accountability and cross-sector data sharing. The EU AI Act has been in force since August 2024, and it elevates requirements for traceable data provenance and documentation for high-risk AI systems, reinforcing demand for explainable lineage and auditable metadata across the EU27 and spillover markets. In parallel, several governments published dedicated data governance frameworks in 2025-2026, including the UK Government Data Asset Management Policy (May 2026) for central identification and reporting of critical data assets across departments.
Across emerging markets, national data governance strategies are being formalized to standardize public-sector data lifecycle management and enable secure data sharing. This, in turn, affects vendor selection and deployment architecture for sovereign and hybrid environments. Examples include Kenya's Draft Final National Data Governance Policy (May 2026), Pakistan's National Data Governance Policy (June 2026), and Peru's National Data Governance Strategy 2026-2030 approved under Resolucion Ministerial 049-2026-PCM. These moves reinforce in-country cataloging, standardized classifications, and stronger accountability models that filter into regulated industries such as BFSI, healthcare, and telecom.
Value Chain Analysis
The data governance value chain starts with upstream infrastructure and data-platform layers, including cloud, data lakehouse/warehouse, streaming, and integration tools, where metadata is generated and policy hooks are exposed. Governance software providers deliver catalogs, lineage, quality, and privacy controls, increasingly as platform-native governance planes embedded into managed services and lakehouse stacks. Neutral governance vendors also position themselves as cross-cloud orchestration layers.
Implementation and operations are led by professional services, systems integrators, and managed service providers that configure connectors, define policies and operating models, and build stewardship workflows across business functions. Downstream demand is activated by data producers and consumers inside enterprises, including domain teams that own data products, central data offices that set standards, and legal, compliance, and risk stakeholders that operationalize regulatory controls. Key bottlenecks include fragmented legacy estates, including mainframes, limited interoperability between catalogs in multi-cloud environments, and a shortage of qualified data stewards, which raises implementation effort and increases reliance on automation for discovery and classification. As governance shifts from periodic reporting to continuous controls for real-time data and AI pipelines, vendors and service partners compete on connector depth, runtime enforcement, and the ability to federate metadata across hybrid deployments.
Competitive Landscape
Competitive Landscape
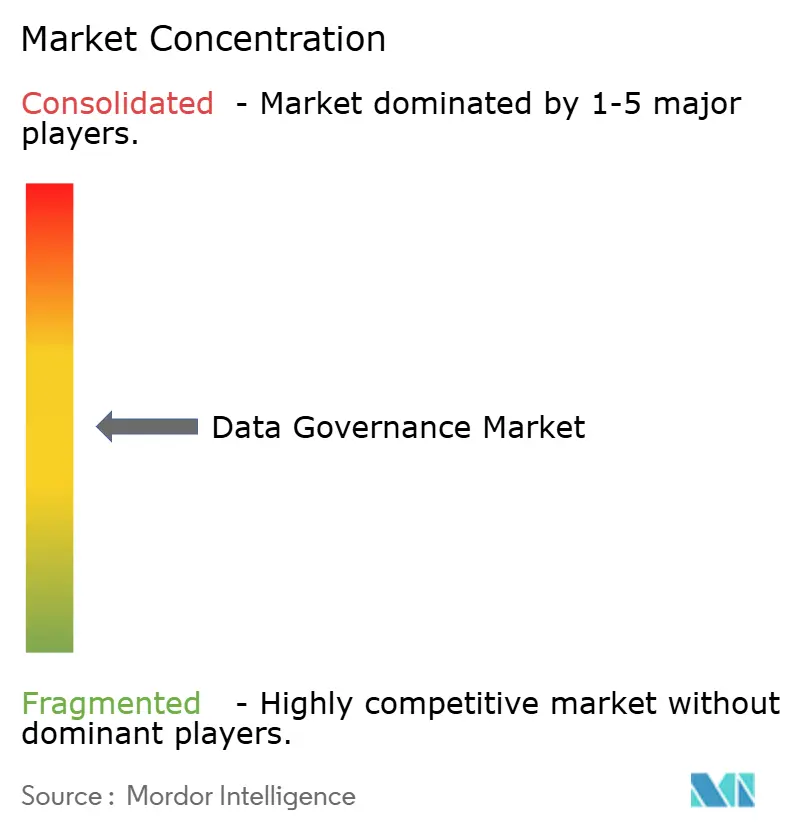
The market is moderately fragmented. Hyperscalers bundle governance into platform services that appeal to single-cloud adopters, while neutral vendors such as Collibra, Informatica, and Alation position themselves as cross-cloud orchestration layers. New entrants like Monte Carlo and Ataccama embed lineage into data observability workflows, broadening the field.
White-space opportunities persist in real-time lineage for streaming architectures and automation for unstructured lakes. Partnerships between catalog and security providers such as Varonis and OneTrust combine discovery with access governance. Vendors differentiate through generative-AI capabilities, natural-language search, and blockchain-backed audit trails, though these features still demand human oversight to validate edge cases.
Pricing and implementation complexity keep total cost of ownership high, but modular SaaS and vertical templates are lowering barriers for SMEs. Vendor roadmaps now emphasize sovereign-cloud readiness and AI-driven classifiers to maintain relevance amid accelerating regulation.
Data Governance Industry Leaders
Collibra NV
TIBCO Software Inc.
Alation Inc.
Microsoft Corporation
IBM Corporation
- *Disclaimer: Major Players sorted in no particular order

Market Opportunities and Future Outlook
Regulatory expansion into industrial and non-personal data governance is creating whitespace beyond traditional privacy programs, especially where connected devices and operational technology generate shared data that must be accessed and governed across ecosystems. The EU Data Act, effective September 2025, mandates fair access to industrial data and introduces obligations that push enterprises to strengthen contract-aware metadata, data portability processes, and governance for shared data products. This extends demand from classic IT datasets into manufacturing and other asset-heavy industries. Standards activity also supports more structured adoption, including ITU-T D.1141 (April 2025) for big data policy principles in telecommunications and ETSI TR 104 409 (2024) highlighting standardization gaps relevant to Data Act compliance in IoT ecosystems.
A second opportunity is operationalizing governance for AI development and deployment, where organizations look for a single system of record for lineage, policy, and evidence across training data, prompts, outputs, and model changes. Trade bodies and sector programs are publishing playbooks, such as TM Forum's Data Governance Guidebook v3.4.0 (November 2024), which helps telecom operators translate maturity goals into repeatable governance assets and controls. In markets advancing national frameworks, such as Kenya's Draft Final National Data Governance Policy (May 2026), vendors that package pre-mapped taxonomies, localization-ready catalogs, and cross-agency data sharing controls can support public-sector rollouts and adjacent regulated industries that align with government-led standards.
Recent Industry Developments
- July 2026: Alation announced the launch of Alation Intelligence Operating System (AIOS), positioning it as an operating layer to govern AI across development and deployment. The release reflects a shift from static cataloging toward runtime oversight aligned to enterprise AI programs that require traceability and controlled access to governed data.
- May 2026: Collibra launched AI Command Center to provide real-time oversight and continuous control for agentic AI, including integrations intended to strengthen evaluation and governance workflows. The product direction extends governance from data assets into active AI control planes, reinforcing vendor differentiation around automated policy enforcement and audit-ready evidence.
- May 2025: FedNow reached broader operational usage in the United States, compressing payment reconciliation windows and raising the cost of data-quality lapses in real-time processing environments. This operational shift accelerated adoption of streaming-capable governance patterns, including continuous validation and lineage across event-driven pipelines in BFSI.


Research Methodology Framework and Report Scope
Market Definition and Coverage
This market covers tools and related services that help organizations set data policies, assign ownership, manage metadata and lineage, and monitor controls so business data stays trusted and compliant across on-premises and cloud systems.
Scope exclusions: We exclude stand-alone data quality utilities, master data management suites sold without governance functionality, and broader AI governance programs that are not tied to enterprise data governance workflows.
Segmentation Overview
- By Component
- Software
- Data Quality and Profiling Tools
- Metadata Management and Data Catalog
- Master Data Management
- Data Lineage and Impact Analysis
- Data Security and Privacy Governance
- Services
- Professional Services
- Managed Services
- Software
- By Deployment
- Cloud
- On-Premise
- By Organization Size
- Large Enterprises
- Small and Medium Enterprises (SMEs)
- By Business Function
- IT and Operations
- Legal and Compliance
- Finance and Risk
- Marketing and Sales
- Human Resources
- Other Business Functions
- By Application
- Compliance Management
- Risk Management
- Audit Management
- Incident Management
- Data Quality Management
- Other Applications
- By End-User Industry
- BFSI
- IT and Telecom
- Healthcare and Life Sciences
- Retail and E-Commerce
- Government and Defense
- Manufacturing
- Energy and Utilities
- Media and Entertainment
- Other End-User Industries
- By Geography
- North America
- United States
- Canada
- South America
- Brazil
- Argentina
- Chile
- Mexico
- Rest of South America
- Europe
- Germany
- United Kingdom
- France
- Italy
- Spain
- Sweden
- Norway
- Finland
- Denmark
- Russia
- Rest of Europe
- Asia Pacific
- China
- India
- Japan
- South Korea
- Southeast Asia
- Australia
- New Zealand
- Rest of Asia Pacific
- Middle East
- United Arab Emirates
- Saudi Arabia
- Qatar
- Turkey
- Israel
- Rest of Middle East
- Africa
- South Africa
- Nigeria
- Kenya
- Rest of Africa
- North America
Data Sources, Market Sizing, and Validation
Desk Research
Desk work starts with public signals that show how fast regulated data use is expanding and where budgets are moving. We typically rely on sources such as the US Bureau of Labor Statistics for tech employment trends, the US Securities and Exchange Commission filings for IT spend language and risk priorities, and NIST publications for common governance and security control references.
To keep assumptions grounded, we also review material from organizations such as the OECD and World Bank for digitalization indicators, plus regulator and law text summaries from official government portals for privacy and data handling requirements. These inputs are then paired with annual reports, investor presentations, reputable press coverage, and product documentation that helps interpret what is counted as governance versus adjacent analytics or security tooling. A paid subscription for company financials and intelligence, plus a patent database, is used selectively to confirm vendor exposure and feature direction, and then to cross-check the pace of new governance capabilities. The sources listed above are illustrative only, and we also used other public and paid references during validation and clarification.
Primary Interviews and Surveys
Primary validation was done through expert interviews and structured surveys with platform providers, system integrators, and enterprise buyers who own governance programs. Inputs focused on how governance is packaged and priced, typical adoption triggers (privacy rules, cloud migration, and data product programs), and what portion of adjacent spend is truly governance rather than data management in general. Since the scope is global, we ensured coverage across the Americas, EMEA, and APAC so regional regulation differences and cloud maturity were reflected in the final assumptions.
Distribution of primary research fieldwork respondents
| Company type | Respondent position | Region |
|---|---|---|
| Top tier: 36% | CXOs: 14% | APAC: 41% |
| Mid tier: 48% | Functional/Unit leaders: 34% | EMEA: 34% |
| Smaller Players: 16% | Managers: 52% | Americas: 25% |
Market-Sizing & Forecasting
Sizing is built using a top-down approach where enterprise software and IT services spend is filtered into a realistic governance demand pool, and then narrowed again using adoption and packaging rules. In practice, we use inputs such as cloud and data platform migration intensity, the share of enterprises operating under strict privacy obligations, the pace of data catalog and metadata standardization, typical subscription and services mix, and average contract values observed in interviews.
Those assumptions are then corroborated with selective bottom-up approximations, including sampled vendor revenue splits where available, channel checks from integrators, and a simple ASP times volume logic based on active customer counts and renewal patterns. When bottom-up signals are incomplete, gaps are handled using proxy ratios from similar enterprise data management tools and then adjusting with interview feedback so the result stays realistic by region and by organization size. For forecasting, scenario analysis is used around regulation enforcement strength, cloud adoption speed, and macro IT budget cycles, and the chosen path is aligned to expert consensus on how governance programs are being funded and prioritized.
Data Validation & Update Cycle
Outputs are checked against independent signals like enterprise software budget direction, public risk and compliance disclosures, and the observed growth of adjacent metadata and catalog activity. Variance checks are run by geography and by buyer cohort, and outliers are reviewed until the drivers are clear and the assumptions are internally consistent.
Before sign-off, the model is reviewed in multiple steps, with re-contact triggers when a key assumption shifts, such as a major regulation update or a noticeable pricing change in packaging. The report is refreshed annually, and interim updates are made when material events affect spend behavior. Right before delivery, a final pass is done so the market numbers reflect the latest available public data and interview learnings.
Mordor Intelligence's Data Governance Market Size Compared Against Other Published Estimates
Published market values for data governance can look far apart because the counted scope is not always the same, and because base years and pricing logic differ across studies. Differences also show up when one study anchors on policy and stewardship workflows, while another bundles a wider set of data management tools.
The main gap comes from whether stand-alone data quality tools and non-governance MDM revenue are folded in, and in our case Mordor Intelligence keeps those adjacent items out unless they are sold and used as part of a governance program with policy, metadata, and control ownership. Another driver is how subscription pricing is projected, where some estimates assume aggressive seat expansion, while others model renewal-heavy growth with slower ASP uplift and tighter currency timing. Refresh cadence matters too, because fast-changing cloud packaging can shift what is counted as governance services versus platform features.
Benchmark comparison
| Source | Market Size | Gaps in Research Methodology |
|---|---|---|
| Mordor Intelligence | USD 4.60 B (2026) | |
| Global Consultancy A | USD 5.38 B (2025) | Uses a different base year and appears to apply a broader component definition for solutions and services, which can pull adjacent data management spend into the total and lift the starting value. |
| Industry Publisher B | USD 4.30 B (2024) | Anchors the market in an earlier year and applies a higher growth curve to reach its later-year target, which can reflect more aggressive adoption and pricing expansion assumptions versus renewal-led growth. |
The comparison shows that the spread is mainly explained by scope inclusions and how base year pricing is carried forward. By tying the total to clear governance workflows and then validating with buyer and partner checks, we keep a practical number that can be repeated and updated as packaging and regulation signals shift.


Key Questions Answered in the Report
What is the projected value of the data governance market in 2031?
The market is forecast to reach USD 9.68 billion by 2031, reflecting a 16.05% CAGR from 2026 to 2031.
Which component is expanding the fastest through 2031?
Data security and privacy governance software is growing at a 19.62% CAGR as firms meet AI-related transparency and localization mandates.
Why is Asia Pacific the fastest-growing region?
Sovereign-cloud laws in India, Indonesia, and Vietnam force in-country catalog deployment, driving an 18.22% CAGR in regional spending.
How are small and medium enterprises adopting governance tools?
Modular SaaS pricing and vertical-specific templates reduce upfront costs, propelling SME spending at an 18.76% CAGR.
Which application shows the strongest growth momentum?
Data quality management leads with a 17.58% CAGR as retail-media and IoT use cases demand cleaner, real-time datasets.
What key challenge hampers large-scale governance programs?
High total cost of ownership, often exceeding USD 10 million in the first year for Tier-1 banks, slows adoption despite regulatory pressure.
Page last updated on:






