Data Broker Market Size and Share
Market Overview
| Study Period | 2020 - 2031 |
|---|---|
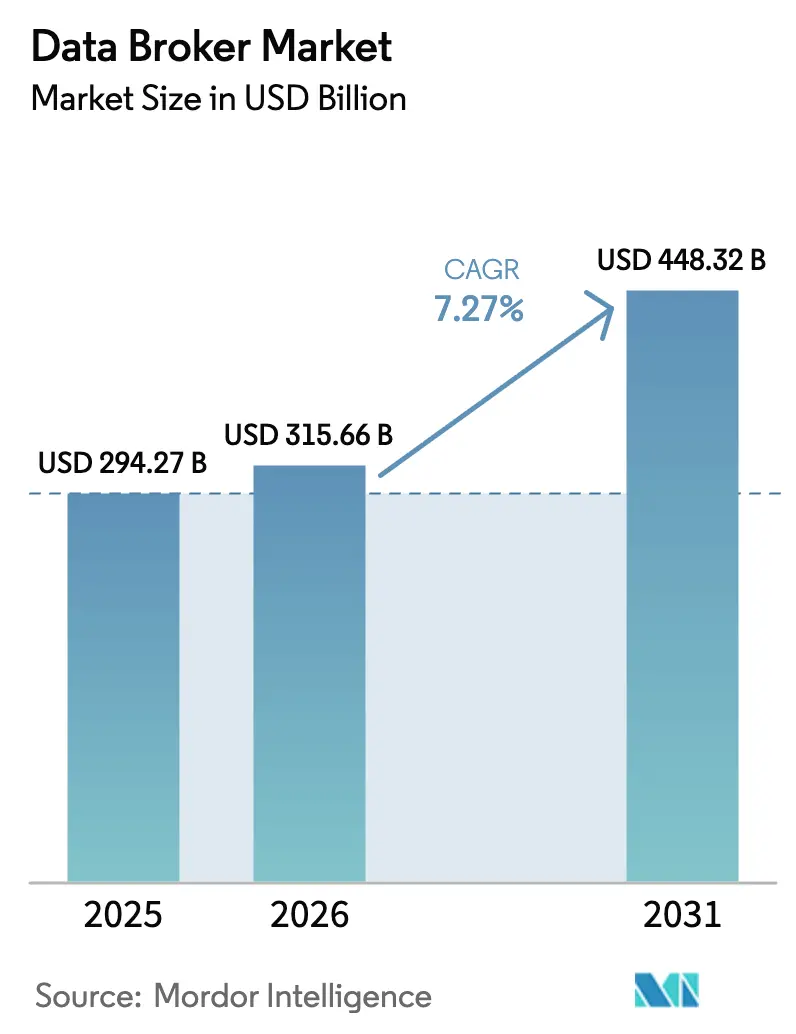
| Market Size (2026) | USD 315.66 Billion |
| Market Size (2031) | USD 448.32 Billion |
| Growth Rate (2026 - 2031) | 7.27% CAGR |
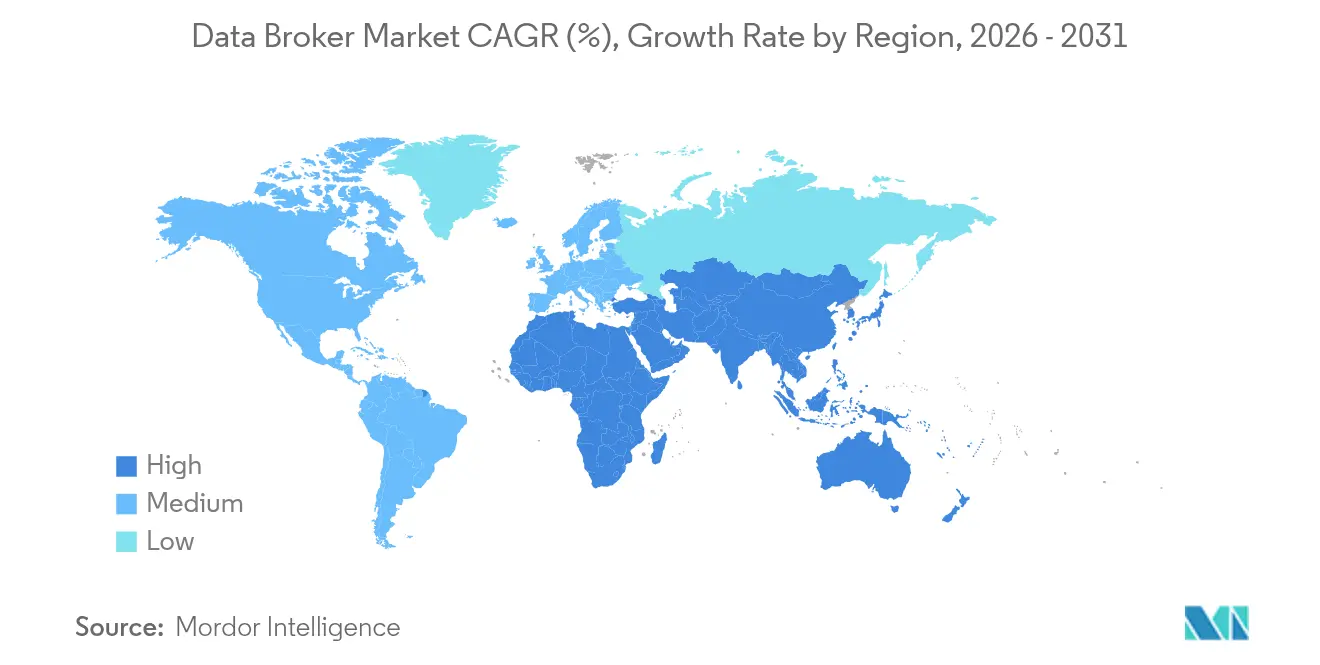
| Fastest Growing Market | Asia Pacific |
| Largest Market | North America |
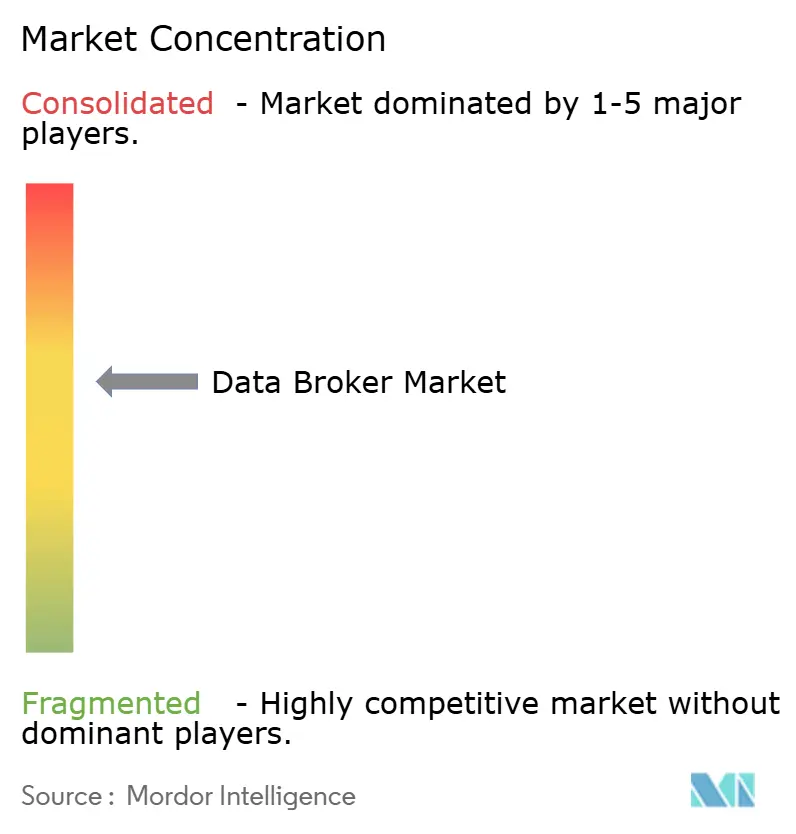
| Market Concentration | Medium |
Major Players *Disclaimer: Major Players sorted in no particular order Image © Mordor Intelligence. Reuse requires attribution under CC BY 4.0. | |
Data Broker Market Analysis by Mordor Intelligence
The data broker market size was valued at USD 294.27 billion in 2025 and estimated to grow from USD 315.66 billion in 2026 to reach USD 448.32 billion by 2031, at a CAGR of 7.27% during the forecast period (2026-2031). This upward trajectory is closely tied to the growth of digital touchpoints that continuously generate vast data streams and to the rapid adoption of artificial intelligence and machine-learning tools that help businesses activate those data assets for customer targeting, risk assessment, and operational efficiency. Demand for high-quality external data has intensified as companies pursue digital-transformation agendas that require richer consumer insights, more accurate fraud-detection signals, and near real-time decision support. North America remains the most mature arena for the data broker market owing to well-established data-monetization frameworks, while Asia-Pacific stands out for its double-digit growth, driven by e-commerce scale-up, mobile-first user behaviors, and supportive cloud infrastructure. Competitive dynamics feature moderate concentration, with long-standing leaders such as Experian, TransUnion, and Oracle reinforcing their positions through targeted acquisitions and platform investments. Privacy regulations and heightened consumer awareness about data usage act as counterweights to otherwise steady demand.
Key Report Takeaways
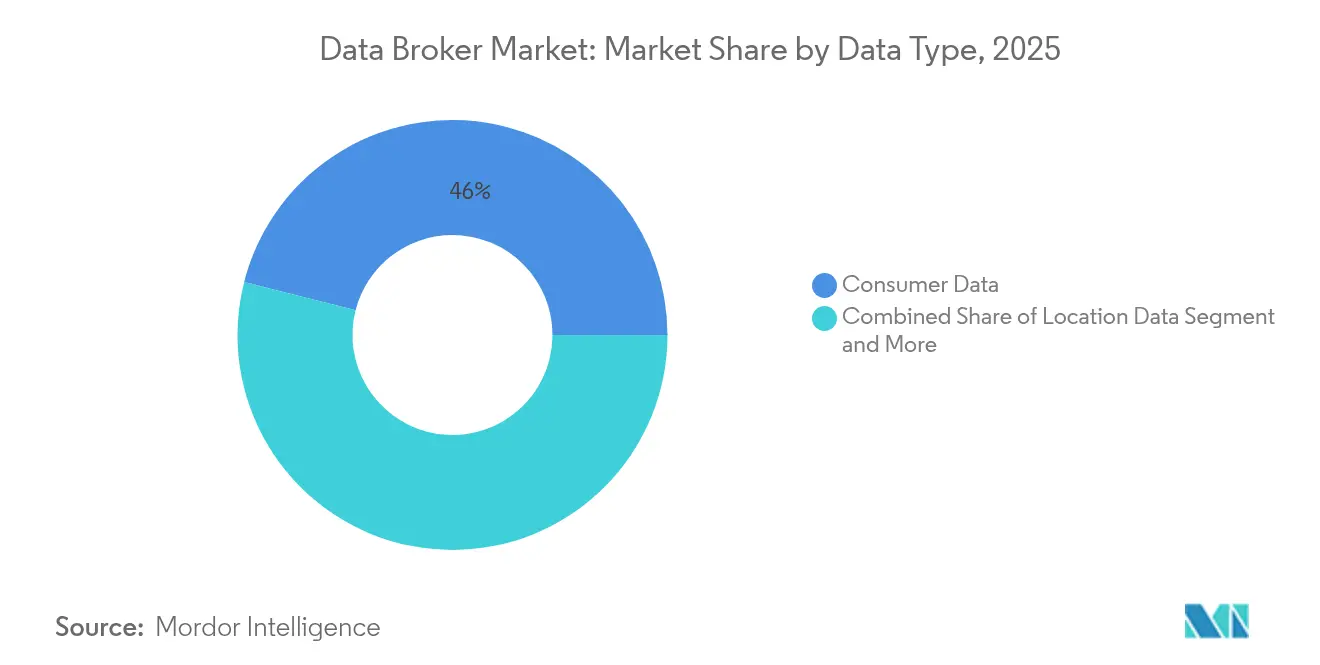
- By data type, consumer data led with 46.03% of data broker market share in 2025; location data is advancing at a 13.68% CAGR through 2031.
- By end user, marketing and advertising agencies held 38.22% of the data broker market size in 2025, while healthcare and life sciences record the fastest CAGR at 14.34% to 2031.
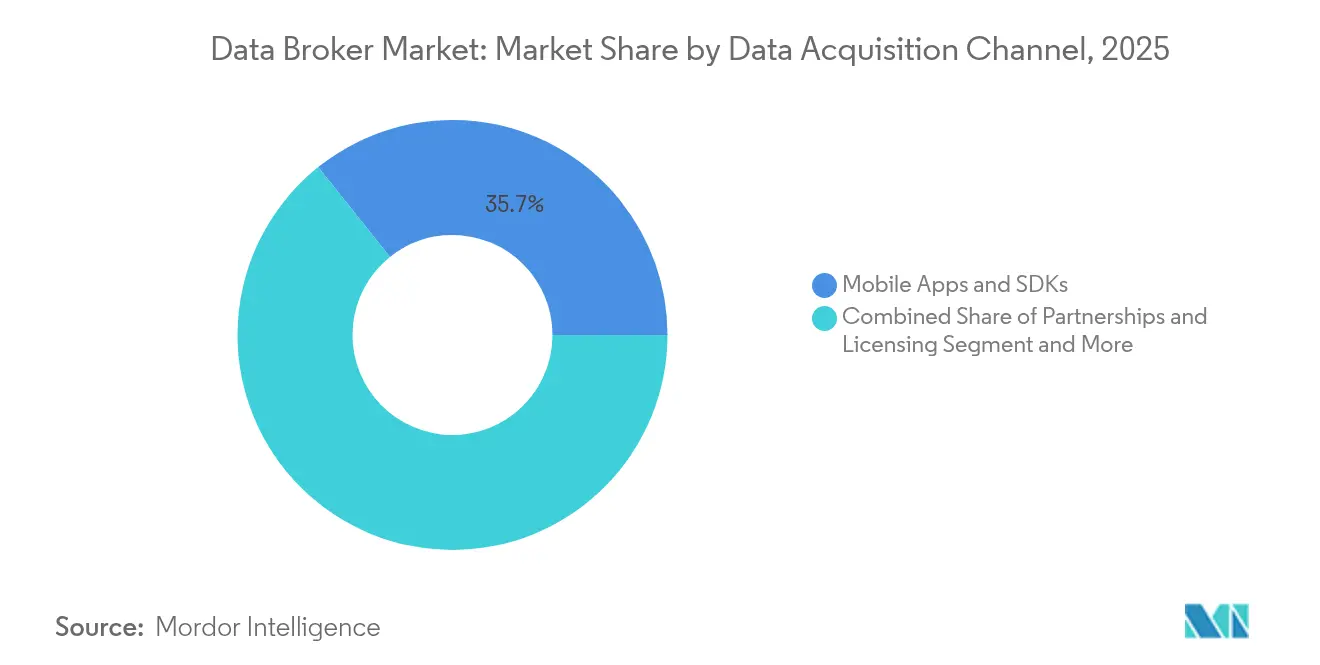
- By data-acquisition channel, mobile apps and SDKs captured 35.74% of the data broker market in 2025; partnership and licensing arrangements are growing at a 13.07% CAGR.
- By delivery mode, APIs and data feeds accounted for 41.17% of data broker market size in 2025, whereas cloud-based marketplaces are expanding at a 14.12% CAGR.
- By geography, North America commanded 47.92% revenue share in 2025; Asia-Pacific is forecast to surge at a 13.41% CAGR to 2031.
Note: Market size and forecast figures in this report are generated using Mordor Intelligence’s proprietary estimation framework, updated with the latest available data and insights as of 2026.
Global Data Broker Market Trends and Insights
Drivers Impact Analysis*
| Driver | (~) % Impact on CAGR Forecast | Geographic Relevance | Impact Timeline |
|---|---|---|---|
| Demand for consumer data in personalized advertising | +2.1% | Global; concentration in North America and EU | Medium term (2-4 years) |
| Big-data and AI-driven audience modeling | +1.8% | Global; led by North America, expanding to Asia-Pacific | Long term (≥4 years) |
| Surge in digital transactions and e-commerce footprints | +1.5% | Global; strongest in Asia-Pacific and Latin America | Short term (≤2 years) |
| Expansion of cloud-based data marketplaces | +1.2% | Global; concentrated in North America and EU | Medium term (2-4 years) |
| Synthetic data generation for privacy-safe enrichment | +0.9% | Global; early adoption in North America and EU | Long term (≥4 years) |
| Web3 tokenization enabling direct data monetization | +0.4% | Global; nascent adoption across regions | Long term (≥4 years) |
| Demand for consumer data in personalized advertising | +2.1% | Global; concentration in North America and EU | Medium term (2-4 years) |
| Source: Mordor Intelligence | |||
Demand for Consumer Data in Personalized Advertising
Personalized advertising continues to fuel the data broker market as brands seek customer-level insights that raise conversion rates across display, mobile, and connected-TV campaigns. Agencies and in-house marketing teams are shifting budgets toward outcome-based buying models that reward accurate audience segmentation. Third-party-cookie deprecation is accelerating demand for alternative identifiers, prompting data brokers to refine unified-ID, probabilistic-matching, and contextual-signals pipelines that preserve reach in a privacy-conscious world. Retail-media networks rely on brokered data to harmonize on-site purchase behaviors with open-internet exposure, creating new revenue streams for brokers adept at bridging first-party and third-party ecosystems. The growth of privacy-safe clean-room implementations further cements brokers’ role as neutral facilitators of compliant data collaboration.[1]The Trade Desk, “Unified ID 2.0 Technical Overview,” thetradedesk.com
Big-Data and AI-Driven Audience Modeling
Machine-learning algorithms need rich, diverse datasets to train predictive models that anticipate purchase intent, churn risk, and lifetime value. Data brokers are investing in AI-ready data fabrics capable of normalizing unstructured social posts, web interactions, and mobile events. Firms specializing in domain-specific training data report double-digit uplifts in model accuracy compared with generic datasets, encouraging buyers to pay premiums for highly curated assets.[2]Gretel.ai, “Synthetic Data Benchmarking Report 2024,” gretel.ai Synthetic-data generation techniques, applied at scale, help brokers deliver statistically valid yet privacy-preserving records, expanding addressable supply while meeting compliance mandates. As generative-AI rollouts accelerate, the data broker market benefits from the steady uptick in demand for both raw and enriched inputs to model fine-tuning processes.
Surge in Digital Transactions and E-Commerce Footprints
Mobile in-app purchase revenue climbed to USD 150 billion worldwide in 2024, with the United States contributing USD 52 billion.[3]Sensor Tower, “Global Mobile Market Forecast 2024,” sensortower.com Each transaction yields behavioral and contextual signals invaluable for fraud-risk scoring, customer-lifetime-value estimation, and omnichannel campaign optimization. Data brokers package aggregated transactional feeds for retailers, payment processors, and fintechs that need real-time intelligence on spending patterns. Combining online carts with offline point-of-sale receipts lets analysts map complete shopper journeys, assisting brands in budget allocation and inventory planning. The commerce data boom thereby reinforces the strategic relevance of brokers that can integrate disparate datasets with low latency.
Expansion of Cloud-Based Data Marketplaces
Cloud providers such as Snowflake, AWS, and Google Cloud now operate sophisticated data-exchange environments where thousands of buyers source curated datasets under consumption-based terms. These marketplaces cut integration time from months to days through standard APIs, streamlined entitlement workflows, and embedded governance controls. Data brokers, especially smaller vendors, benefit from the global distribution reach and reduced customer-acquisition costs. Transparent pricing and on-platform monetization analytics let providers fine-tune offerings faster, creating a virtuous cycle of dataset quality improvements and buyer trust.
Restraints Impact Analysis*
| Restraint | (~) % Impact on CAGR Forecast | Geographic Relevance | Impact Timeline |
|---|---|---|---|
| Global data-privacy regulations tightening | -1.9% | Global; strongest in EU, expanding to North America and Asia-Pacific | Short term (≤2 years) |
| Consumer shift to privacy-centric tools and ad blockers | -1.2% | Global; concentrated in developed markets | Medium term (2-4 years) |
| Deprecation of third-party cookies and identifiers | -0.8% | Global; immediate impact in North America and EU | Short term (≤2 years) |
| Rising cost of data-quality and provenance assurance | -0.6% | Global; higher impact in regulated industries | Medium term (2-4 years) |
| Source: Mordor Intelligence | |||
Global Data-Privacy Regulations Tightening
Legislators worldwide are adopting comprehensive privacy statutes that escalate compliance obligations for brokers. By mid-2024, 20 U.S. states had enacted consumer-data laws modeled in part on the EU’s GDPR, and California’s Delete Act requires annual registration and streamlined deletion requests from every broker operating in the state. Federally, the Protecting Americans’ Data from Foreign Adversaries Act bans sales of sensitive personal information to China, Russia, Iran, and North Korea, compelling vendors to institute rigorous counterparty due-diligence programs. Penalties for non-compliance now reach multimillion-dollar levels, prompting firms to expand legal, cybersecurity, and data-governance headcounts, which trims operating margins and may slow product releases.
Consumer Shift to Privacy-Centric Tools and Ad Blockers
Users are adopting browser-based tracking-prevention features, mobile privacy prompts, and on-device ad filters that curtail passive data collection. Apple’s App Tracking Transparency and Google’s evolving Privacy Sandbox restrict the device-level identifiers that once powered deterministic targeting. These tools reduce the volume of behavioral impressions accessible to brokers and raise acquisition costs for substitute signals. Some brokers respond by forging consent-based partnerships or deploying privacy-preserving computation that allows pooled analysis without raw-data exposure. Others explore Web3 tokenization models that let individuals license their own data under smart-contract governance, though uptake remains nascent.
*Our forecasts treat driver/restraint impacts as directional, not additive. The impact forecasts reflect baseline growth, mix effects, and variable interactions.
Segment Analysis
By Data Type: Consumer Data Dominance Amid Location Intelligence Surge
The consumer-data category accounted for 46.03% of the data broker market in 2025. Retailers, banks, and media agencies depend on demographic, behavioral, and psychographic variables to personalize offers, improve cross-sell tactics, and measure campaign lift. Transaction records, loyalty-club enrollments, and streaming-content preferences feed propensity models that run directly within brand data warehouses. Brokers differentiate on breadth of coverage, refresh cadence, and integration ease. Location datasets, while smaller today, are projected to grow at a 13.68% CAGR, the highest among all data types. Foot-traffic overlays help chains evaluate store performance, while logistics platforms use geospatial coordinates to optimize route-planning and demand forecasting. The intersection of consumer attributes with precise latitude-longitude signals elevates insights on dwell time and path-to-purchase, reinforcing location data’s strategic importance.
Strong demand for privacy-safe enrichment also propels emerging types such as IoT sensor feeds and health metrics. These sources open fresh monetization avenues in smart-city planning, telematics insurance, and preventive-care management. As firms weigh strict consent requirements, brokers who can anonymize data at the edge gain competitive traction. Combined, the breadth of data types underlines that scaled, high-quality supply remains the core value proposition for the data broker market.


By End User: Marketing Agencies Lead While Healthcare Accelerates
Marketing and advertising agencies controlled 38.22% of overall 2025 demand, underscoring their pivotal role in orchestrating omnichannel engagement for brands. Agencies procure look-alike and custom segments to optimize creatives and media plans. They also rely on attribution feeds that connect exposure to sales outcomes, insights essential for return-on-ad-spend discussions with clients. The concentration of spend from global holding companies secures recurring revenue pools for leading brokers, making this customer group a reliable cash-flow engine.
Healthcare and life-sciences buyers, while smaller today, are expanding their share of the data broker market at a 14.34% CAGR through 2031. Pharmaceutical firms seek de-identified electronic-health-record extracts and real-world-evidence cohorts to reduce clinical-trial timelines and improve drug-response modeling. Hospitals combine wearables telemetry with brokered social-determinant indicators to stratify risk and tailor outreach. Compliance imperatives under HIPAA and GDPR raise data-handling standards, yet specialized brokers capable of tokenizing patient identifiers and applying differential-privacy algorithms stand to capture high-margin contracts.
By Data Acquisition Channel: Mobile Apps Dominate as Partnerships Expand
Mobile-application software-development kits contributed 35.74% of inbound data flows in 2025, reflecting the ubiquity of smartphones and the rich sensor payloads available—from accelerometer traces to granular GPS pings. In-app event streams are especially valuable for assembling interest graphs and real-time intent cues. Regulators’ scrutiny of location granularity motivates some publishers to throttle frequency, but the overall supply remains robust as long as end users grant opt-in consent.
Partnerships and licensing channels are forecast to climb at a 13.07% CAGR. Brand alliances, telco tie-ups, and financial-data consortia enable reciprocal data access without intrusive collection, spreading compliance risk among signatories. These agreements often include clean-room environments that support joint analytics while locking down raw-record movement. The shift illustrates how the data broker market evolves toward collaborative sourcing frameworks in response to rising privacy expectations.
By Delivery Mode: APIs Enable Real-Time Access While Cloud Marketplaces Transform Distribution
APIs and continuous feeds represented 41.17% of all deliveries in 2025, underlining market preference for streaming-ready pipelines that drop directly into customer decision engines. Credit-risk platforms, ad-tech bid routers, and fraud-scoring services rely on sub-second lookups to influence lending, pacing, or trust judgments. Brokers invest in low-latency microservices and auto-scaling infrastructure to meet strict service-level agreements.
Cloud-based marketplaces, though smaller today, will grow at a 14.12% CAGR. Consumption-based pricing appeals to buyers who want to test datasets before enterprise-wide deployment. Built-in identity-resolution tools inside the marketplaces shorten time-to-value for prospective customers. For brokers, the storefront model reduces sales-cycle lengths and delivers fine-grained telemetry on buyer preferences, informing future product-roadmap decisions.
Geography Analysis
North America provided 47.92% of 2025 revenue for the data broker market, supported by mature ad-tech stacks, deep payment-card penetration, and investor willingness to fund privacy-enhancing technologies. Experian reported 8% year-on-year revenue growth in fiscal 2024, while TransUnion achieved 12% organic constant-currency expansion in Q3 2024. These performances confirm sustained buyer appetite despite tighter regulatory oversight. Federal and state privacy actions, though impactful, have not derailed spending; rather, they shift budgets toward vendors with robust compliance tooling.
Europe operates under the stringent GDPR regime, which frames global best practices for consent, cross-border processing, and data-breach notification. Although requirements raise operational costs, they also create a competitive moat for brokers capable of demonstrating real-time deletion, audit logging, and purpose limitation. The region further influences policy through the Digital Markets Act and Digital Services Act, setting harmonized obligations for data intermediaries. Privacy-preserving synthetic data research enjoys strong academic-industry collaboration in Germany, France, and the Nordics, reinforcing Europe’s position as an innovation nucleus.
Asia-Pacific is the fastest-growing territory at a projected 13.41% CAGR, reflecting rapid smartphone adoption, surging e-commerce transactions, and government cloud-first mandates. India’s Digital Personal Data Protection Act, enacted in 2025, and China’s Personal Information Protection Law shape localized compliance checklists that multinational brokers must address. Domestic champions in Japan, South Korea, and Australia leverage their cultural and linguistic proximity to supply region-specific consumer insights. The resulting competitive intensity catalyzes product localization, pricing flexibility, and partnership-first entry strategies.

Competitive Landscape
The data broker market shows moderate consolidation. The top five vendors together control a significant share but still face meaningful competition from niche specialists. Experian, TransUnion, and Oracle defend their scale advantages by layering machine-learning-based data curation and deploying privacy-enhancing computing across their networks. Acquisition activity remains a key strategy: in June 2025, Publicis Group purchased Lotame, integrating 4 billion unique IDs into Epsilon’s environment. Experian followed by buying Audigent, securing premium publisher relationships and addressable inventory that mitigates cookie-loss risk.
Smaller providers differentiate through domain focus—for example, commerce data, B2B firmographics, or IoT telematics. Clean-room platform vendors partner with brokers to deliver neutral collaboration zones, strengthening brokers’ value propositions to privacy-sensitive clients. Barriers to entry include historical data depth, global consent-management systems, and sizable engineering investments for API reliability. Nonetheless, the shift to modular cloud-exchange models lowers distribution friction, enabling agile entrants to reach buyers without extensive direct-sales infrastructure.
Data Broker Industry Leaders
Acxiom LLC
Experian PLC
Equifax Inc.
Dun & Bradstreet Holdings, Inc.
Oracle Inc.
- *Disclaimer: Major Players sorted in no particular order

Recent Industry Developments
- January 2025: Experian launched its first-ever third-party data marketplace, broadening distribution options for external datasets and accelerating time to analytics for buyers.
- December 2024: Monda partnered with Nomad Data to expand visibility for data providers across investment management, consulting, and pharmaceutical sectors, connecting users to more than 3,500 suppliers.
- August 2024: ZoomInfo teamed with Google Cloud to deliver specialized datasets for generative-AI projects and earned TrustArc’s AI certification covering data-protection protocols.
- June 2024: Neudata collaborated with Shanghai Data Exchange to link international data vendors with over 1,000 Chinese buyers amid rising domestic demand.


Research Methodology Framework and Report Scope
Market Definition and Key Coverage
Our study defines the data broker market as the total revenue generated by firms that collect raw consumer, business, or public records, enrich them with analytics, and resell curated datasets or real-time feeds to external buyers for marketing, risk, or intelligence use cases.
Scope Exclusion: Internal first-party data platforms that only monetize insights inside their own parent organization are excluded.
Segmentation Overview
- By Data Type
- Consumer Data
- Demographic Data
- Behavioral Data
- Psychographic Data
- Location Data
- Business Data
- Firmographic Data
- Technographic Data
- Credit and Risk Data
- Government and Public Data
- Other Data Types (IoT-sensor, Health, etc.)
- Consumer Data
- By End User
- Marketing and Advertising Agencies
- Financial Services and Insurance
- Retail and E-commerce
- Healthcare and Life Sciences
- Government and Public Sector
- Telecommunications and IT
- Media and Entertainment
- Others
- By Data Acquisition Channel
- Online Tracking and Cookies
- Mobile Apps and SDKs
- Offline / Point-of-Sale Collection
- Public Records and Open Data
- Partnerships and Licensing
- By Delivery Mode
- APIs and Data Feeds
- Cloud-based Marketplaces
- Reports and Dashboards
- Custom Consulting and Managed Services
- By Geography
- North America
- United States
- Canada
- Mexico
- South America
- Brazil
- Argentina
- Rest of South America
- Europe
- United Kingdom
- Germany
- France
- Rest of Europe
- Asia-Pacific
- China
- India
- Japan
- Rest of Asia-Pacific
- Middle East and Africa
- Middle East
- Saudi Arabia
- United Arab Emirates
- Turkey
- Rest of Middle East
- Africa
- South Africa
- Nigeria
- Kenya
- Rest of Africa
- Middle East
- North America
Detailed Research Methodology and Data Validation
Primary Research
Mordor analysts interviewed privacy lawyers, ad-tech integrators, telco data product heads, and procurement managers across North America, Europe, and Asia. These conversations validated collection costs, typical transaction sizes, and emerging demand from healthcare and financial services clients, filling gaps that desk work alone could not bridge.
Desk Research
We began with public sources such as the US Federal Trade Commission, the European Data Protection Board, and the Japanese MIC guidelines, which clarify legal boundaries for secondary data sales. Trade groups like the Interactive Advertising Bureau and Global Data & Marketing Alliance offered spend benchmarks, while United Nations Comtrade and Volza shipment logs helped us track cross-border flows of marketing lists. Company 10-Ks, investor decks, and reputable press provided price points and recent merger activity.
Selective paid databases, including D&B Hoovers for financials and Dow Jones Factiva for deal news, enabled us to cross-check revenue splits and customer vertical exposure. This list is illustrative; many additional documents, statistics, and databases were also reviewed.
Market-Sizing & Forecasting
We applied a top-down model that starts with national digital ad spend, location data royalties, credit bureau revenues, and public record licensing fees, which are then adjusted for the share resold externally. Select bottom-up checks, sampled average selling price multiplied by dataset volumes reported by leading brokers, helped fine-tune totals. Key variables include privacy regulation intensity, mobile app opt-in rates, consumer online hours, enterprise AI adoption, and currency shifts. Forecasts draw on multivariate regression calibrated to those drivers and vetted with expert consensus.
Data Validation & Update Cycle
Outputs pass variance thresholds, peer review, and anomaly flags before sign-off. We refresh models each year, with interim updates triggered by major policy changes or landmark acquisitions, ensuring clients receive a current vantage point.
Why Mordor's Data Broker Baseline Inspires Confidence
Published estimates often disagree because firms vary in how they treat first-party monetization, regional price spreads, and gray-market file exchanges. Our disciplined scope, annual refresh, and mixed-method modeling keep results aligned with observable spending patterns.
Key gaps arise when other publishers oversimplify regulatory impact, extrapolate a single broker survey globally, or apply static average prices despite rapid compression in cookie-based data. We cross-verify every assumption with multi-region signals before numbers are released.
Benchmark comparison
| Market Size | Anonymized source | Primary gap driver |
|---|---|---|
| USD 294.27 Bn (2025) | Mordor Intelligence | - |
| USD 270.40 Bn (2024) | Regional Consultancy A | Limited to North American price benchmarks, no adjustment for EU GDPR drag |
| USD 323.10 Bn (2024) | Global Consultancy B | Broader scope includes in-house data reuse, inflating totals |
| USD 312.50 Bn (2025) | Industry Journal C | Forecast assumes flat opt-in rates, ignores rising browser restrictions |
The comparison shows that, while figures cluster, variances stem from definitional breadth and untested assumptions. Mordor's stepped validation and transparent driver set deliver a balanced, decision-ready baseline that stakeholders can trace back to clear variables and repeatable steps.


Key Questions Answered in the Report
What is the projected value of the data broker market by 2031?
The data broker market is expected to reach USD 448.32 billion by 2031, reflecting a 7.27% CAGR over the forecast period (2026-2031).
Which region is growing the fastest in the data broker market?
Asia-Pacific is forecast to grow at a 13.41% CAGR through 2031, driven by rapid digitalization and e-commerce expansion.
Why are cloud-based data marketplaces important for data brokers?
Cloud marketplaces reduce integration times, offer consumption-based pricing, and give brokers instant global reach, making them the fastest-growing delivery mode at a 14.12% CAGR.
How do privacy regulations affect data brokers?
New laws such as California’s Delete Act and the U.S. federal ban on sales to foreign adversaries increase compliance costs, potentially subtracting 1.9 percentage points from forecast CAGR.
Page last updated on:


