
Data Catalog Market Size and Share
Market Overview
| Study Period | 2020 - 2031 |
|---|---|
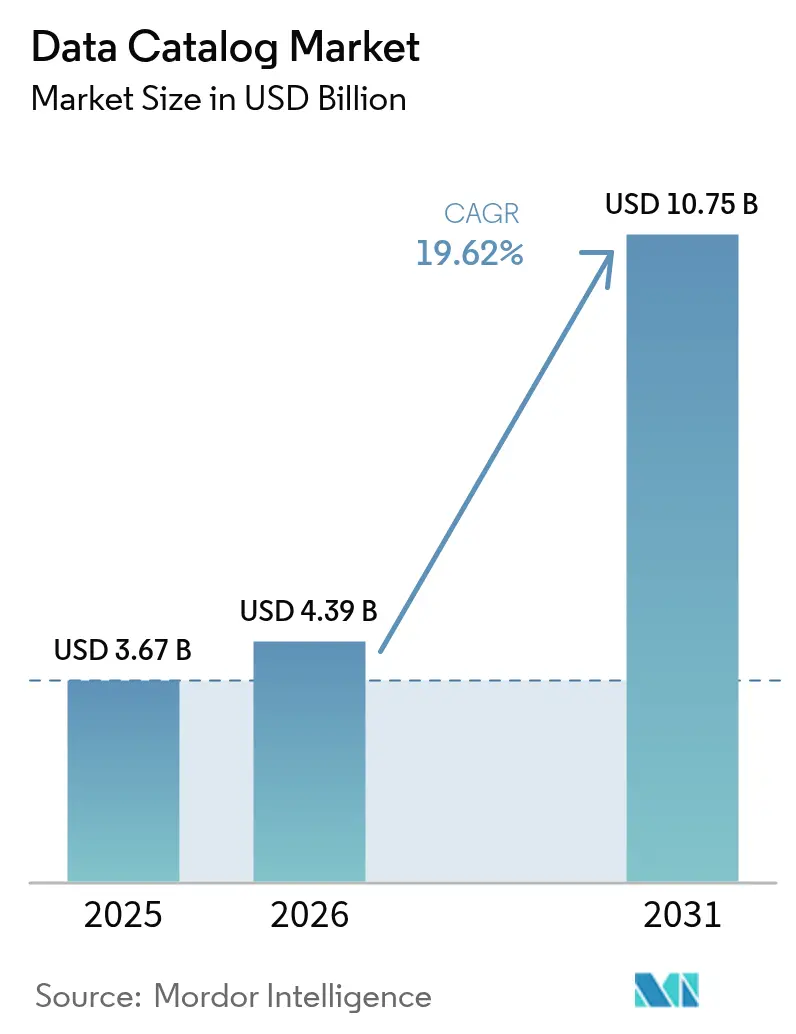
| Market Size (2026) | USD 4.39 Billion |
| Market Size (2031) | USD 10.75 Billion |
| Growth Rate (2026 - 2031) | 19.62 % |
| Fastest Growing Market | Asia Pacific |
| Largest Market | North America |
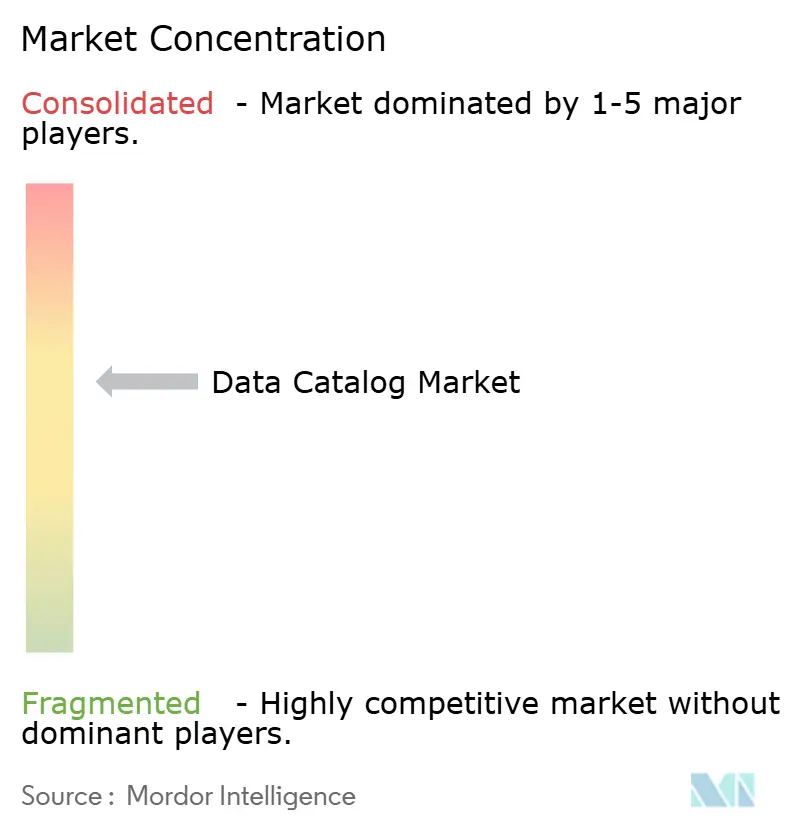
| Market Concentration | Medium |
Major Players *Disclaimer: Major Players sorted in no particular order Image © Mordor Intelligence. Reuse requires attribution under CC BY 4.0. | |
Data Catalog Market Analysis by Mordor Intelligence
The Data Catalog Market size is expected to grow from USD 3.67 billion in 2025 to USD 4.39 billion in 2026 and is forecast to reach USD 10.75 billion by 2031 at 19.62% CAGR over 2026-2031.
Demand is propelled by cloud deployment, tighter regulatory oversight, and the need to support enterprise AI workloads with trusted, well-governed data. Vendors now deliver automated discovery, lineage, and quality checks that shorten implementation cycles, while the rapid pivot to cloud-native catalogs allows value realization in weeks instead of months. Generative AI is reshaping catalog functionality, shifting platforms from passive metadata stores to intelligent systems that enrich, classify, and secure information with limited manual effort. Competitive intensity is rising as large platform vendors integrate catalog features directly into broader data and analytics suites, forcing niche providers to innovate around time-to-value, industry depth, and AI enablement.
Key Report Takeaways
- By component, solutions led with 71.78% revenue share in 2025; services are projected to expand at a 24.96% CAGR through 2031.
- By deployment mode, the cloud segment held 80.55% of the data catalog market share in 2025, while the on-premise segment is set to post a 21.9% CAGR as hybrid demand persists.
- By end-user industry, BFSI captured 24.73% of the data catalog market size in 2025; healthcare is expected to grow at 22.46% CAGR to 2031.
- By organization size, large enterprises accounted for 62.35% share of the data catalog market in 2025, whereas SMEs are forecast to rise at a 25.58% CAGR through 2031.
- By geography, North America held 41.62% of the data catalog market share in 2025; Asia-Pacific is advancing at a 23.62% CAGR between 2026 and 2031.
Note: Market size and forecast figures in this report are generated using Mordor Intelligence’s proprietary estimation framework, updated with the latest available data and insights as of 2026.
Market Trends and Insights
Drivers Impact Analysis of Data Catalog Market*
| Driver | (~) % Impact on CAGR Forecast | Geographic Relevance | Impact Timeline |
|---|---|---|---|
| Cloud-based catalog adoption surge | +5.8% | Global; higher impact in North America and Europe | Short term (≤ 2 years) |
| Data-volume explosion and complexity | +4.3% | Global | Medium term (2-4 years) |
| Regulatory compliance mandates | +3.5% | North America, Europe, rising in Asia-Pacific | Medium term (2-4 years) |
| Generative-AI metadata enrichment | +2.7% | North America, Europe, advanced Asian markets | Medium term (2-4 years) |
| Data-mesh architecture proliferation | +2.0% | Global; higher in technology and financial sectors | Long term (≥ 4 years) |
| Open-source metadata standards | +1.5% | Global | Long term (≥ 4 years) |
| Source: Mordor Intelligence | |||


Cloud-based catalog adoption surge
Cloud deployment now underpins 81.2% of implementations, reducing infrastructure overhead and speeding roll-outs to days instead of months. Distributed workforces rely on cloud catalogs for consistent access to governed data, and usage-based pricing introduced by Microsoft Purview in January 2025 aligns costs to asset volume. [1]Microsoft Corporation, “Billing in Microsoft Purview Data Governance,” microsoft.com Cloud ecosystems also simplify integrations, allowing enterprises to connect diverse data stores while applying uniform policies. As analytics workloads migrate to public clouds at scale, demand for cloud-native catalogs will keep rising, fueling vendor innovation around elasticity, security, and cross-platform lineage.
Data-volume explosion and complexity
By 2025, unstructured information is projected to account for 80% of global data, forcing organizations to move beyond manual tagging toward automated discovery. [2]IBM Corporation, “Extracting insights from complex, unstructured big data,” ibm.com Data lakes capture varied content, yet without a catalog, users struggle to locate reliable assets. Effective discovery cuts time-to-insight by up to 40% and improves conversion in customer applications. Healthcare providers deploy solutions such as IQVIA Health Data Catalog to profile more than 3,700 assets through a single portal. [3]IQVIA, “Analytics Research Accelerator: Health Data Catalog,” iqvia.com As variety and velocity accelerate, catalogs able to span structured and unstructured sources become strategic differentiators.
Regulatory compliance mandates
Financial institutions comply with BCBS 239 by standardizing risk taxonomies and tracking lineage through catalogs. [4]OvalEdge, “BCBS 239 Compliance Through Practical Data Governance,” ovaledge.com Beyond banking, data privacy rules in Europe and emerging Asia-Pacific markets compel automated classification of sensitive fields. Catalog platforms now embed policy workflows, cutting manual compliance tasks and raising data quality. With AI governance frameworks on the horizon, catalogs increasingly serve as evidence of responsible data stewardship.
Generative-AI metadata enrichment
Large language models generate column descriptions, detect semantic similarities, and recommend quality rules, trimming curation workloads that once consumed scarce expert time. Microsoft embeds Copilot into Purview, guiding users through policy application while enriching metadata in the background. As models advance, the loop tightens: catalogs provide trusted inputs to AI, and AI returns enriched context that deepens catalog value.
Restraints Impact Analysis of Data Catalog Market*
| Restraint | (~) % Impact on CAGR Forecast | Geographic Relevance | Impact Timeline |
|---|---|---|---|
| Standardization and security gaps | -2.8% | Global | Medium term (2-4 years) |
| Talent shortage in metadata mgmt | -1.9% | Global; higher in emerging markets | Medium term (2-4 years) |
| Catalog curation cost burden | -1.6% | Global; higher impact on SMEs | Short term (≤ 2 years) |
| Vendor lock-in via proprietary models | -1.3% | Global | Long term (≥ 4 years) |
| Source: Mordor Intelligence | |||
Standardization and security gaps
Inconsistent metadata models hamper interoperability, especially in healthcare, where differing clinical vocabularies lead to misinterpretation. Biomedical projects adopt frameworks such as DATS to encode diverse datasets, yet fragmentation persists. Security layers also vary across data sources, making it hard to enforce unified access through the catalog. Regional divergence in Asia-Pacific regulations risks data balkanization that could slow cross-border analytics.
Talent shortage in metadata management
Sixty percent of data professionals cite limited skills as the leading barrier to AI success, and 42% see it as their top data quality challenge. Healthcare providers report pronounced gaps that delay governance programs. Automation helps, but human expertise still defines business context and ownership. Enterprises respond with managed services and internal training, yet supply lags demand, restraining near-term growth.
*Our forecasts treat driver/restraint impacts as directional, not additive. The impact forecasts reflect baseline growth, mix effects, and variable interactions.
Data Catalog Market Segment Analysis
By Component:
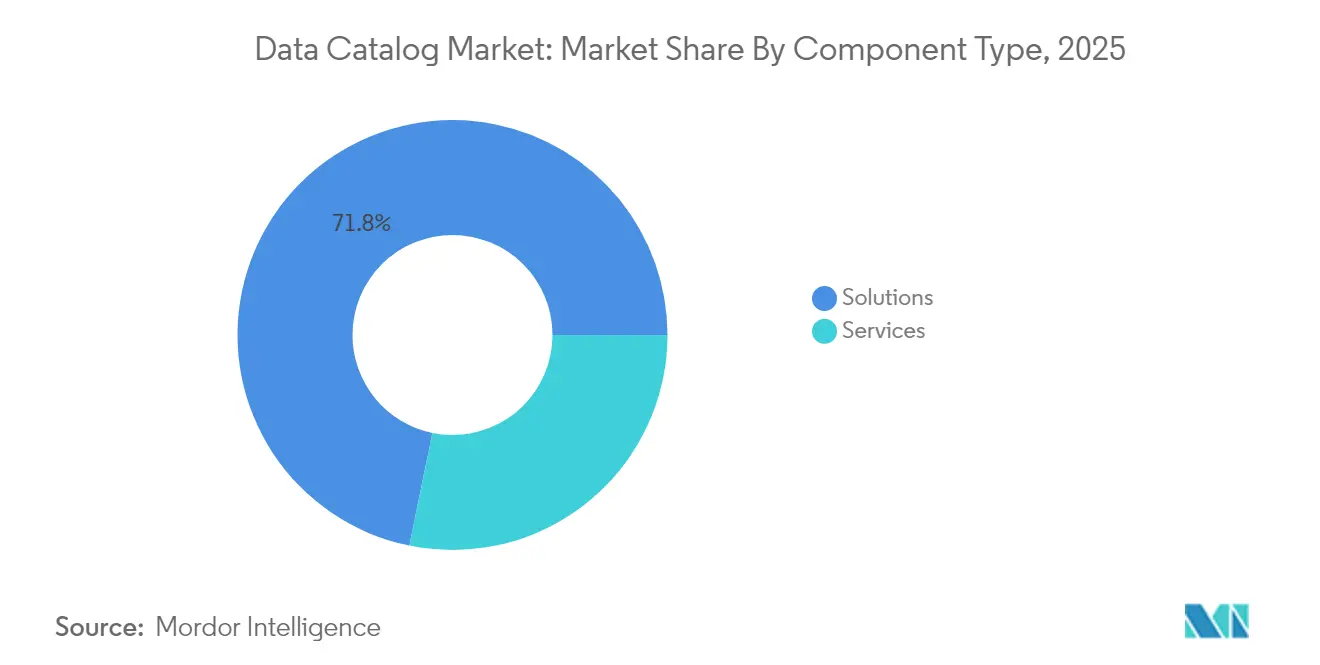
Solutions Drive Strategic InvestmentsSolutions accounted for 71.78% of 2025 revenue, confirming their role as the backbone of enterprise discovery and governance. Vendors now deliver automated lineage, AI-assisted enrichment, and granular policy enforcement through single interfaces that scan heterogeneous stores. This functionality positions solutions as the first stop in modernization programs, anchoring broader data intelligence strategies. At the same time, the services segment is expanding at 24.96% CAGR as enterprises seek guidance on operating models, policy design, and change management. Many engagements develop federated governance structures that distribute accountability while retaining global standards.
Across both segments, enterprises prioritize tight integration. Microsoft Purview’s reference architecture encourages the definition of governance domains before scan configuration, highlighting the process maturity required for success. Service providers craft accelerators that codify best practices, reducing risk for first-time deployments. As solutions evolve into platforms and vendors wrap advisory and managed services around them, the traditional boundary between product and service blurs. This blend supports rapid adoption while ensuring organizations extract measurable value, sustaining long-term momentum for the data catalog market.


By Deployment Mode:
Cloud Dominance Accelerates InnovationCloud captured 80.55% share in 2025 and is forecast to rise at 23.85% CAGR, reflecting advantages in elastic scale and rapid provisioning. Consumption models let teams start small and expand as asset counts grow, aligning spend to value delivered. Microsoft’s pay-as-you-go tariff, adopted in 2025, exemplifies this shift, charging only for unique governed assets and quality metrics. Cloud deployment also delivers automatic feature updates, shortening innovation cycles and ensuring immediate access to AI-driven enhancements.
Despite cloud momentum, on-premise catalogs remain important in sectors with strict data residency or legacy mainframe workloads. These organizations increasingly favor hybrid patterns, scanning sensitive stores in place while centralizing metadata in a secure cloud hub. Vendors respond with private-link connectivity and role-based access controls that enforce consistent policy regardless of location. This balance between agility and sovereignty sustains a diversified deployment landscape and broadens addressable demand for the data catalog market.
By End-user Industry:
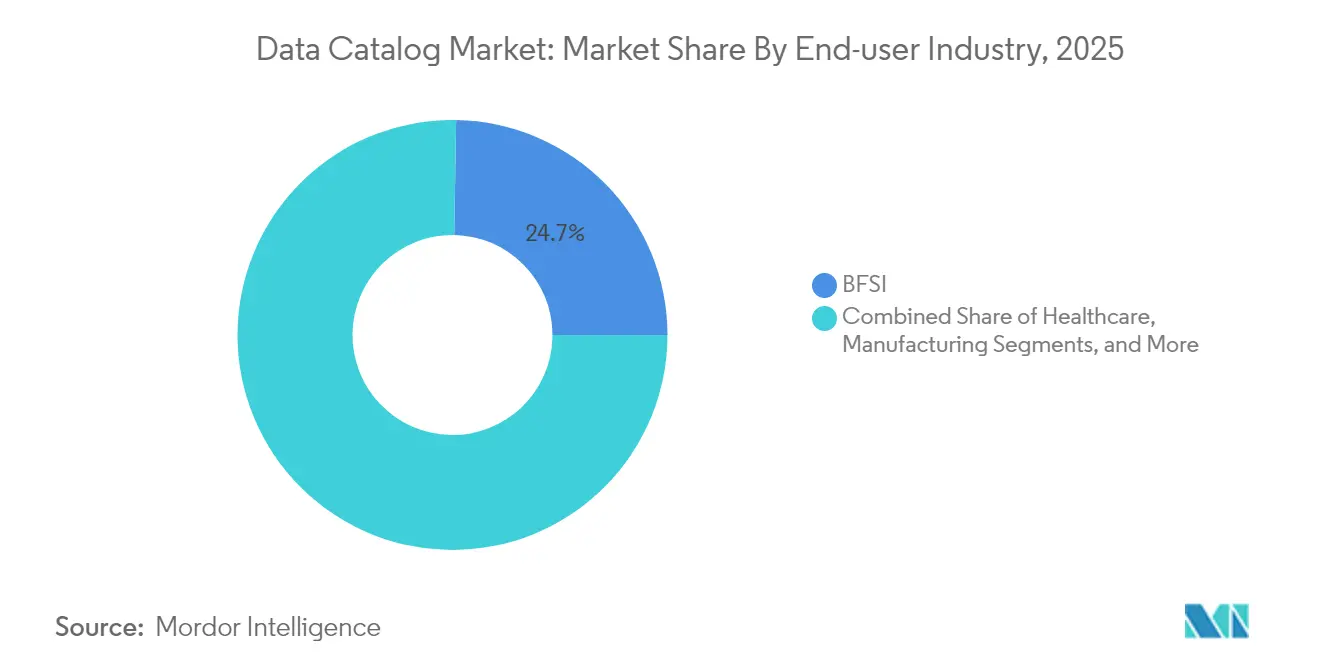
BFSI Leads While Healthcare AcceleratesBFSI led with a 24.73% share in 2025, leveraging catalogs to align with BCBS 239 and other capital adequacy mandates. A Swiss bank trimmed search time to under one second after rolling out a cross-domain catalog that links documents and data assets, boosting end-user satisfaction to 97%. Financial firms also harness lineage to support model risk management, tracing outputs back to approved data sources and reducing audit effort. These use cases keep BFSI investment high, anchoring revenue for the data catalog market.
Healthcare, growing at 22.46% CAGR, uses catalogs to apply FAIR principles and enhance research reproducibility. The Translational Data Catalog surfaces biomedical datasets for secondary analysis, expanding the value of funded studies. Providers integrate clinical, imaging, and genomic data to personalize treatment while safeguarding patient privacy. Similar gains appear in retail, manufacturing, and telecom, where catalogs unify customer journeys, trace supply chains, and manage network telemetry. This sectoral diversity underlines the universal relevance of trusted, findable data.
By Organization Size:
Large Enterprises Dominate While SMEs AccelerateLarge enterprises held a 62.35% share in 2025 as sprawling data estates mandate robust governance. These firms adopt federated models that assign stewardship to domains while enforcing global standards through centralized workflow engines, mirroring guidelines published for Microsoft Purview deployments. Scale drives investment not only in software but also in operating processes, making large enterprises the core revenue base for vendors.
SMEs represent the fastest-growing cohort at 25.58% CAGR, empowered by cloud catalogs that remove upfront infrastructure cost. Pay-as-you-go pricing lowers entry barriers, while managed services fill skill gaps. SMEs typically target high-impact use cases such as privacy compliance or customer segmentation before expanding scope. As offerings mature and automation intensifies, catalog adoption within mid-market firms will further broaden the data catalog market size across all regions.
Geography Analysis
North America Data Catalog Market
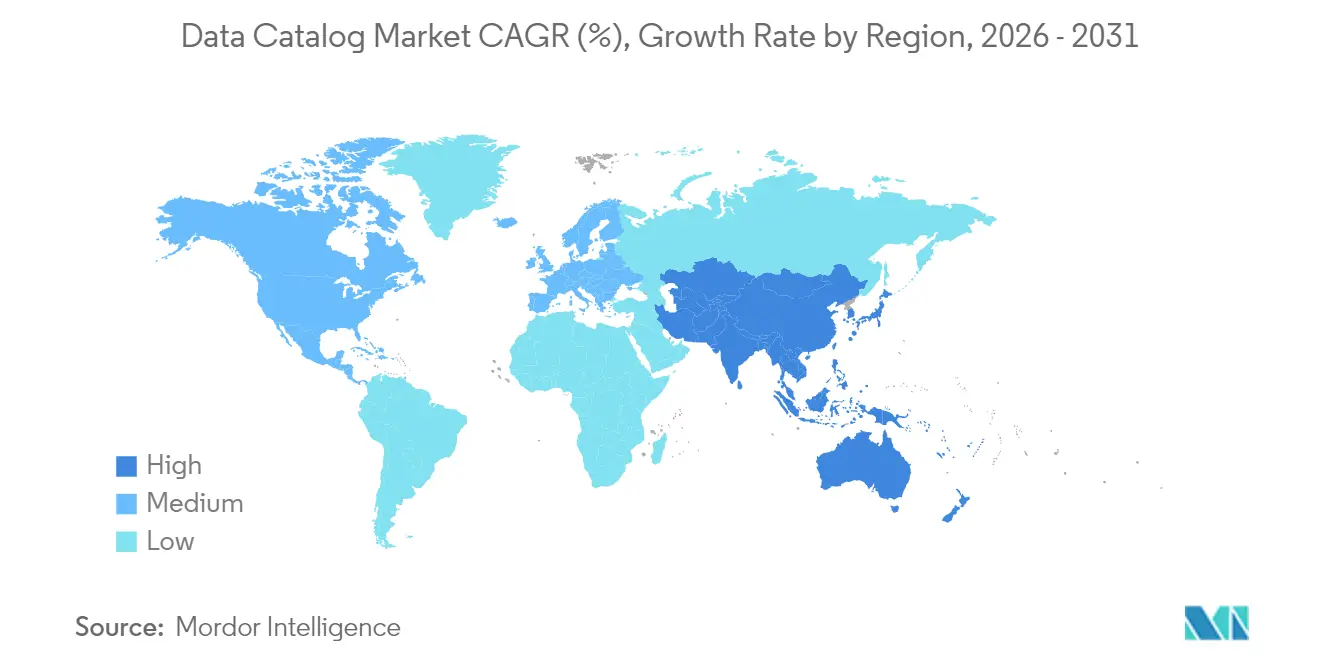
North America retained leadership with a 41.62% share in 2025, supported by mature cloud infrastructure, advanced AI adoption, and stringent industry regulations. Enterprises in the United States integrate generative models into catalogs to automate profiling and improve lineage, addressing quality concerns reported by 46% of data practitioners. Canada follows similar trajectories in financial services and healthcare, while Mexico’s fast-growing fintech sector spurs new deployments. Regional buyers favor solutions that pair deep compliance tooling with open connectivity, a profile that continues to shape vendor roadmaps.
APAC Data Catalog Market
Asia-Pacific is the fastest-expanding arena, growing at 23.62% CAGR through 2031. China, India, and Japan top AI investment rankings, prompting higher spending on robust data foundations. Governments tighten privacy and sovereignty rules, driving demand for tools that locate, classify, and tokenize personal data at rest and in motion. Challenges arise from fragmented policy landscapes and uneven skill availability, yet flexible architectures and managed services help enterprises keep pace. Local deployments increasingly blend global best practices with country-specific encryption and residency controls.
EMEA and South America Data Catalog Market
Europe advances on the back of GDPR-aligned governance. Data catalogs automate the detection of sensitive fields and record data lineage, letting firms demonstrate accountability under evolving AI rules. Industries in Germany and France extend catalog scope to supply-chain data for sustainability reporting. The Middle East and Africa see accelerated uptake from a small base, leveraging cloud to bypass legacy constraints. South America’s digital initiatives, particularly in Brazil, extend catalog coverage to e-commerce and energy assets. Across regions, the common thread remains a need for transparent, policy-driven access that underpins both operational reporting and AI innovation, widening the data catalog market size globally.

Regulatory Landscape
Regulation is increasingly codifying catalog-like capabilities (inventory, metadata standardization, lineage, and controls evidence) across the public sector, financial services, and AI governance. In the United States, 44 USC 3511 requires federal agencies to maintain comprehensive data inventories and submit public data assets to the Federal Data Catalog using OMB-approved metadata schemas, reinforced by OMB Memorandum M-25-05 (January 2025) on open government data access and management. Standards such as DCAT-US v3.0 (aligned to W3C DCAT v3) and NIST OSCAL control catalog models support machine-readable metadata and control mapping used in compliance and audit workflows.
In Europe, Regulation (EU) 2024/1689 (EU AI Act) introduces explicit data governance requirements for high-risk AI systems, including dataset governance and documentation under Article 10. Key obligations for general-purpose AI providers take effect from August 2025, while the broader framework applies from August 2, 2026. Alongside this, ETSI EN 304 199 defines a data catalogue implementation framework for European data spaces, strengthening interoperability and compliance with data space agreements. This, in turn, raises the importance of standardized metadata exchange and governance processes in cross-organization sharing use cases.
Value Chain Analysis
The value chain starts with data sources and platforms (data warehouses and lakehouses, operational applications, streaming systems, and unstructured repositories) feeding metadata via scanners, connectors, and APIs into catalog solutions. Core catalog vendors and suite providers, including Microsoft Purview within Azure and Fabric, IBM data governance capabilities within watsonx, and specialists such as Collibra, Informatica, and Alation, deliver discovery, lineage, classification, and policy workflows. Implementation and managed service partners configure governance operating models (domain stewardship, RBAC/ABAC, retention, and audit evidence), integrate with IAM and data quality or observability tools, and manage change so business users adopt self-service discovery.
Downstream, consumption occurs in analytics, data science, and AI workloads where trusted, governed assets are required, and increasingly in data products for data mesh and data fabric programs. Partnerships and ecosystem integrations are a defining value-chain lever, as enterprises connect third-party master data and metadata layers into operational stacks rather than consolidating everything in-house. Examples in 2026 include Blue Yonder partnering with Syndigo to link product information capabilities into supply chain execution and Cloudera partnering with Vast Data to address data-delivery bottlenecks that can starve GPUs in AI environments. Open-source projects such as DataHub and OpenMetadata also shape the ecosystem by expanding connector coverage and metadata interoperability, although enterprise adoption often depends on supportability, security, and compliance readiness.
Competitive Landscape
The market shows moderate concentration as platform giants and focused specialists vie for influence. Microsoft integrates Purview tightly with Azure and Fabric, offering unified asset discovery across databases, storage, and analytics services. IBM enriches Watsonx with an Agent Catalog comprising more than 150 tools that connect hybrid environments, strengthening its position in AI-driven governance. Salesforce’s USD 8 billion purchase of Informatica in 2025 bundles catalog, integration, and Data Cloud, signaling convergence between operational applications and governance backbones.
Pure-play vendors such as Alation and Collibra compete on agility and user experience, delivering rapid deployment and domain-specific accelerators that appeal to business stewards. They differentiate through open connectors and partnership ecosystems, addressing concerns about vendor lock-in. Open-source initiatives gain visibility but face hurdles in enterprise support and compliance certifications. Vertical specialists carve niches in healthcare and financial services, embedding regulatory logic out of the box.
Strategic themes include embedding generative AI, widening API coverage, and simplifying role-based policy management. Buyers increasingly ask for catalog services that integrate quality monitoring, observability, and cost tracking across multi-cloud estates. Vendors able to span these requirements without compromising performance or governance rigor are positioned to outpace slower competitors and expand their share of the data catalog market.
Data Catalog Industry Leaders
Collibra NV
IBM Corporation
Microsoft Corporation
Informatica Inc.
Alation Inc.
- *Disclaimer: Major Players sorted in no particular order
Data Catalog Market Companies Covered in this Report
- Collibra NV
- IBM Corporation
- Microsoft Corporation
- Informatica Inc.
- Alation Inc.
- Amazon Web Services, Inc.
- Google LLC
- Oracle Corporation
- SAP SE
- TIBCO Software Inc.
- Atlan Pte Ltd.
- data.world, Inc.
- Zaloni, Inc.
- Hitachi Vantara LLC
- Talend (Snowflake)
- MANTA Software
- DataGalaxy SAS
- Alex Solutions
- Precisely Holdings
- Cloudera (Apache Atlas)
- Erwin Data Intelligence
- Databricks Unity Catalog
- Elastic (Elastic Search Data Catalog)
- OpenMetadata (LF AI & Data)
- Micro Focus Voltage

Market Opportunities and Future Outlook
A major opportunity is cataloging as an AI control plane, where enterprises attach governance requirements directly to data objects used for training, validation, and inference, and operationalize evidence for audits. The EU AI Act (Regulation (EU) 2024/1689) raises dataset governance and documentation requirements for high-risk AI systems, strengthening the business case for automated metadata harvesting, lineage, and policy workflows embedded in catalogs. In regulated industries such as BFSI, ongoing compliance programs, including BCBS 239 alignment cited by banking users, continue to favor catalogs that can standardize taxonomies and provide end-to-end traceability across hybrid estates.
A second opportunity sits in interoperability and data-sharing ecosystems, where standardized metadata exchange becomes a prerequisite for multi-party data spaces and cross-platform governance. ETSI EN 304 199 provides a concrete framework for data catalog implementation within European data spaces, while DCAT-aligned approaches, including DCAT-US v3.0 and W3C DCAT v3, support structured publication and discovery patterns. On the technology side, open-source momentum, including DataHub, OpenMetadata, and emerging metadata-lake approaches such as Apache Gravitino, creates whitespace for vendors and service providers to package enterprise-grade deployments, connectors, and operating models. This is particularly relevant for SMEs adopting cloud catalogs under consumption pricing and for organizations pursuing data mesh or data fabric programs that need product-level discovery, ownership, and observability.
Recent Industry Developments in Data Catalog Market
- April 2026: Google Cloud and Collibra expanded their partnership, adding bi-directional integration so Collibra-governed metadata can be pushed into Google Cloud Knowledge Catalog within the Dataplex environment. The update tightens governance coverage across cloud-native data estates and reduces friction between stewardship workflows and platform-level discovery.
- March 2026: IBM completed its acquisition of Confluent for about USD 11 billion to combine high-scale event streaming with IBM MQ and webMethods Hybrid Integration into a smart data platform for enterprise AI and agents. This expands real-time data foundation capabilities that support governed discovery, lineage, and policy enforcement in catalog-centric operating models.
- July 2024: Microsoft announced Microsoft Purview Data Governance would be generally available on September 1, 2024, broadening access to governed data discovery and stewardship workflows within the Purview portfolio. The GA timeline gave enterprises a basis to formalize governance operating models ahead of expanded AI usage and broader catalog rollouts.


Data Catalog Market Report Scope and Research Methodology
Market Definition and Coverage
This market covers revenue earned from enterprise data catalog offerings that help organizations find, understand, trust, and govern data by managing metadata, lineage, and business terms across cloud and on-premises environments.
Scope exclusions: We exclude basic file or media catalog tools and simple tagging utilities that do not provide enterprise metadata management, lineage, and policy based governance features.
Segments Covered in This Report
- By Component
- Solutions
- Services
- By Deployment Mode
- Cloud
- On-Premise
- By End-user Industry
- BFSI
- Retail and E-commerce
- Healthcare
- Manufacturing
- Telecommunications
- Other End-user Industries
- By Organization Size
- Large Enterprises
- Small and Mid-size Enterprises
- By Geography
- North America
- United States
- Canada
- Mexico
- South America
- Brazil
- Argentina
- Chile
- Rest of South America
- Europe
- Germany
- United Kingdom
- France
- Italy
- Spain
- Russia
- Rest of Europe
- Asia-Pacific
- China
- Japan
- India
- South Korea
- Singapore
- Malaysia
- Australia
- Rest of Asia-Pacific
- Middle East and Africa
- Middle East
- Saudi Arabia
- United Arab Emirates
- Turkey
- Rest of Middle East
- Africa
- South Africa
- Nigeria
- Rest of Africa
- Middle East
- North America
Data Sources, Market Sizing, and Validation
Desk Research
Desk research helped us set the market boundary and establish initial assumptions on adoption and spending patterns. We used public and official sources such as NIST publications on data management, ISO standards that are referenced in governance programs, and guidance from national cybersecurity agencies that shape data handling expectations. We also reviewed datasets and publications from bodies such as the OECD and the World Bank to understand digitalization, cloud readiness, and IT spend direction by region.
To translate the scope into numbers, we referenced company filings, investor presentations, product documentation, and trusted press coverage to identify how data catalog capabilities are packaged and priced, particularly when bundled with broader data management platforms. Where needed, we used approved paid subscriptions for company financials and intelligence, news and financials screening, patent databases, and global contracts and tenders signals to cross-check vendor focus areas and demand visibility. The sources listed here are illustrative, and many other public and paid references were also used for data collection, validation, and clarification.
Primary Interviews and Surveys
Primary work focused on converting desk assumptions into realistic purchase and usage patterns, including how buyers define a true data catalog versus adjacent governance or data quality tools. We spoke with users and budget owners from large enterprises and mid-sized firms, and also with solution implementers and channel partners across APAC, EMEA, and the Americas, so gaps around deployment mix, services attachment, and pricing were reduced before finalizing the model.
Distribution of primary research fieldwork respondents
| Company type | Respondent position | Region |
|---|---|---|
| Top tier: 29% | CXOs: 13% | APAC: 49% |
| Mid tier: 56% | Functional/Unit leaders: 30% | EMEA: 30% |
| Smaller Players: 15% | Managers: 57% | Americas: 21% |
Market-Sizing & Forecasting
Sizing started with a top-down build that reconstructs the addressable spend pool for data cataloging by linking enterprise data management budgets to observable adoption of governance programs and cloud data platforms, and then applying penetration rates for catalog capabilities. The totals were then corroborated with selective bottom-up approximations, where we sampled vendor price ranges, typical seat or consumption drivers, and services attachment levels, and then checked the roll-up against the top-down result.
In this market, we tracked a few practical drivers: the share of workloads running in cloud versus on-premises, the growth of data governance teams, the frequency of regulatory driven cataloging needs, typical deployment scale by enterprise size, and services intensity for implementation, integration, and ongoing stewardship. When bottom-up visibility was incomplete, for example when revenue is reported inside a broader data platform line item, we used proxy splits informed by interview feedback and product packaging evidence, and then stress-tested the split across regions.
For forecasting, we relied on scenario analysis supported by variable level trends. The scenarios were tuned using expert expectations on cloud migration pace, metadata automation adoption, and procurement cycles. This kept the forecast practical, since each driver can be updated annually as new public signals and fresh interview feedback come in.
Data Validation & Update Cycle
Validation was handled through multiple checks so the final numbers do not rely on a single assumption. We compared outputs against independent signals such as vendor hiring focus, product release cadence linked to governance features, and regional enterprise software spending direction, and then investigated any sharp deviations before sign-off.
Before publication, the model is reviewed in steps by another analyst, and follow-up calls are triggered when a key input moves outside a reasonable range, for example a sudden pricing shift, a large deployment change, or a new regulatory requirement that alters services demand. Reports are refreshed annually, with interim updates when material events occur, and a final pre-delivery pass is completed so clients receive the latest view.
Mordor Intelligence's Data Catalog Market Estimate Compared With Other Published Estimates
Published market sizes for data catalogs can vary a lot because researchers do not always count the same products, the same revenue types, or the same year timing. Differences also come from how services are treated, how cloud subscription revenue is annualized, and whether adjacent governance tools are included.
Key gap drivers in this market usually show up in three places, which the table makes easier to see: whether only software is counted or software plus services, whether catalogs embedded in broader platforms are fully included, and how pricing progression is assumed across cloud deployments. The benchmark table shows a higher 2026 value, and in Mordor Intelligence's model the scope counts data catalog solutions together with related implementation and managed services only when they are directly tied to catalog deployment and ongoing metadata stewardship.
Benchmark comparison
| Source | Market Size | Gaps in Research Methodology |
|---|---|---|
| Mordor Intelligence | USD 4.39 B (2026) | |
| Global Consultancy A | USD 2.64 B (2025) | Often treats the market as software-only and may exclude implementation and managed services revenue, which reduces the total even when deployments are active. |
| Trade Journal B | USD 1.38 B (2025) | Typically uses a narrower vendor set and relies on headline announcements, which can undercount embedded catalog capabilities and subscription annualization for cloud offerings. |
Looking across the three figures, most of the spread can be traced to scope and revenue recognition choices rather than disagreement on demand direction. By tying inclusions to clear product functionality and counting services only when they are attached to catalog work, the final total stays transparent and can be re-created when the same inputs are refreshed.


Key Questions Answered in the Report
What is driving the rapid growth of the data catalog market in 2026?
Growth is fueled by cloud deployment, tighter regulatory mandates and the need to supply AI models with trusted data, resulting in a 19.62% CAGR outlook.
How large is the data catalog market size today?
The data catalog market size stands at USD 4.39 billion in 2026 and is projected to reach USD 10.75 billion by 2031.
Which region leads the data catalog market share?
North America holds the largest data catalog market share at 41.62% in 2025, supported by mature cloud infrastructure and strict compliance requirements.
Which deployment mode dominates current implementations?
Cloud deployment commands 80.55% of live catalogs, with pay-as-you-go pricing accelerating adoption among organizations of all sizes.
Why are data catalogs important for AI initiatives?
Catalogs supply AI teams with governed, high-quality data, while generative capabilities within catalogs automate enrichment and cut manual curation effort.
What are the main challenges limiting adoption?
Metadata skill shortages, inconsistent security standards and concerns over vendor lock-in are the leading restraints, collectively shaving around 5.6% from forecast CAGR.
Page last updated on:


 Your data is secure and never sold or shared.


