Data Science Platform Market Size and Share
Market Overview
| Study Period | 2020 - 2031 |
|---|---|
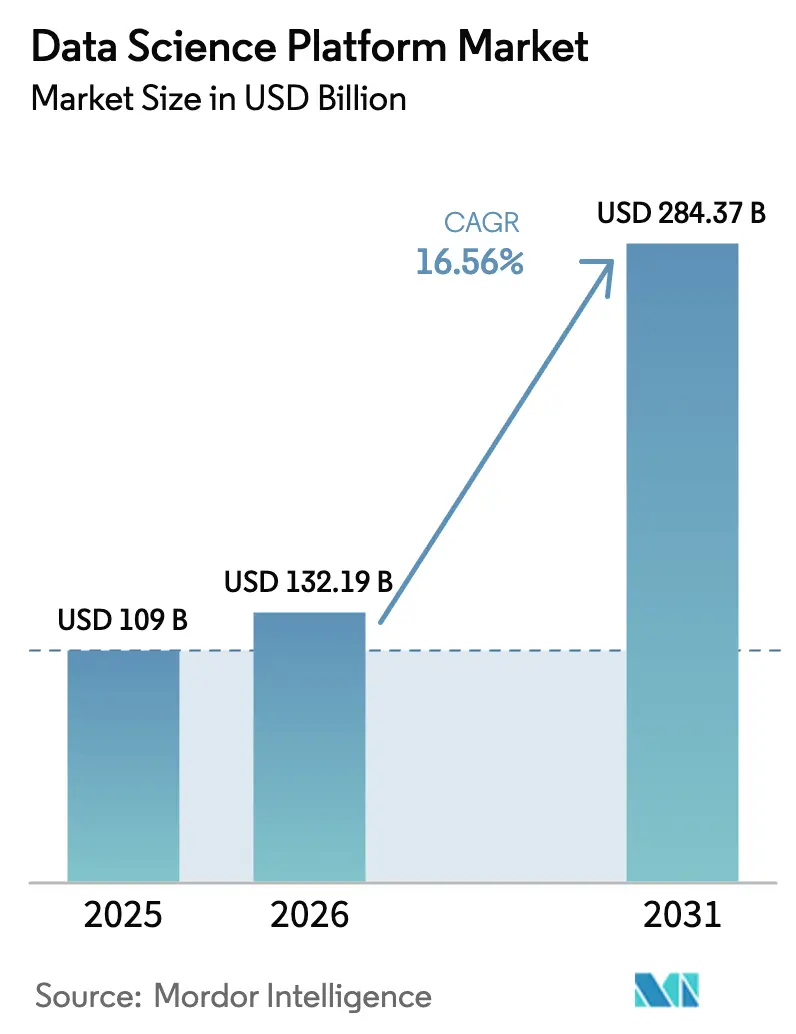
| Market Size (2026) | USD 132.19 Billion |
| Market Size (2031) | USD 284.37 Billion |
| Growth Rate (2026 - 2031) | 16.56% CAGR |
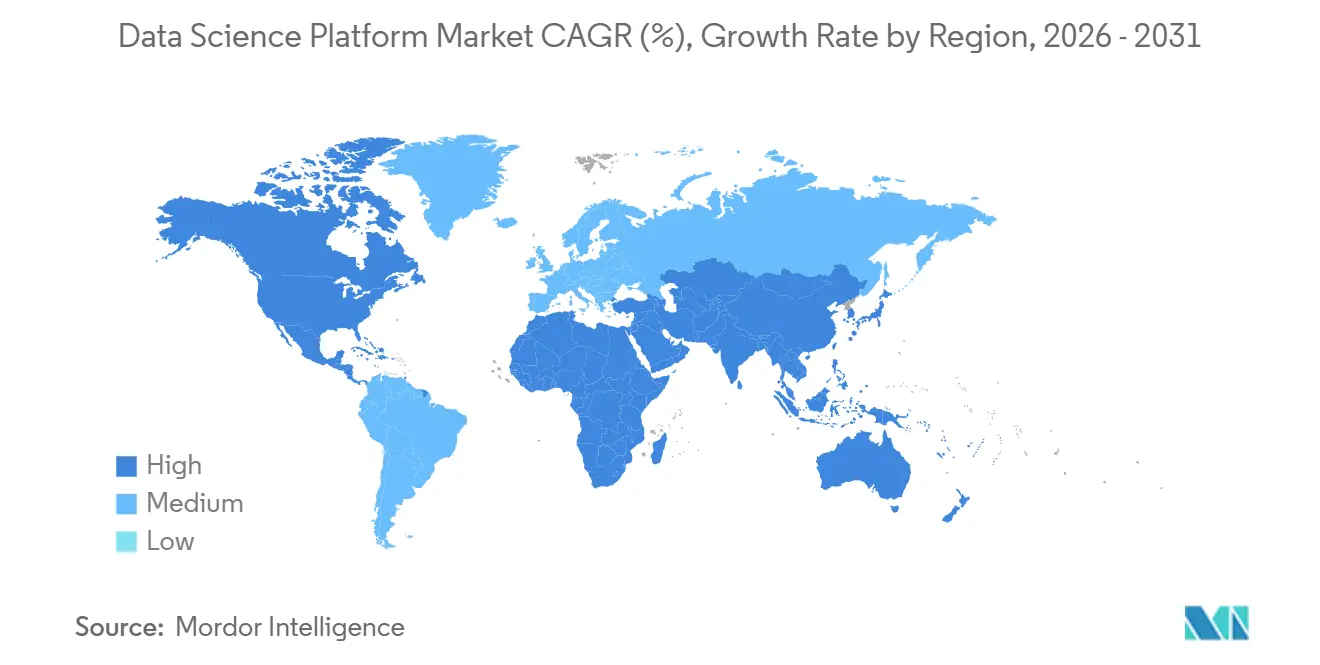
| Fastest Growing Market | Asia Pacific |
| Largest Market | North America |
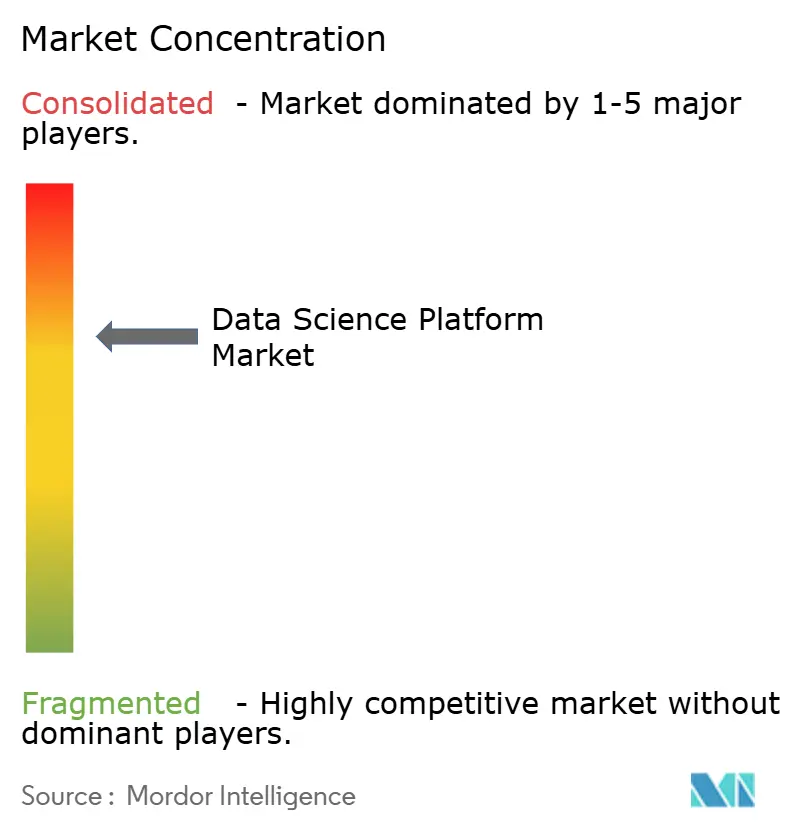
| Market Concentration | Medium |
Major Players *Disclaimer: Major Players sorted in no particular order Image © Mordor Intelligence. Reuse requires attribution under CC BY 4.0. | |
Data Science Platform Market Analysis by Mordor Intelligence
The Data Science Platform Market size is expected to increase from USD 109 billion in 2025 to USD 132.19 billion in 2026 and reach USD 284.37 billion by 2031, growing at a CAGR of 16.56% over 2026-2031.
Steady growth is unfolding as enterprises shift from isolated machine-learning pilots toward production systems that integrate data ingestion, model training, governance, and edge inference. Integrated toolchains promise faster time-to-value, while hyperscalers bundle advanced functionality into existing cloud contracts, compressing margins for niche vendors. Meanwhile, domain-specific foundation models are redefining use cases in healthcare and finance, and sovereign AI programs are channeling billions of dollars into regional data centers and GPU clusters. Competitive positioning now hinges on seamless governance, feature-store performance, and the ability to serve retrieval-augmented generation workloads at scale.
Key Report Takeaways
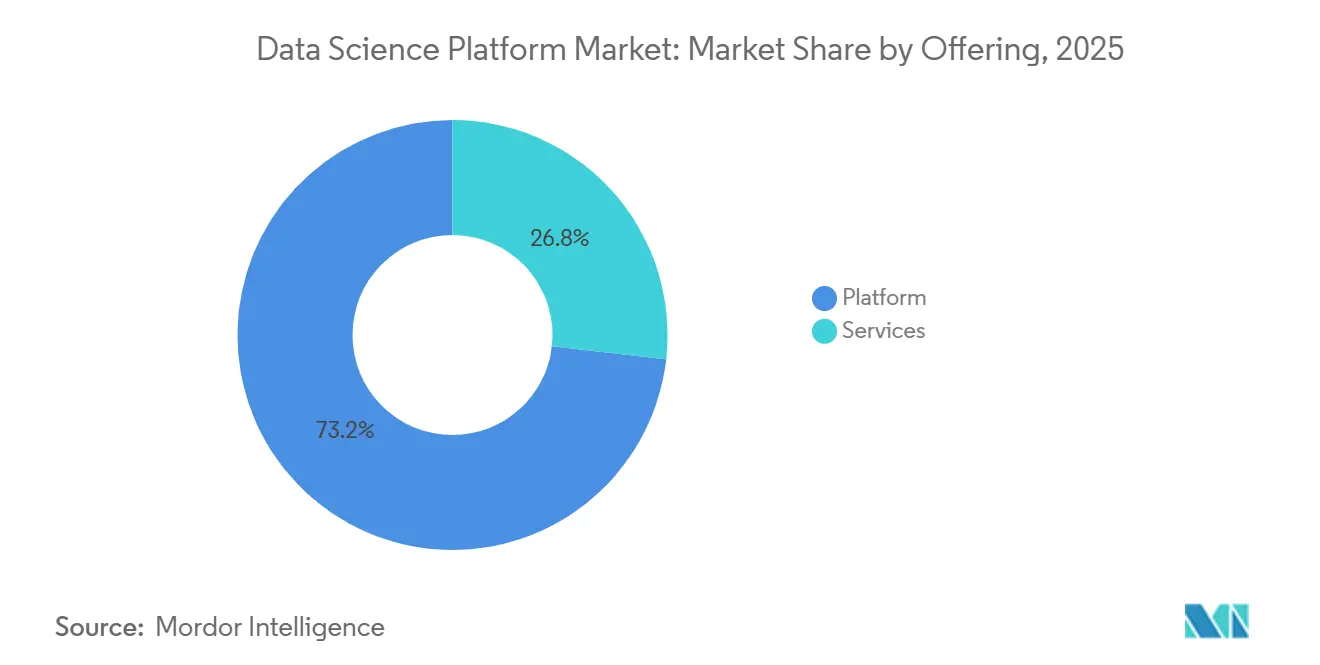
- By product offering, platforms captured 73.21% revenue share in 2025, while services are forecast to post a 17.8% CAGR through 2031.
- By deployment, cloud solutions held 67.50% of the Data Science Platform market share in 2025, and are projected to grow at an 18.4% CAGR through 2031.
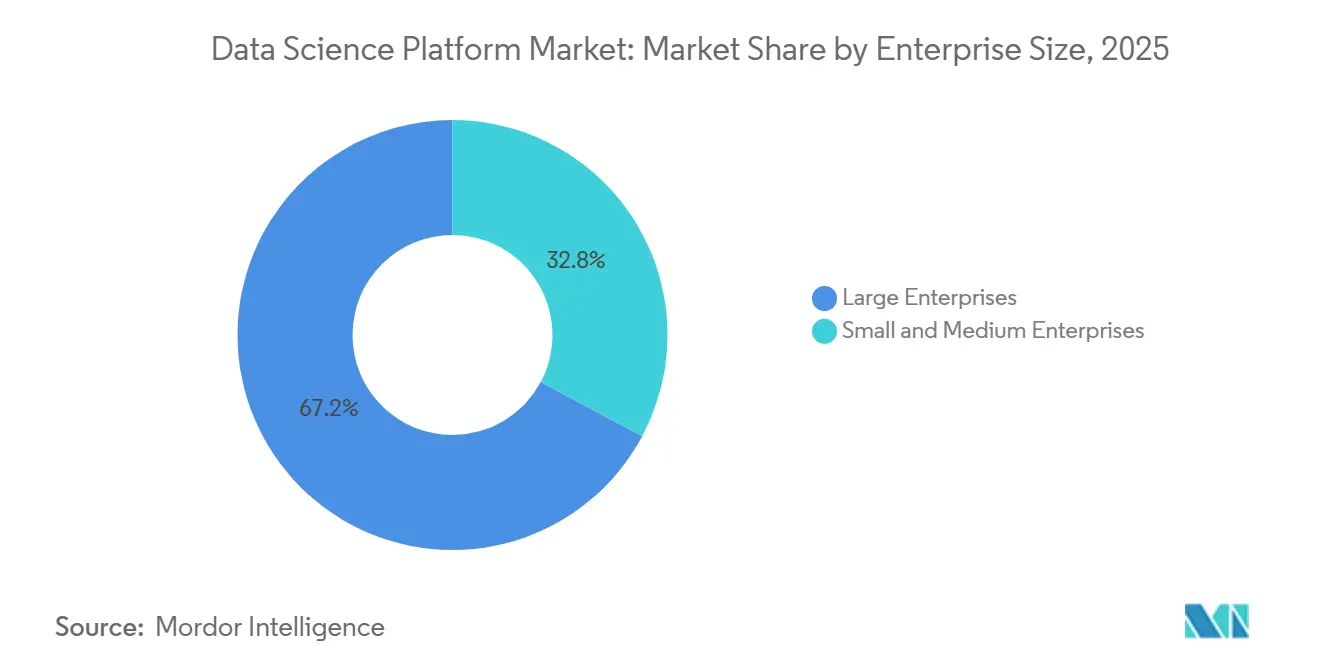
- By enterprise size, large enterprises commanded 67.20% of 2025 spending, whereas the SME segment is poised to expand at an 18.9% CAGR through 2031.
- By end-user industry, BFSI led with 24.70% share of the Data Science Platform market size in 2025; healthcare and life sciences are advancing at a 19.3% CAGR through 2031.
- By geography, North America accounted for 47.23% of the Data Science Platform market in 2025, while Asia-Pacific is forecast to post a 17.1% CAGR to 2031.
Note: Market size and forecast figures in this report are generated using Mordor Intelligence’s proprietary estimation framework, updated with the latest available data and insights as of January 2026.
Global Data Science Platform Market Trends and Insights
Drivers Impact Analysis*
| Driver | (~) % Impact on CAGR Forecast | Geographic Relevance | Impact Timeline |
|---|---|---|---|
| Proliferation of open-source ML frameworks | +3.2% | Global, strongest in North America and Europe | Medium term (2-4 years) |
| Stricter model-governance regulations | +2.8% | Europe, North America, Asia-Pacific | Long term (≥4 years) |
| Edge-to-cloud fabric adoption in manufacturing | +2.4% | North America, Europe, Asia-Pacific manufacturing hubs | Medium term (2-4 years) |
| Unstructured video and IoT data explosion | +2.9% | Global, concentrated in retail, healthcare, smart-city deployments | Short term (≤2 years) |
| Rise of domain-specific foundation models | +2.6% | North America and Europe healthcare, Asia-Pacific manufacturing | Medium term (2-4 years) |
| GPU supply-chain localization policies | +2.7% | Middle East, Asia-Pacific, Europe | Long term (≥4 years) |
| Source: Mordor Intelligence | |||
Proliferation of Open-Source ML Frameworks Catalyzing Platform Convergence
Open-source libraries power 87% of AI workloads, up eight percentage points from 2024, intensifying vendor competition on orchestration, governance, and enterprise support rather than core algorithms[1]Anaconda, “2025 State of Data Science Survey,” ANACONDA.COM. Python remains the dominant language, with 66% adoption, as firms consolidate toolchains to curb training overhead. Security gaps in community packages push many buyers toward commercial distributions that bundle CVE scanning and license compliance, adding momentum to enterprise-grade open-source support models. Databricks built MLflow natively into its platform, enabling model versioning across TensorFlow, PyTorch, and scikit-learn without lock-in, a feature set that underpinned its record USD 10 billion Series J round in 2024. As hyperscalers bundle similar tooling at marginal cost, margins for niche AutoML vendors continue to compress.
Stricter Model-Governance Regulations Boosting Managed Platforms
The European Union AI Act, in force since August 2024, requires conformity assessments for high-risk AI systems, steering organizations toward platforms with built-in audit trails and explainability modules. Complementary banking guidance from the Basel Committee demands rigorous model validation and third-party audits. The United States FDA updated software-as-a-medical-device guidance in January 2025, specifying pre-market submissions and post-market surveillance protocols that platforms with strong version control handle more efficiently. IBM’s watsonx.governance, launched 2024, automates EU AI Act reporting, trimming legal review cycles from weeks to days[2]IBM, “Annual Report 2024,” IBM.COM. Vendors lacking dedicated compliance teams risk disqualification from large enterprise bids.
Edge-To-Cloud Fabric Adoption Enabling Hybrid Platforms In Manufacturing
Factories now combine local inference with cloud-based retraining. Google’s Manufacturing Data Engine normalizes OPC-UA streams into BigQuery, unlocking predictive maintenance use cases[3]Google Cloud, “Manufacturing Data Engine,” CLOUD.GOOGLE.COM. Nokia’s MX Industrial Edge hosts containerized TensorFlow Lite models on rugged gateways, reducing quality-inspection latency below 50 milliseconds. Intel’s Edge Insights for Industrial software helped a European steelmaker cut unplanned downtime by 18% in 2025. Demand is rising for federated-learning platforms that keep proprietary data on-premise while sharing gradient updates, a capability Siemens Industrial Copilot delivers for discrete-manufacturing customers.
Unstructured Video And IoT Data Explosion Requiring Scalable Feature Stores
Over 80% of enterprise data now arrives in unstructured formats, forcing a shift from relational databases to vector databases and real-time feature stores. Databricks’ Feature Store slashes product-recommendation latency from 200 milliseconds to 15 milliseconds for leading retailers. Snowflake’s Snowpark ML added native unstructured-data support in 2024, helping healthcare providers train models on DICOM images without data egress. Tecton’s streaming feature platform cut fraud false-positives by 23% in pilot deployments. Startups such as Pinecone and Weaviate raised more than USD 200 million in 2024 to scale infrastructure for semantic search workloads.
Restraints Impact Analysis*
| Restraint | (~) % Impact on CAGR Forecast | Geographic Relevance | Impact Timeline |
|---|---|---|---|
| Data-residency barriers in EU public sector | -1.8% | Europe, notably Germany and France | Medium term (2-4 years) |
| Shortage of ML-Ops engineers | -2.3% | Global, acute in North America, Europe, Asia-Pacific | Short term (≤2 years) |
| Escalating cloud bills for real-time training | -1.6% | Global | Short term (≤2 years) |
| Legacy data silos in energy and utilities | -1.4% | North America, Europe, Asia-Pacific | Long term (≥4 years) |
| Source: Mordor Intelligence | |||
Data-Residency Barriers Hindering Multi-Region Roll-Outs In Public Sector EU
GDPR Article 44 and national statutes prohibit transferring citizen data to non-EU regions without adequacy safeguards. The Gaia-X initiative lagged deployment by 18 months, delaying Azure and AWS migrations for French and German ministries. France’s ministries postponed platform adoption until OVHcloud and T-Systems certified sovereign offerings. The EU Cloud Code of Conduct added further compliance layers that smaller vendors struggle to absorb. Resulting fragmentation pushes agencies toward on-premise or local-cloud installations, limiting economies of scale for global providers.
Shortage Of ML-Ops Engineers Undermining Complex Deployments
Three-quarters of organizations report difficulty hiring professionals with Kubernetes, CI/CD, and model-monitoring skill sets. Data scientists spend 40% of their workweek on infrastructure tasks rather than model development. United States median MLOps salaries climbed to USD 165,000 in 2025, up 22% from 2023. Hyperscaler managed services alleviate some pressure, but adoption remains skewed toward large enterprises with existing cloud contracts. Low-code solutions address mid-market needs yet may lack flexibility for regulated workloads.
*Our forecasts treat driver/restraint impacts as directional, not additive. The impact forecasts reflect baseline growth, mix effects, and variable interactions.
Segment Analysis
By Product Offering: Services Surge As Complexity Outpaces Internal Capabilities
Services are poised for a 17.8% CAGR through 2031, nearly double that of platforms, as enterprises confront talent shortages. Databricks logged a 48% rise in professional services revenue in fiscal 2024, driven by lakehouse migration projects. IBM secured a USD 500 million banking contract in 2024 to deploy watsonx across 12 countries. Accenture and Microsoft staffed 2,500 new MLOps specialists for their joint practice, reflecting demand for advisory services. Vendors now embed success plans, dedicated architects, and quarterly reviews into annual subscriptions, recognizing that licenses rarely account for more than 40% of total cost of ownership.
Platform providers also court niche consultancies to reach mid-market buyers. Slalom and Deloitte launched dedicated data-science practices in 2024, filling a gap where hyperscaler advisory teams remain focused on flagship accounts. This collaboration underscores the Data Science Platform market’s pivot toward blended software-plus-services contracts that guarantee outcome-based milestones and ongoing optimization.


By Deployment: Cloud Dominance Driven By Elastic Compute And Managed Services
Cloud computing held 67.50% share in 2025, and the Data Science Platform market size tied to cloud deployments is projected to grow at an 18.4% CAGR through 2031. Training a 70-billion-parameter model on AWS SageMaker costs roughly USD 350,000 per run and avoids the USD 15 million capital outlay for on-premises clusters. Microsoft added spot instances to Azure ML in 2024, cutting certain training costs by up to 80%. Google’s Vertex AI Pipelines cut operational overhead by 60% compared with self-managed Kubernetes clusters.
On-premise deployments survive in tightly regulated environments. Basel III compliance favors in-house control among financial institutions. Hybrid designs bridge both worlds, with Databricks Unity Catalog offering unified governance across multi-cloud and on-premise estates. HPE’s GreenLake for Machine Learning Operations delivers consumption-based pricing for on-premise hardware.
By Enterprise Size: SMEs Embrace Low-Code As Talent Constraints Bite
The SME segment is set for an 18.9% CAGR. Microsoft Power Platform let a mid-sized insurer launch a claims-processing model in six weeks via drag-and-drop tooling. Salesforce Einstein Studio uses natural-language prompts to build predictive models for sales teams. Google Vertex AI AutoML reduced model development time by 70% for an e-commerce retailer.
Large enterprises, however, still drive two-thirds of spending. JPMorgan Chase operates an internal platform integrating proprietary risk models with live market data. Walmart processes 2.5 petabytes of transaction data daily to optimize inventory across the United States stores. Such bespoke systems create stickiness that shields incumbents from low-code disruption, even as standardized tools broaden market reach.
By End-User Industry: Healthcare Accelerates While BFSI Maintains Spend Leadership
BFSI retained a 24.70% share in 2025, underpinned by credit risk modeling and anti-money laundering surveillance. Healthcare and life sciences, however, will post the fastest CAGR at 19.3%. Google’s Med-Gemini achieved 91.1% accuracy on U.S. medical licensing questions, outperforming general LLMs by 12 points. The FDA cleared eight AI-enabled medical devices in Q1 2025, more than doubling year-earlier approvals. Siemens Healthineers’ AI-Rad Companion cuts radiologist reading time by 30% across 200 hospitals.
Retail uses data science for demand forecasting and personalization. Amazon attributes 35% of sales to its recommendation engine, which analyzes over 1 billion interactions daily. Manufacturing deployments focus on predictive maintenance, with Bosch reducing false positives by 40% on automotive assembly lines. Energy and utilities lag due to entrenched OT silos, with only 22% integrating OT data into enterprise analytics as of 2025.
Geography Analysis
North America claimed 47.23% share in 2025, supported by hyperscaler capacity and USD 25 billion in venture funding during 2024. The U.S. Executive Order on AI requires federal agencies to adopt governance frameworks, fueling demand for compliant platforms. Canada’s Vector Institute trains 500 researchers a year, buoying domestic adoption.
Asia-Pacific is forecast for a 17.1% CAGR. In Western Asia, Saudi Arabia dedicated USD 100 billion to regional AI infrastructure, partnering with Huawei and Oracle, and the United Arab Emirates released open-source Falcon LLMs to reduce reliance on U.S. models. Japan pledged JPY 2 trillion (USD 13.4 billion) to AI chip fabrication and data center construction. China’s market still expands despite export controls, propelled by domestic accelerators. India’s Digital India initiative drove 35% year-over-year cloud-platform adoption in 2024.
Europe’s trajectory is flatter due to residency mandates. Germany delayed public-sector migrations pending Gaia-X certification. The U.K. AI Safety Institute is crafting testing protocols that require robust safety guardrails. South America’s growth centers on Brazilian banks deploying SageMaker for fraud detection. Middle East programs focus on smart-city mobility, as Dubai’s traffic-optimization models trimmed congestion by 12%. African adoption remains nascent, limited to telecom churn-prediction pilots.

Competitive Landscape
The top five vendors, AWS, Microsoft, Google, Databricks, and Snowflake, held about 55% combined share in 2025, leaving meaningful headroom for specialized entrants. Hyperscalers leverage bundling to undercut pricing, pressuring independent software vendors. Databricks’ USD 10 billion Series J financing affirmed investor confidence in lakehouse architecture but intensified scrutiny from Snowflake, BigQuery, and open-source competitors. Open-source frameworks such as Kubeflow and MLflow gain ground among lock-in-averse enterprises, although heavy DevOps requirements limit uptake beyond tech-savvy firms. Patent filings by IBM, Microsoft, and Google emphasize explainability and federated learning, signaling that compliance and edge workloads drive R&D priorities.
Verticalized platforms offer room for differentiation. Bloomberg’s GPT for finance, trained on four decades of filings, surpassed general LLMs on sentiment analysis benchmarks. Tecton reduced feature-engineering time by 60% for Coinbase and Affirm with its automated pipelines. Generative-AI workflows now spur demand for retrieval-augmented generation, a capability AWS Bedrock, Azure OpenAI Service, and Google Vertex AI added in 2024.
Data Science Platform Industry Leaders
IBM Corporation
Google LLC (Alphabet Inc.)
Microsoft Corporation
SAS Institute Inc.
Alteryx Inc.
- *Disclaimer: Major Players sorted in no particular order

Recent Industry Developments
- January 2025: Microsoft introduced Azure AI Foundry, a unified stack combining Azure Machine Learning, OpenAI Service, and Cognitive Services, with pre-built connectors for SAP and Salesforce to speed enterprise integration.
- December 2024: Databricks closed a USD 10 billion Series J round led by Thrive Capital and Andreessen Horowitz, earmarked for global expansion and lakehouse AI enhancements.
- November 2024: Oracle launched AI Vector Search in Autonomous Database, enabling retrieval-augmented generation without external vector stores.
- October 2024: Google Cloud unveiled Vertex AI Agent Builder, a low-code tool for domain-specific agents that integrate with BigQuery and third-party APIs.


Research Methodology Framework and Report Scope
Market Definitions and Key Coverage
Our study defines the data science platform market as the worldwide revenue earned from packaged software workbenches that let data engineers and scientists ingest, prepare, model, deploy, and monitor machine-learning or statistical projects across cloud and on-premise environments for any business function.
Scope Exclusions: legacy business intelligence dashboards that lack native model-building capability, bespoke consulting projects, and stand-alone ETL or MLOps tools are left outside this assessment.
Segmentation Overview
- By Product Offering
- Platform
- Services
- By Deployment
- On-Premise
- Cloud
- By Enterprise Size
- Small and Medium Enterprises
- Large Enterprises
- By End-user Industry
- IT and Telecom
- BFSI
- Retail and E-commerce
- Manufacturing
- Energy and Utilities
- Healthcare and Life Sciences
- Government and Defense
- Rest of End-user Industries
- By Geography
- North America
- United States
- Canada
- Mexico
- South America
- Brazil
- Argentina
- Rest of South America
- Europe
- Germany
- United Kingdom
- France
- Italy
- Spain
- Rest of Europe
- Asia-Pacific
- China
- India
- Japan
- South Korea
- Australia and New Zealand
- Rest of Asia-Pacific
- Middle East
- Saudi Arabia
- United Arab Emirates
- Turkey
- Rest of Middle East
- Africa
- South Africa
- Nigeria
- Egypt
- Rest of Africa
- North America
Detailed Research Methodology and Data Validation
Primary Research
We interviewed platform product managers and enterprise analytics leaders across North America, Europe, and Asia-Pacific, plus regional system integrators. These conversations clarified deployment mix shifts, typical pricing bands, and adoption triggers, filling gaps left by secondary work before we triangulated the final figures.
Desk Research
Mordor analysts first mined freely available macro-technology indicators from the US Bureau of Labor Statistics, OECD ICT statistics, the NIST AI Adoption Index, Eurostat's digital economy series, and major software trade associations. Company 10-Ks, IPO filings, investor presentations, and quarterly earnings calls supplied segment splits and average selling price markers. Paid repositories such as D&B Hoovers and Dow Jones Factiva helped verify private player revenue and important press activity. The sources listed here are illustrative; many other references supported data collection, validation, and clarification.
Market-Sizing & Forecasting
The model begins with global enterprise software spend, narrows to analytics software, and then applies a platform penetration ratio refined by industry, company size, and deployment mode. Bottom-up checks, such as supplier roll-ups and sampled ASP × user counts, anchor reality and flag over or under shoots. Key inputs include cloud infrastructure outlays, data engineer headcount growth, published per-user pricing trends, and regulatory AI governance milestones. A multivariate regression projects demand to 2030, and where bottom-up data points prove sparse, we use midpoint assumptions that are re-tested through expert calls.
Data Validation & Update Cycle
Before sign-off, we run variance checks against public deal announcements and parallel software sub-markets, and any anomaly triggers a second analyst review. The model refreshes each year, with interim updates when major acquisitions, price resets, or new regulation shift fundamentals.
Why Mordor's Data Science Platform Baseline Earns Trust
Published estimates often diverge because firms mix different toolsets, revenue recognition rules, and refresh cadences.
Key gap drivers for higher numbers elsewhere include counting generic AI development suites, rolling multiyear professional services into the base year, or using contract bookings instead of recognized revenue. By isolating pure license and subscription income and by updating the model annually, Mordor avoids these distortions.
Benchmark comparison
| Market Size | Anonymized source | Primary gap driver |
|---|---|---|
| USD 111.23 B | Mordor Intelligence | |
| USD 154.79 B | Regional Consultancy A | Includes broader AI platform and data integration categories |
| USD 145.80 B | Trade Journal B | Adds bespoke analytics services to software base |
| USD 194.09 B | Industry Association C | Uses contract bookings rather than recognized revenue |
The comparison shows that scope stretch and accounting choices can inflate figures; by centering on clear platform criteria and repeatable steps, Mordor offers decision makers a balanced, transparent baseline they can rely on.


Key Questions Answered in the Report
How fast is the Data Science Platform market expected to grow through 2031?
The market is forecast to register a 16.56% CAGR, rising from USD 132.19 billion in 2026 to USD 284.37 billion by 2031.
Which deployment model will contribute most to new spending?
Cloud deployments, already 67.50% of 2025 revenue, are projected for an 18.4% CAGR as elastic compute and managed services gain favor.
Why are managed services expanding faster than software licenses?
MLOps talent shortages and rising compliance complexity push enterprises to outsource integration, governance, and optimization, driving a 17.8% CAGR for services.
What factors make healthcare the fastest-growing end-user segment?
Domain-specific foundation models such as Med-Gemini and accelerating FDA approvals support a 19.3% CAGR for healthcare and life-sciences platforms.
Page last updated on:


