Datafication Market Size and Share
Market Overview
| Study Period | 2020 - 2031 |
|---|---|
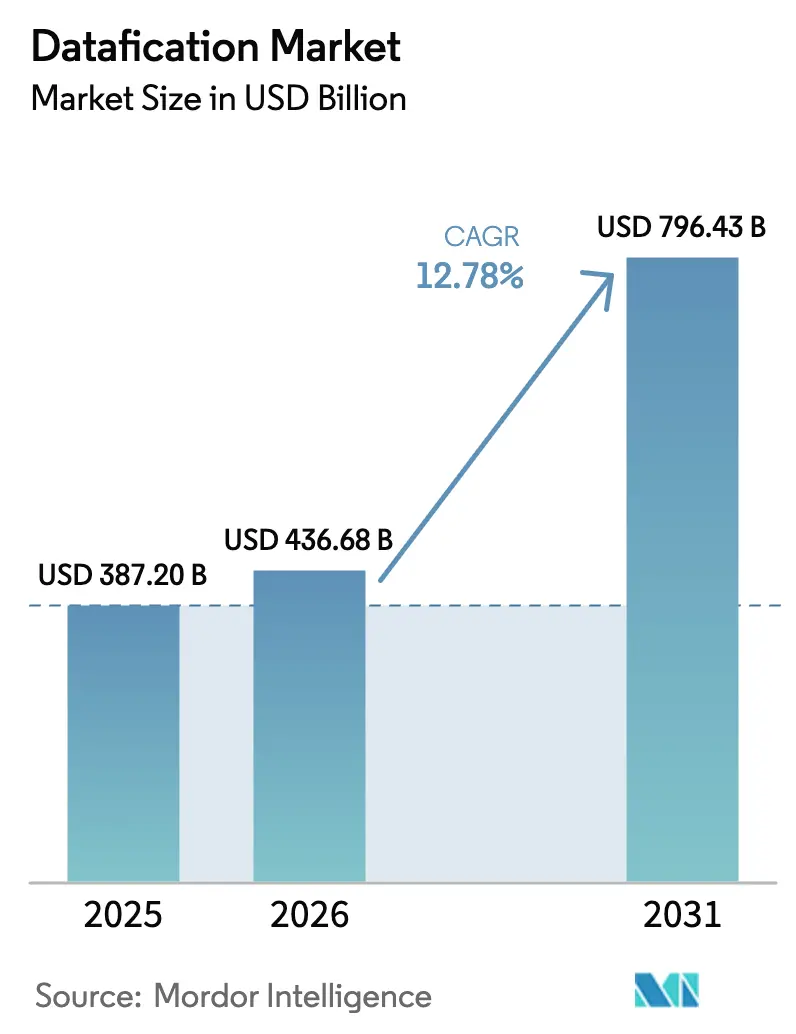
| Market Size (2026) | USD 436.68 Billion |
| Market Size (2031) | USD 796.43 Billion |
| Growth Rate (2026 - 2031) | 12.78% CAGR |
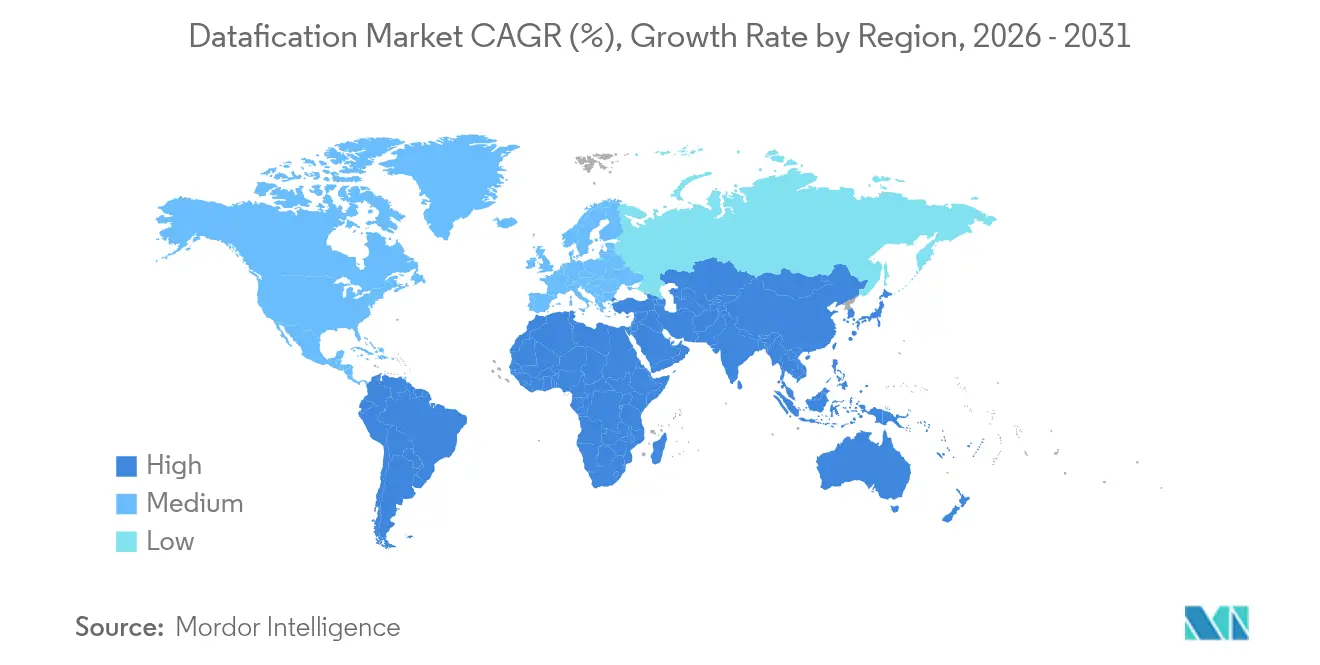
| Fastest Growing Market | Asia Pacific |
| Largest Market | North America |
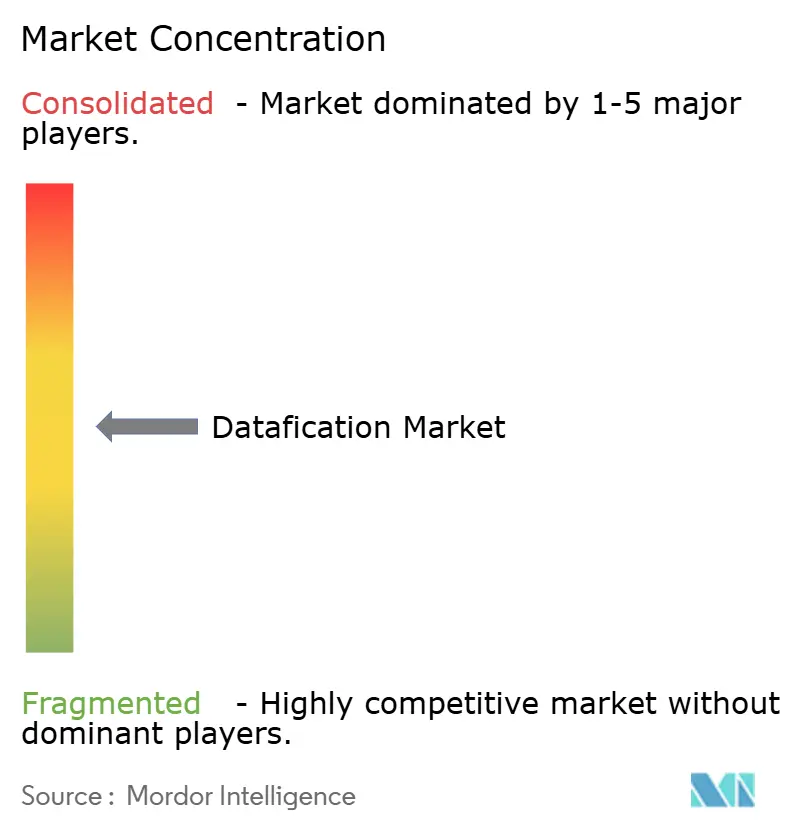
| Market Concentration | Medium |
Major Players *Disclaimer: Major Players sorted in no particular order Image © Mordor Intelligence. Reuse requires attribution under CC BY 4.0. | |
Datafication Market Analysis by Mordor Intelligence
The Datafication market size is expected to grow from USD 387.2 billion in 2025 to USD 436.68 billion in 2026 and is forecast to reach USD 796.43 billion by 2031 at 12.78% CAGR over 2026-2031. This continued rise reflected the way organisations across every major sector translated interactions, transactions, and sensor readings into structured insight that underpins product design, customer engagement, and operational control. Decision makers treated high-quality data as a strategic asset on par with capital equipment, driving sustained investment in scalable cloud platforms, resilient edge nodes, and governance layers that preserve privacy while enabling broad analytic reach. Adoption accelerated as 5G networks widened bandwidth, IoT endpoints multiplied, and affordable AI toolsets pushed real-time prediction into frontline workflows. Vendors responded with pre-integrated stacks that compress deployment timelines and with FinOps-style cost-control dashboards that link consumption to value, reinforcing a performance-first mindset across the Datafication market.
Key Report Takeaways
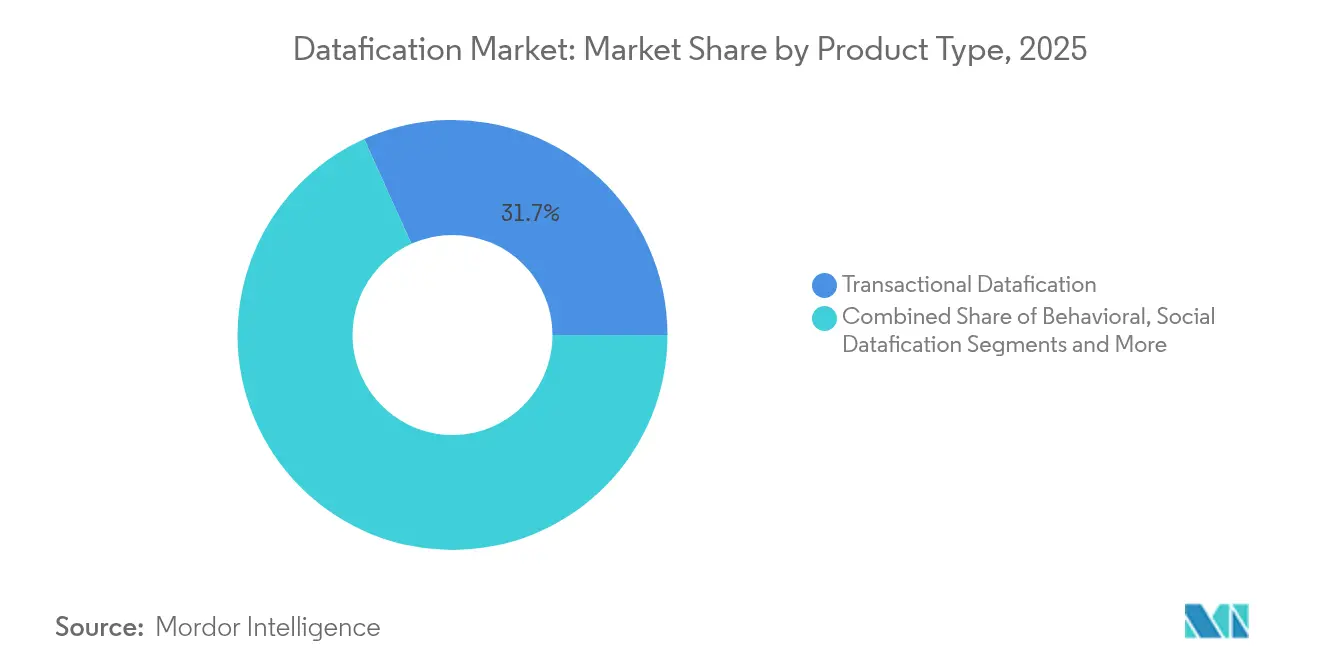
- By product type, transactional data captured 31.74% of the Datafication market share in 2025, whereas sensor data is projected to grow at a 15.48% CAGR through 2031.
- By component, solutions generated 59.55% of sector revenue in 2025; services are poised to climb at a 16.02% CAGR by 2031.
- By deployment mode, cloud accounted for 67.62% of spending in 2025, while edge / hybrid options are forecast to expand at a 19.64% CAGR.
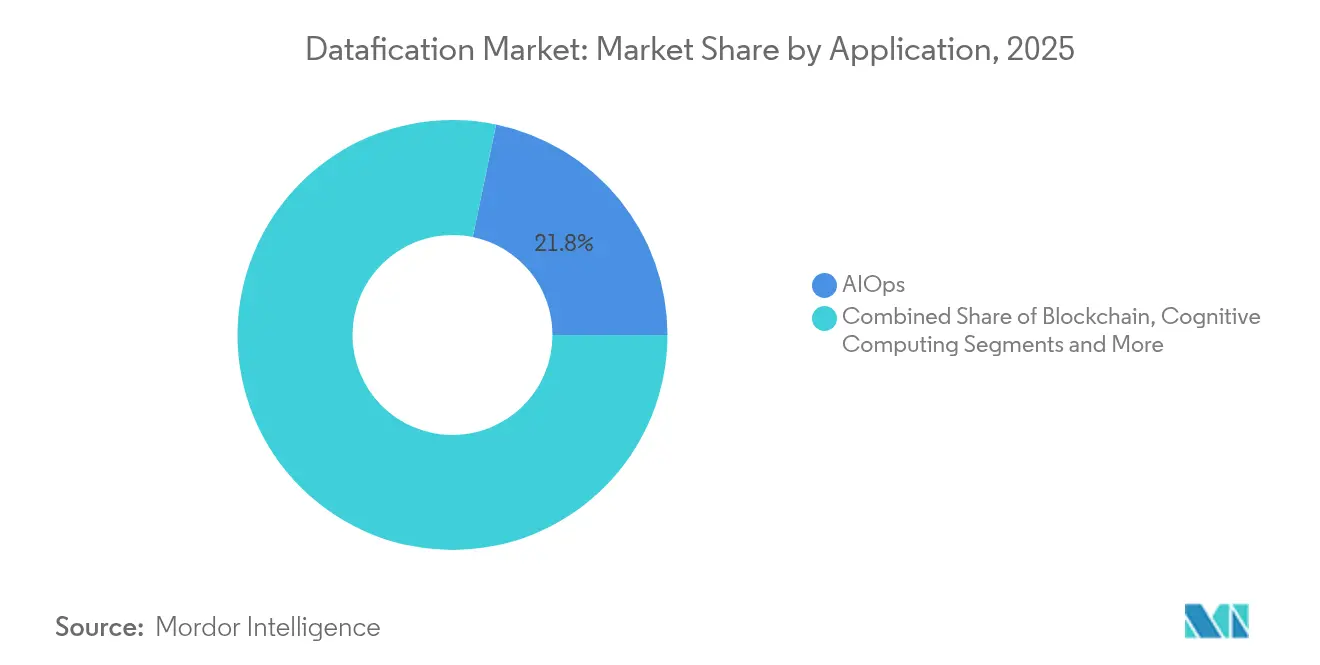
- By application, AIOps led with a 21.75% share in 2025; edge computing is expected to post a 20.79% CAGR to 2031.
- By end-user vertical, BFSI delivered 27.68% revenue in 2025; manufacturing is set for an 17.63% CAGR during the outlook period.
- By geography, North America held 34.79% of total revenue in 2025; Asia-Pacific is anticipated to advance at a 17.05% CAGR.
Note: Market size and forecast figures in this report are generated using Mordor Intelligence’s proprietary estimation framework, updated with the latest available data and insights as of 2026.
Global Datafication Market Trends and Insights
Drivers Impact Analysis*
| Driver | (~) % Impact on CAGR Forecast | Geographic Relevance | Impact Timeline |
|---|---|---|---|
| Exploding data volumes from IoT and 5G networks | +3.2% | Global; strongest in North America, Western Europe, East Asia | Medium term (2-4 years) |
| Enterprise push for data-driven decision-making | +2.8% | Global; early adoption in North America and Europe | Short term (≤2 years) |
| Cloud cost compression via FinOps analytics | +2.5% | North America, Europe, advanced Asia-Pacific economies | Medium term (2-4 years) |
| Tighter data-privacy regulations driving compliant tooling | +1.9% | Europe, North America, extending to Asia-Pacific and Latin America | Short term (≤2 years) |
| Rise of synthetic data marketplaces | +1.5% | North America, Europe, advanced Asia-Pacific economies | Long term (≥4 years) |
| Metaverse telemetry creating “metaversal” data demand | +0.0% | North America, East Asia | Long term (≥4 years) |
| Source: Mordor Intelligence | |||
Exploding data volumes from IoT and 5G networks
Connected endpoints spurred a surge in data streams that businesses analysed to detect machine faults, manage inventory, and personalise health interventions. Every plant floor, retail shelf, and delivery vehicle fed telemetry into platforms designed to turn raw packets into rapid insight. Organisations processed quintillion-byte quantities each day, a scale that demanded elastic pipelines and edge appliances to prevent latency bottlenecks. Device links supported by 5G added both bandwidth and determinism, allowing real-time feedback loops that once required wired infrastructure. Competitive advantage flowed not from collecting data alone but from shaping architectures that can filter, enrich, and act in the same moment.
Enterprise push for data-driven decision-making
Corporate cultures shifted as leadership teams embedded measurable insight into budgeting, product road-maps, and customer experience playbooks. Chief data officers gained organisational influence, steering governance boards that set quality thresholds and approved data ethics policies. Fujitsu’s OneERP+ rollout showcased how unified transaction and operations streams reduced manual reconciliation and accelerated forecast accuracy. [1]Shin-yi Peng, “Data as Capital and Algorithmic Input,” cambridge.org Self-service dashboards gave frontline managers the ability to query curated layers without coding, widening the pool of staff who contribute evidence-based recommendations. As adoption widened, firms reported faster time to market and higher customer-lifetime value, reinforcing the strategic importance of the Datafication market.
Cloud cost compression via FinOps analytics
Escalating public-cloud invoices motivated teams to adopt FinOps playbooks that couple utilisation data with AI-driven rightsizing. Dashboards surfaced idle services, predicted spending trends, and recommended reserved-capacity purchases that shaved 20-30% from monthly charges. The same telemetry enriched performance tuning decisions, guiding architects toward optimal storage tiers and workload placement. FinOps practices therefore linked budget stewardship to technical performance, helping leadership prove ROI on digital modernisation. The resulting savings often financed new analytic projects, sustaining momentum across the Datafication market.
Tighter data-privacy regulations driving compliant tooling
Regulators introduced stronger consent mechanisms, algorithm-transparency clauses, and cross-border transfer controls. Enterprises responded by embedding privacy-enhancing technologies—such as differential privacy and federated learning—into data pipelines, allowing teams to mine patterns while masking individual identifiers. Compliance-ready platforms became differentiators in vendor shortlists, especially when buyers faced multi-jurisdiction operations. The Digital Markets Act raised expectations for audit-ready governance that explains model outputs, triggering demand for lineage tracking and bias-detection modules. Organisations that aligned early not only met legal thresholds but also built user trust, compounding competitive advantage.
Restraints Impact Analysis*
| Restraint | (~) % Impact on CAGR Forecast | Geographic Relevance | Impact Timeline |
|---|---|---|---|
| Acute shortage of data engineering talent | –2.1% | Global; most severe in North America and Europe | Medium term (2-4 years) |
| Escalating data-sovereignty and cross-border transfer barriers | –1.8% | Europe, China, Russia, India, Brazil | Medium term (2-4 years) |
| GPU / AI chip supply chain volatility | –0.0% | Global; concentrated impact in North America and East Asia | Short term (≤2 years) |
| Growing end-user fatigue over data monetisation | –0.0% | North America, Europe | Long term (≥4 years) |
| Source: Mordor Intelligence | |||
Acute shortage of data engineering talent
Demand for engineers who design real-time pipelines, optimise streaming frameworks, and align metadata to business taxonomies far exceeded supply. Competition lifted compensation bands and lengthened hiring cycles, prompting firms to reskill DevOps staff and adopt automation that abstracts complexity. Low-code ingestion tools reduced barrier-to-entry for citizen developers, yet sophisticated initiatives still required seasoned architects. Managed services filled gaps, though reliance on external partners sometimes slowed internal capability building. The skills crunch therefore acted as a drag on deployment velocity and inflated total cost of ownership.
Escalating data-sovereignty and cross-border transfer barriers
Dozens of nations tightened localisation mandates that dictate where personal information must reside, complicating the central-lake model favoured in earlier cloud migrations. Multinationals re-engineered topologies into federated fabrics that process sensitive data within borders while forwarding anonymised aggregates to regional hubs. These designs preserved insight without breaching statutes but added orchestration overhead and fragmented master-data viewpoints. Vendors introduced region-specific zones and sovereign-cloud offerings to address customer risk, yet harmonising policy updates across jurisdictions remained resource intensive. Compliance costs therefore trimmed the achievable CAGR within the Datafication market.
*Our forecasts treat driver/restraint impacts as directional, not additive. The impact forecasts reflect baseline growth, mix effects, and variable interactions.
Segment Analysis
By Product Type: Sensor data unlocks operational visibility
Sensor streams redefined frontline decision cycles even though transactional records still produced the largest revenue block in 2025. Transactional processes contributed 31.74% of Datafication market share as enterprises continued to track payments, orders, and supply-chain milestones. The sensor category, however, is projected to expand at 15.48% CAGR, reflecting relentless IoT adoption on shop floors, in logistics depots, and across urban infrastructure. Use cases now encompass vibration alerts in rotating machinery, atmospheric monitoring in cold-chain carriers, and structural health checks on civil assets. Such initiatives elevate predictive maintenance, cut downtime, and elongate asset life, delivering tangible ROI that justifies fresh budgets within the Datafication market size.
Behavioural datasets, derived from click paths and app gestures, support hyper-personalised content curation, while social graphs quantify relationship strength for campaign optimisation. Geospatial signals map congestion, guide last-mile routing, and feed digital twin simulations used by smart-city planners. Each supplemental category enriches the master analytics layer, but sensor-driven visibility continues to drive the steepest adoption curve. Organisations now pair AI inference engines with micro-controllers, enabling immediate response to anomalous patterns without detouring through distant cloud cores. This edge-first posture illustrates how the Datafication market converts raw telemetry into real-time foresight that was previously unattainable.


By Component: Services lift execution success
Solution licences, ranging from data lakes to governance consoles, generated 59.55% of revenue in 2025, yet services contracts are projected to climb 16.02% annually as buyers lean on external expertise. Advisory teams craft road-maps that reconcile technical ambition with process maturity, while implementation squads expedite pipeline builds that meet security and compliance benchmarks. Managed run-state offerings then absorb day-to-day administration, freeing internal analysts to exploit insights rather than patch clusters. This full-lifecycle engagement model reduces project risk and accelerates time-to-value, explaining why the services slice of the Datafication market size is forecast to swell to USD 292.6 billion by 2031.
DataOps frameworks gained prominence, knitting together data engineers, platform site-reliability engineers, and business domain experts in agile sprints that deliver incremental artefacts. Continuous integration pipelines test schema drift and lineage updates, catching errors before they propagate into dashboards. Education packages cultivate literacy among executives, ensuring strategic questions align with what curated datasets can answer. The combined impact tightens feedback loops between insight discovery and operational rollout, reinforcing the virtuous cycle that propels the wider Datafication market.
By Deployment Mode: Edge and hybrid meet latency rules
Public-cloud estates retained 67.62% share in 2025 thanks to on-demand elasticity, rich service catalogs, and global availability zones. Still, edge and hybrid footprints are heading for a 19.64% CAGR as firms push compute to factory lines, retail kiosks, and field vehicles. Latency budgets measured in microseconds, local processing to satisfy sovereignty, and the cost of backhauling petabytes of raw logs inform this architectural pivot. Edge appliances pre-filter noise, execute ML inference, and forward distilled context to central repositories, shrinking bandwidth bills and enabling autonomous action.
Hybrid orchestration frameworks synchronise policy, keys, and metadata across on-premises, edge, and multi-cloud silos, providing a single governance plane. As a result, analysts query distributed tables through one interface, unaware of data location. On-premises clusters continue to serve ultra-regulated workloads in sectors such as public safety and defence, though their share declines incrementally as containerised services make migration smoother. The coexistence of modes under a data-fabric umbrella expands the addressable audience for the Datafication market, removing historical barriers tied to location.
By Application: Edge computing accelerates real-time judgement
AIOps platforms accounted for 21.75% of 2025 revenue by automating alert triage, capacity scaling, and root-cause isolation across sprawling infrastructure estates. Edge computing workloads, however, are forecast to grow 20.79% per year because factories, vehicles, and medical devices need sub-second inference. Autonomous forklifts compute route adjustments locally to avoid collisions; immersive retail mirrors generate personalised recommendations as shoppers move; connected operating theatres analyse vitals in real time to guide interventions. Each scenario demands on-site heft that cloud centres cannot match due to round-trip latency.
Blockchain deployments secure data lineage, adding tamper-proof audit trails that satisfy regulatory mandates in supply-chain finance. Cognitive computing extracts meaning from unstructured documents such as clinical notes and maintenance manuals, supplying context that structured logs omit. FinOps suites apply usage data to forecast spending, reinforcing financial stewardship across cloud and on-prem operations. Smart-city planners integrate sensor grids with digital twins to test traffic-signal timing before field rollout, while XR training modules overlay analytics on physical environments. The breadth of applications highlights why the Datafication market continues to diversify beyond early business-intelligence roots.
By End-user Vertical: Manufacturing accelerates digital twin adoption
BFSI institutions remained the largest spenders, holding 27.68% of 2025 revenue. Banks integrated fraud-detection models with core-banking systems to flag suspicious flows in milliseconds, while insurers priced policies dynamically using behavioural risk scores. Manufacturing, though, leads growth with an 17.63% CAGR. Plants fused operational-technology telemetry with enterprise resource planning to craft digital twins that model energy use, throughput, and wear patterns. Predictive simulations reduced scrap, shortened changeover times, and informed capital allocation, proving the tangible upside of Datafication market deployment.
Healthcare providers mined vitals, imaging, and patient-journey data to personalise treatment and allocate resources efficiently. Telecom operators tuned network slices based on real-time congestion maps, improving customer experience. Governments leveraged integrated citizen records to speed permit processing and detect benefit fraud, while retailers harnessed click-stream fusion to refine assortments and prevent stock-outs. The rapid cross-industry diffusion demonstrates how the Datafication market delivers value in contexts as diverse as smart grids and precision agriculture.
Geography Analysis
North America led the Datafication market with 34.79% revenue in 2025, supported by deep cloud penetration, venture funding, and mature analytics talent pools. Financial-services firms improved fraud detection by combining transactional flows with behavioural biometrics, while hospitals applied predictive risk scoring to reduce readmissions. Synthetic-data startups flourished, offering privacy-preserving lakes that satisfy state-level mandates.
Asia-Pacific is on track for a 17.05% CAGR, the fastest among major regions. Chinese manufacturers deployed AI-infused edge nodes in smart factories, cutting unplanned downtime and boosting throughput. India’s Unified Payments Interface generated granular transaction trails that feed personalised lending models. Southeast Asian economies adopted mobile-first analytics, bypassing legacy desktop constraints and capturing real-time buyer sentiment from super-apps. Local data-residency statutes shaped hybrid-cloud rollouts as hyperscalers opened regional zones.
Europe blended regulatory strictness with technology leadership. GDPR enforcement and the forthcoming Digital Markets Act spurred adoption of privacy-enhancing computation. German industrial clusters connected sensor grids to supply-chain command centres, while EU recovery funds accelerated public-sector modernisation in southern states. GAIA-X advanced sovereign-infrastructure ambitions, giving organisations a regional alternative to non-European hyperscalers.

Competitive Landscape
The Datafication market exhibits moderate concentration. IBM, Microsoft, AWS, Google, and Oracle combine cloud compute, data warehousing, governance suites, and AI services into integrated portfolios. Their vast engineering budgets and partner channels sustain continuous expansion of managed offerings that shrink deployment friction for enterprise buyers. Nonetheless, specialised vendors such as Snowflake, Databricks, and Palantir captured share by excelling at particular tasks—lake-house unification, collaborative workflows, or sector-specific modelling. These firms often ride on hyperscaler infrastructure yet differentiate through performance optimisation and pre-packaged accelerators.
Industry newcomers attack white spaces with domain tooling: manufacturing platforms that embed asset-hierarchy templates, healthcare clouds that incorporate clinical ontology, and financial-risk engines with pre-validated regulatory rulesets. Low-code interfaces lower entry barriers for business analysts, addressing the talent restraint by shifting routine data wrangling away from scarce engineers. AI integration remains the decisive battleground. Providers that meld natural-language query, automated quality checks, and generative-AI documentation win favour among teams seeking transparency and speed. Matterport, for example, leverages AI to convert spatial scans into 3D twins that streamline property assessment workflows, underscoring the breadth of innovation in the Datafication market. [4]Matterport, Inc., “Management’s Discussion and Analysis,” sec.gov
Partner ecosystems also shape rivalry. Hyperscalers host catalogues where independent software vendors publish connectors, privacy plug-ins, and edge orchestrators. Systems integrators integrate stacks, ensure compliance, and manage change-management programmes that embed a data-driven ethos across staff ranks. As customers prioritise interoperability to avoid lock-in, open standards—such as Apache Iceberg for table formats and OpenLineage for metadata—gain traction. Vendors that embrace these protocols strengthen trust and extend addressable opportunity, reinforcing momentum across the Datafication market.
Datafication Industry Leaders
IBM Corporation
Amazon Web Services
Microsoft Corporation
Google LLC
Oracle Corporation
- *Disclaimer: Major Players sorted in no particular order

Recent Industry Developments
- May 2025: Databricks acquired Tecton for USD 450 million, bringing feature-store capability in-house to complete its machine-learning lifecycle portfolio.
- May 2025: Alteryx released Designer Cloud, a browser-based analytics studio that extends collaboration and cuts install complexity.
- April 2025: Microsoft launched Azure Synapse Link for Dataverse, streaming Dynamics 365 and Power Platform data into Synapse Analytics without affecting transactional performance.
- March 2025: Snowflake introduced Cortex, an AI-powered environment that lets non-technical users query data via natural language while maintaining governance controls.


Research Methodology Framework and Report Scope
Market Definitions and Key Coverage
Our study defines the global datafication market as the total spending on software platforms, cloud services, and professional services that transform raw behavioral, social, transactional, geospatial, and sensor traces into structured data assets ready for analytics, automation, or monetization. This covers ingestion, transformation, governance, cataloging, and exchange capabilities that let firms treat information as an economic product.
Scope Exclusion: Pure-play hardware such as servers, storage appliances, and network gear is excluded unless bundled in a datafication service contract.
Segmentation Overview
- By Product Type
- Behavioral Datafication
- Social Datafication
- Geospatial Datafication
- Transactional Datafication
- Sensor Datafication
- By Component
- Solutions
- Services (Consulting, Managed)
- By Deployment Mode
- Cloud
- On-Premises
- Edge / Hybrid
- By Application
- Blockchain
- AIOps
- Cognitive Computing
- Edge Computing
- FinOps
- Smart Cities and XR
- By End-user Vertical
- BFSI
- Healthcare
- IT and Telecom
- Government and Defense
- Retail and E-commerce
- Manufacturing
- Media and Entertainment
- Education
- Transportation and Logistics
- Energy and Utilities
- By Geography
- North America
- United States
- Canada
- Mexico
- South America
- Brazil
- Argentina
- Rest of South America
- Europe
- Germany
- United Kingdom
- France
- Italy
- Russia
- Rest of Europe
- Asia-Pacific
- China
- Japan
- India
- South Korea
- Australia and New Zealand
- Rest of Asia-Pacific
- Middle East and Africa
- Middle East
- GCC Countries (Saudi Arabia, UAE, Qatar)
- Turkey
- Rest of Middle East
- Africa
- South Africa
- Nigeria
- Rest of Africa
- Middle East
- North America
Detailed Research Methodology and Data Validation
Primary Research
Mordor analysts interviewed platform architects, chief data officers, and systems-integrator partners across North America, Europe, and Asia. Their budget ranges, license-seat counts, and forward plans verified desk findings and tuned final assumptions.
Desk Research
We began by mapping demand using open datasets from the International Telecommunication Union, OECD digital-economy indicators, Eurostat ICT surveys, and UN COMTRADE codes that trace data-management software. Our team reviewed public filings, earnings calls, and road maps of the fifteen largest vendors to spot deal sizes and price signals. Paid feeds (D&B Hoovers for company revenues and Dow Jones Factiva for deal news) refined revenue splits, while privacy-regulator annual reviews and the Cloud Native Computing Foundation supplied adoption benchmarks. These sources are illustrative; many additional publications underpinned cross-checks.
Market-Sizing & Forecasting
A top-down build anchored on 2024 enterprise IT outlays was recreated for 2025 through production and trade-data reconstructions, then aligned with selective bottom-up vendor roll-ups and sampled ASP × volume tests. Key variables like global cloud IaaS spend, active IoT endpoints, data-platform seats per employee, compliance-filing counts, and marketplace-transaction volumes feed a multivariate regression with scenario analysis for 2025-2030. Regional peer proxies close any segment gaps after expert review.
Data Validation & Update Cycle
Outputs clear automated variance scans, senior analyst peer review, and research manager sign-off. We refresh models annually and issue interim updates whenever a USD 500 million-plus acquisition or a new regulation materially shifts adoption.
Why Mordor's Datafication Baseline Earns Client Trust
Published figures often diverge because some publishers mix hardware with software, drop professional services, or freeze currency rates.
By aligning scope, year, and live spend signals, Mordor provides a balanced benchmark buyers can rely on.
Benchmark comparison
| Market Size | Anonymized source | Primary gap driver |
|---|---|---|
| USD 387.2 B (2025) | Mordor Intelligence | - |
| USD 355.05 B (2024) | Global Consultancy A | Omits services and uses broad extrapolation multipliers |
| USD 354 B (2024) | Trade Journal B | Treats public-cloud PaaS revenue as a separate market |
| USD 392.39 B (2024) | Industry Think-Tank C | Holds 2023 exchange rates and lower IoT endpoint counts |
Taken together, our disciplined triangulation, yearly refresh, and transparent variable set give decision-makers a dependable starting point, while alternative baselines swing wider because of scope cuts or dated inputs.


Key Questions Answered in the Report
What is the projected Datafication market size by 2031?
The Datafication market size is forecast to reach USD 796.43 billion by 2031 on a 12.78% CAGR trajectory.
Which deployment mode is expanding fastest?
Edge / hybrid architectures lead growth with a 19.64% CAGR as organisations process latency-sensitive data near its point of origin.
Why is manufacturing considered the fastest-growing vertical?
Industry 4.0 programmes are embedding sensors and digital twins across production lines, pushing the vertical toward an 17.63% CAGR through 2031.
How do talent shortages affect adoption?
A scarcity of data engineers subtracts 2.1 percentage points from forecast CAGR by prolonging project timelines and raising costs, especially in North America and Europe.
What role do privacy regulations play in technology selection?
GDPR-style laws drive demand for platforms that integrate privacy-enhancing technologies and lineage tracking, influencing vendor choice and deployment architecture.
How concentrated is vendor competition in the Datafication market?
With the top five providers controlling just over half of revenue, the landscape is moderately concentrated, leaving substantial room for niche and vertical-focused entrants.
Page last updated on:


