China Sea Freight Forwarding Market Size and Share
Market Overview
| Study Period | 2020 - 2031 |
|---|---|
| Forecast Data Period | 2026 - 2031 |
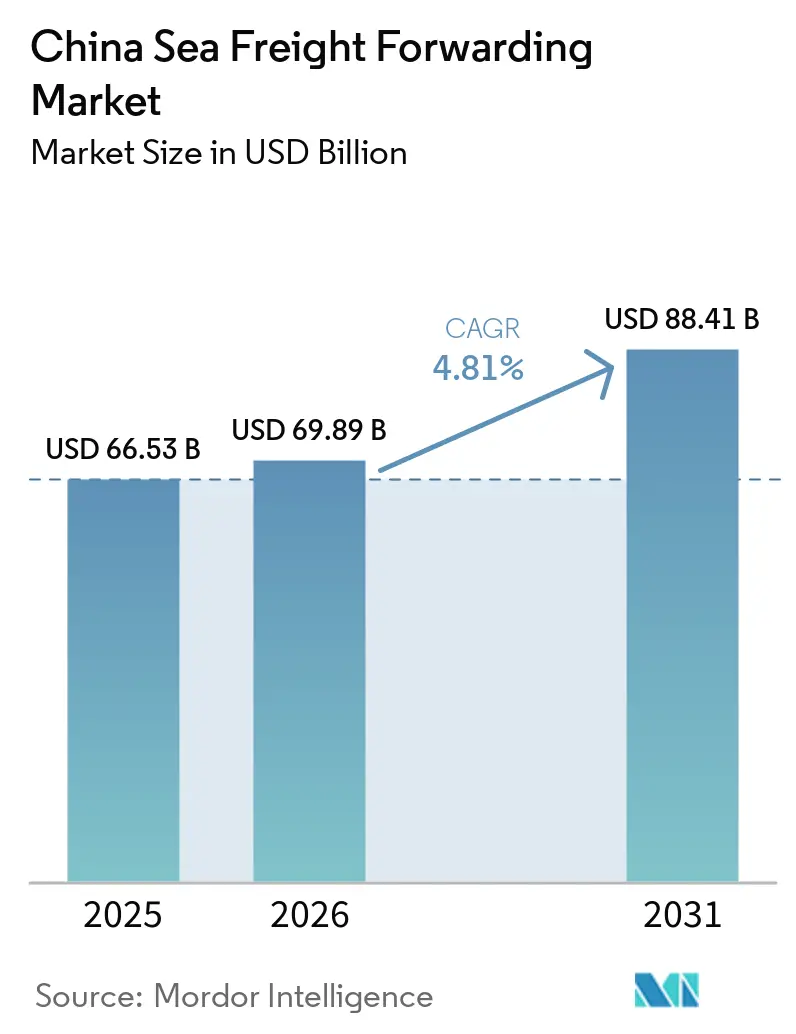
| Base Year Market Size (2025) | USD 66.53 Billion |
| Market Size (2026) | USD 69.89 Billion |
| Market Size (2031) | USD 88.41 Billion |
| Growth Rate (2026 - 2031) | 4.81% CAGR |
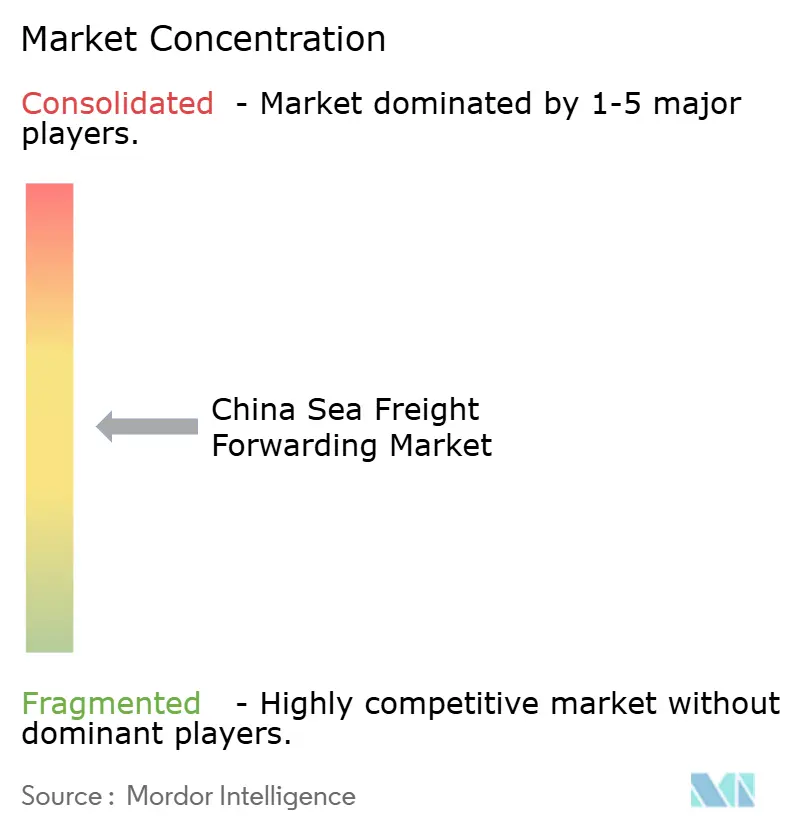
| Market Concentration | Medium |
Major Players *Disclaimer: Major Players sorted in no particular order Image © Mordor Intelligence. Reuse requires attribution under CC BY 4.0. | |
China Sea Freight Forwarding Market Analysis by Mordor Intelligence
The China sea freight forwarding market size is expected to increase from USD 66.53 billion in 2025 to USD 69.89 billion in 2026 and reach USD 88.41 billion by 2031, growing at a CAGR of 4.81% over 2026-2031.
The measured expansion reflects a shift from coast-centric consolidation to inland multimodal routing that links factories in western provinces to seaports through the New International Land-Sea Trade Corridor. Port automation in Shanghai, Ningbo-Zhoushan, and Guangzhou cuts vessel turnaround times and reduces labor cost per lift by up to 40%, while the rollout of blockchain bills of lading shortens customs release from days to hours. Cross-border e-commerce parcels now fill Less-than-Container-Load (LCL) boxes that move more frequently, improving container utilization and prompting forwarders to invest in consolidation warehouses near production clusters. Forwarder margins remain pressured by volatile spot rates as 2026 vessel deliveries add 8-10% of global capacity, yet premium reefer and digital-visibility services create new pricing tiers that soften the impact of lower base freight rates.
Key Report Takeaways
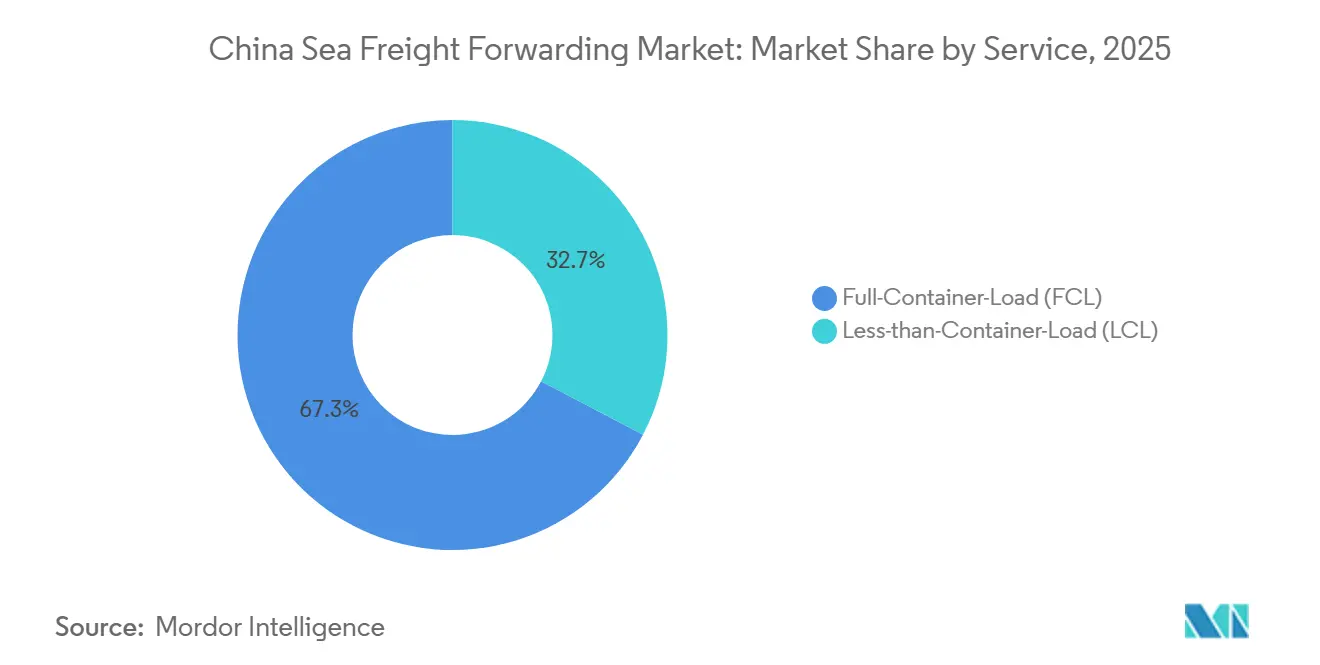
- By service, full-Container-Load captured 67.33% of the China sea freight forwarding market share in 2025, while LCL is projected to expand at a 7.53% CAGR through 2031.
- By cargo type, dry and general cargo accounted for a 75.63% of the China sea freight forwarding market size in 2025, whereas reefer containers are advancing at an 8.72% CAGR through 2031.
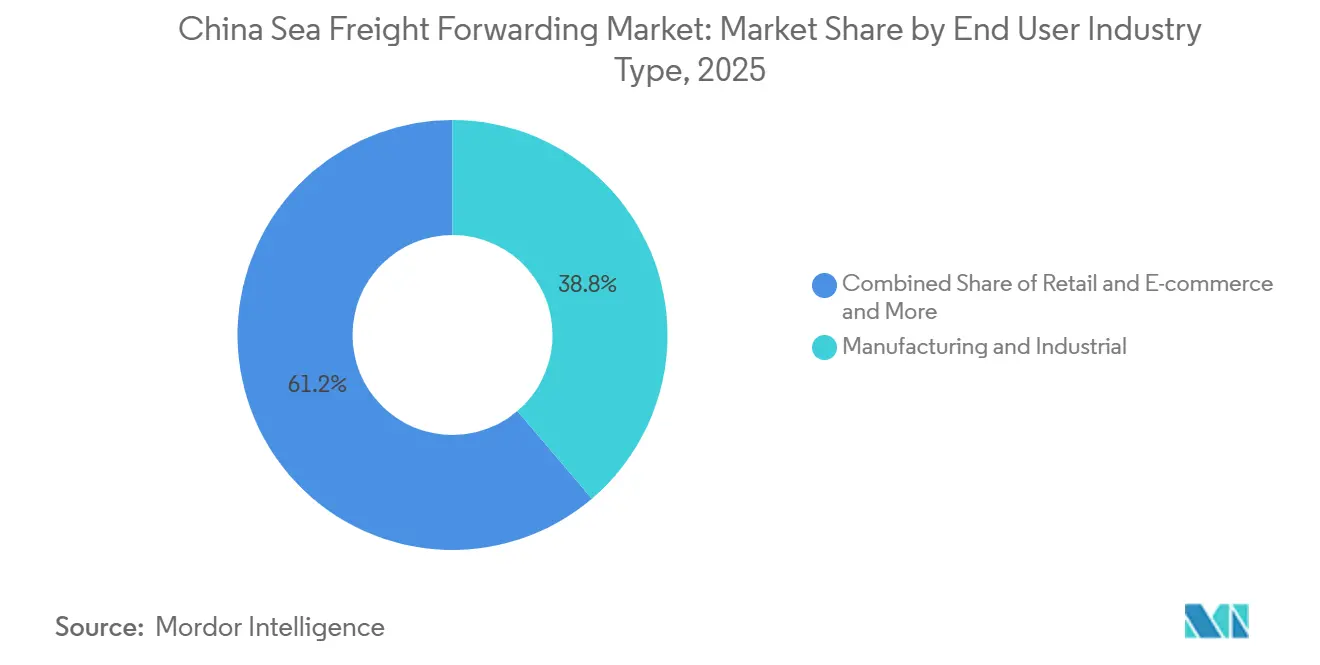
- By end user, the retail and e-commerce segment is forecast to grow at a 9.35% CAGR from 2026-2031, outpacing manufacturing and industrial shippers, which held 38.77% of the China sea freight forwarding market share in 2025.
- By geography, East China led the China sea freight forwarding market with 42.25% of the market share in 2025; the Southwest region is the fastest-growing, with a 6.99% CAGR to 2031.
Note: Market size and forecast figures in this report are generated using Mordor Intelligence’s proprietary estimation framework, updated with the latest available data and insights as of January 2026.
China Sea Freight Forwarding Market Trends and Insights
Drivers Impact Analysis*
| Driver | % Impact on CAGR Forecast | Geographic Relevance | Impact Timeline |
|---|---|---|---|
| Rising Cross-Border E-Commerce Export Volumes | +1.2% | East, South, Southwest (Guangdong, Zhejiang, Chongqing) | Medium term (2-4 years) |
| Regional Port Automation and Capacity Expansion in East/South Hubs | +0.8% | East (Shanghai, Ningbo-Zhoushan), South (Guangzhou, Shenzhen) | Long term (≥ 4 years) |
| Belt and Road Initiative Opening New Maritime Corridors | +0.6% | Southwest, Northwest, South (Beibu Gulf, Qinzhou) | Long term (≥ 4 years) |
| Digital Freight Platforms and E-Documentation Adoption | +0.5% | National, with early gains in Shanghai, Shenzhen, Chongqing | Short term (≤ 2 years) |
| Carbon-Neutral Procurement Mandates from Chinese Tech Giants | +0.4% | East, South (Alibaba/Cainiao hubs in Hangzhou, Shenzhen) | Medium term (2-4 years) |
| Pinglu Canal Unlocking Sea Access for Inland Guangxi Industries | +0.3% | Southwest (Guangxi, Nanning, Qinzhou) | Short term (≤ 2 years) |
| Source: Mordor Intelligence | |||
Rising Cross-Border E-Commerce Export Volumes
In 2025, China Customs reported cross-border e-commerce exports of RMB 2.75 trillion (USD 386 billion), a 69.7% increase from 2020. This surge has led to smaller order sizes, prompting forwarders to transition from full-container load workflows to more frequent LCL shipments, capitalizing on higher margins per TEU. The shift in logistics strategies reflects the growing complexity of e-commerce supply chains, driven by consumer demand for faster, more flexible delivery options. Additionally, the rise in LCL shipments has encouraged forwarders to adopt innovative solutions to optimize container utilization and reduce operational inefficiencies. These changes are reshaping the logistics landscape, requiring stakeholders to adapt to evolving market dynamics and consumer expectations.
In a nod to sustainability, Alibaba’s Cainiao not only eliminated 169,000 tons of packaging but also achieved 99% coverage with new-energy vehicles for 2025 distributions. This move underscores a broader trend: last-mile sustainability goals are now influencing upstream container operations. In Hangzhou and Shenzhen, bonded warehouses are streamlining operations with pre-clearance services. This innovation enables sellers to load containers on the same day an online order is made, trimming lead times by 2-3 days. Furthermore, forwarders utilizing API-linked customs filing can capture parcel data in real-time, leading to reduced dwell times and enhanced overall container utilization. These advancements highlight the ongoing transformation of the cross-border e-commerce logistics landscape, driven by technological integration, operational efficiency, and sustainability initiatives[1]“China to Expand Cross-Customs Return Policy for E-Commerce Exports.” 2026, State Council Information Office, english.scio.gov.cn.
Regional Port Automation and Capacity Expansion in East/South Hubs
In 2026, Shanghai's Xiaoyangshan automated terminal is set to boost its capacity by 11.6 million TEUs. Meanwhile, Guangzhou Nansha Phase IV, which commenced operations in February 2026, achieved a peak handling of 45,200 TEUs within a 24-hour span. These developments underscore China's commitment to enhancing its port infrastructure to accommodate growing trade volumes and improve operational efficiency. The expansion of these terminals is expected to play a pivotal role in strengthening China's logistics network and maintaining its competitive edge in global trade. Additionally, these advancements align with the broader trend of automation in the port sector, which is increasingly being adopted to streamline operations and reduce costs.
Over the same period, Ningbo-Zhoushan saw a 19.8% year-on-year increase, processing 7.987 million TEUs in January and February 2026. This growth followed the deepening of the Tiaozhoumen Channel, enabling 200,000-ton ships to transit at any tide, as highlighted by. Automation has proven to reduce labor per lift by up to 40%, but the high capital investment required favors state-owned ports and large forwarders with guaranteed berth windows. In contrast, smaller forwarders relying on non-automated terminals face operational challenges, including longer truck queues and higher drayage costs. These disparities highlight the growing divide in efficiency and cost-effectiveness between automated and non-automated terminals, further emphasizing the strategic importance of automation in the evolving port industry[2]“Announcement and Regulatory Framework for Export Control and Customs Declaration.” 2025, Ministry of Commerce (MOFCOM), english.mofcom.gov.cn.
Belt and Road Initiative Opening New Maritime Corridors
In 2025, the New International Land-Sea Trade Corridor, connecting 584 ports in 127 countries, reported a significant uptick, moving 1.425 million TEUs, marking a 47.6% year-on-year increase. This corridor has become a critical component of global trade, enhancing connectivity and efficiency. Chongqing, a pivotal player, manages over half of the western inland cargo, routing it to Qinzhou on the Beibu Gulf. Notably, these direct sailings bypass North Asian hubs, reducing transit times and costs for shippers. The corridor's development underscores the growing importance of integrated logistics solutions in facilitating international trade. It also highlights the strategic role of inland cities like Chongqing in driving trade flows and supporting regional economic growth.
The corridor's end-to-end rail-sea transit to Europe has become a game-changer, averaging just 19 days, almost double the speed of traditional all-water routes. This efficiency has made it an attractive option for businesses handling time-sensitive shipments. Freight forwarders, adept at coordinating bills of lading for both rail and ocean segments, can command premium rates for such services. However, they face the intricate challenge of navigating multi-jurisdictional bonding and liability transitions. As trade volumes continue to grow, the ability to manage these complexities will be crucial for maintaining seamless operations and meeting customer expectations. Additionally, the corridor's success demonstrates the potential of multimodal transport systems in optimizing supply chains and fostering global trade connectivity.
Digital Freight Platforms and E-Documentation Adoption
China's Single Window, boasting over 900 services, achieved a milestone with full paperless trade in 2025, slashing administrative workloads by 90%. This initiative has significantly streamlined trade processes, reducing delays and enhancing efficiency for businesses operating in the region. The platform's comprehensive service offerings have positioned it as a critical tool for modernizing China's trade infrastructure.
The blockchain bill-of-lading standard, JT/T 1517-2024, set to take effect in December 2024, not only eliminates courier fees but also facilitates cryptographic title transfers. Launched in December 2025, WallTech's CargoWareX platform consolidates booking, warehouse, and customs data into a single dashboard, providing forwarders with real-time visibility across various modes. Those who adopted early have managed to cut 24-48 hours from their door-to-door cycles, a significant advantage for e-commerce exporters vying for speed in deliveries. This time-saving capability is expected to drive further adoption among logistics providers aiming to stay competitive in a fast-paced market.
Restraints Impact Analysis*
| Restraint | % Impact on CAGR Forecast | Geographic Relevance | Impact Timeline |
|---|---|---|---|
| Freight-Rate Volatility and Vessel Overcapacity | -0.7% | Global, with acute pressure on transpacific and Asia-Europe lanes | Short term (≤ 2 years) |
| Geopolitical Trade Restrictions and Tariff Uncertainty | -0.5% | East, South (export-oriented provinces facing United States/EU tariffs) | Medium term (2-4 years) |
| Reefer-Equipment Repositioning Imbalances During Harvest Peaks | -0.2% | South, Southwest (agricultural export zones) | Short term (≤ 2 years) |
| Inland Depot Labor Shortages Causing Drayage Bottlenecks | -0.3% | East, Central (Yangtze River Delta, Pearl River Delta) | Medium term (2-4 years) |
| Source: Mordor Intelligence | |||
Freight-Rate Volatility and Vessel Overcapacity
The Shanghai Containerized Freight Index declined to 1,875.26 in April 2026, as the addition of newbuilds contributed approximately 2.4 million TEU, representing 8-10% of global capacity. This increase in capacity exerted downward pressure on Shanghai-Los Angeles spot rates, which fell to USD 2,239 per TEU. The oversupply in the market has created significant challenges for industry stakeholders, particularly in maintaining profitability amidst falling rates. The situation has also raised concerns about the long-term sustainability of freight rates, as carriers struggle to manage excess capacity effectively.
Forwarders bound by 2024 contracts are now renegotiating under pressure, seeking to adapt to the changing market dynamics. Meanwhile, those relying on spot rates face difficulties in accurately predicting margins due to the volatility. Additionally, alliance-driven blank sailings have left cargo stranded, leading to increased costs from rebooking and storage fees. These disruptions highlight the ongoing struggles within the shipping industry to balance supply and demand effectively. The market uncertainty has further complicated operational planning for both carriers and forwarders, adding to the industry's financial strain[3]“Export Control Law and Compliance Requirements for Export Goods.” 2025, Ministry of Commerce & General Administration of Customs, english.mofcom.gov.cn.
Geopolitical Trade Restrictions and Tariff Uncertainty
In 2024, the United States Section 301 tariffs increased duties on Chinese electric vehicles (EVs) to 100% and on semiconductors to 50%. In 2025, these tariffs expanded to include tungsten and polysilicon. These measures have significantly impacted trade dynamics, prompting importers to explore alternative strategies to mitigate costs and maintain supply chain efficiency. The higher tariffs have particularly affected industries reliant on these materials, leading to increased scrutiny of sourcing and procurement practices. Additionally, the tariffs have created market uncertainty, compelling businesses to reassess their long-term strategies and diversify their supplier base.
Importers have responded by relocating assembly operations to Vietnam and Mexico, reducing the volume of China-origin goods, although overall volumes from Asia remain unchanged. Freight forwarders are managing exclusion petitions, Harmonized Tariff Schedule (HTS) reclassifications, and variable landed costs, which contribute to higher administrative burdens and delays in booking cycles. These challenges have added complexity to logistics operations, requiring businesses to adapt quickly to the evolving trade environment. Furthermore, the shifting trade patterns have increased competition among alternative manufacturing hubs, driving up costs and straining existing infrastructure in these regions.
*Our forecasts treat driver/restraint impacts as directional, not additive. The impact forecasts reflect baseline growth, mix effects, and variable interactions.
Segment Analysis
By Service: LCL Growth Mirrors E-Commerce Momentum
Full-container-load services accounted for 67.33% of the China sea freight forwarding market size in 2025, yet the China sea freight forwarding market for LCL is projected to grow 7.53% annually to 2031. LCL consolidators operating bonded warehouses in Shenzhen, Shanghai, and Ningbo achieved 85-90% utilization, earning margins 15-20% above FCL rates. Digital platforms automate cargo matching, so forwarders without proprietary consolidation facilities cede revenue to software intermediaries. FCL remains essential for electronics and machinery but faces rate pressure from vessel overcapacity. Nippon Express-branded containers on the Shanghai-Osaka run show FCL players adding value with guaranteed equipment and integrated customs brokerage.
The LCL share rise indicates how the China sea freight forwarding market adapts to parcel-level exports. Cainiao and SF integrate domestic express with seaborne LCL, shrinking order-to-port times by 2-3 days. Forwarders leveraging API customs filing can clear mixed consignments faster, a feature that strengthens stickiness with small and midsize sellers that cannot fill a full box. FCL players pivot to value-added warehousing and multimodal bundles to counter commoditized liner rates[4]“China Unveils Measures to Boost Comprehensive Bonded Zones.” 2026, State Council & General Administration of Customs, english.www.gov.cn.


By Cargo Type: Reefer Outpaces Dry as Cold Chain Expands
Dry cargo dominated at 75.63% of the China sea freight forwarding market size in 2025, but reefer container volumes are forecast to grow 8.72% CAGR. Pharmaceuticals need continuous logging and GDP certification, lifting rates 30-40% above dry boxes. Fresh fruit and seafood exports face recurring shortages that drive up spot rates, but forwarders with reefer fleets lock in availability and cushion price swings.
Tariffs on semiconductors and electronics trim dry-cargo growth, yet the China sea freight forwarding market share for dry cargo stays high due to scale. Reefer networks still wrestle with harvest-season imbalances, leaving forwarders to reposition boxes at a cost. Scaling inland cold-stores and linking them to rail-reefer services will be critical to unlocking sustained reefer growth in coastal hubs.
By End User Industry: Retail and E-Commerce Lead Growth
Manufacturing accounted for 38.77% of the China sea freight forwarding market size in 2025, but retail and e-commerce are projected to grow 9.35% CAGR through 2031, the highest among segments. Cross-border platforms push direct-to-consumer parcels that favor LCL and value-added fulfillment. Bonded zones in Suzhou and Guangzhou permit same-day stuffing, helping sellers meet overseas delivery promises.
Electronics and semiconductors still anchor volumes, although the United States tariffs cap upside. Food and beverage, plus pharmaceuticals and healthcare, drive reefer demand, boosting margins for certified forwarders. Integrated players like Toll expand warehouses near apparel and healthcare clusters, blending storage, brokerage, and forwarding into one invoice to secure sticky contracts.
Geography Analysis
East China accounted for 42.25% of the 2025 value, supported by the Yangtze River Delta’s automated terminals and its 700-port global reach. Ningbo-Zhoushan added nearly 20% container growth early-2026, proving resilience despite tariff headwinds. The region’s electronics and machinery base fuels predictable FCL flows, while bonded warehouses in Suzhou enable rapid LCL stuffing for e-commerce. Coastal drayage congestion remains an issue during peak seasons, pushing some shippers inland to rail corridors. South China, anchored by Shenzhen and Guangzhou, benefits from Hong Kong trade finance and robust e-commerce exports. Automation at Nansha Phase IV trims handling cost, but rising labor and land prices squeeze smaller forwarders. Inland depots in the Pearl River Delta are facing driver shortages that are extending gate times, prompting carriers to pilot autonomous truck trials.
The Southwest logs the fastest 6.99% CAGR to 2031. The corridor funneled 1.425 million TEU in 2025, and the Pinglu Canal will accelerate growth by removing a costly truck leg. Chongqing processed 240 million tons of port cargo in 2025, leading western China. COSCO terminals in Beibu Gulf posted 11% year-on-year throughput gains, reflecting how sea access now starts hundreds of kilometers inland.
North and Northeast China grow slowly due to heavy-industry overcapacity, though Tianjin and Dalian post mid-single-digit TEU gains. Central China leverages Yangtze barge networks but remains secondary without deep-water berths. Northwest volumes hinge on rail to Europe, with limited maritime reach except via Lianyungang. Hainan’s Yangpu Port saw 65.4% growth in December 2025 on free-trade incentives, yet its absolute size is still small.
Competitive Landscape
State-owned groups SINOTRANS, COSCO Shipping Logistics, and China Merchants Logistics control nearly one-third of domestic flows through integrated port-to-truck assets. Global integrators scale up: DSV doubled its China footprint to 46 cities after the USD 14.3 billion Schenker acquisition in April 2025, creating the world’s second-largest forwarder. SF Holding’s USD 2.3 billion stake in Kerry Logistics forms Asia’s largest integrated logistics group, bundling forwarding, parcel, and last-mile services. Maersk opened a USD 140 million logistics center in Lin-gang to capture warehousing revenue and secure ocean contracts.
Thousands of small forwarders still chase spot cargo, yet carbon-reporting rules and digital platform fees raise break-even scale, driving mid-tier mergers. Technology is the new battleground: WallTech’s CargoWareX offers end-to-end control towers and APIs into China’s Single Window, favoring digitally fluent forwarders. Ports invest in hydrogen-electric tugs and 5G cranes, giving integrated carriers service reliability that pure brokers cannot match.
Niche opportunities concentrate in reefer and inland multimodal. Licensed GDP forwarders capture premium margins in pharma cold chains. Southwest corridors remain underserved by global players, letting regional specialists pick up volumes before global integrators deploy capacity. Asset-owning SITC ordered six 1,100-TEU ships for 2028 delivery, reducing alliance dependence and protecting schedule integrity.
China Sea Freight Forwarding Industry Leaders
SINOTRANS Limited
COSCO Shipping Logistics Co., Ltd.
China Merchants Logistics Group Co., Ltd.
SF Holdings (KEX-SF)
DHL Group
- *Disclaimer: Major Players sorted in no particular order

Recent Industry Developments
- February 2026: Ningbo-Zhoushan deepened the Tiaozhoumen Channel, enabling a 200,000-ton vessel transit at all tides.
- February 2026: Nippon Express launched NX Branded Containers on the Shanghai-Osaka route with 20-30 annual voyages.
- November 2025: Maersk opened a USD 140 million Lin-gang logistics center in Shanghai.
- August 2025: Toll Group formed a cross-border JV with Wise Express, adding three Greater Bay sites and one Shanghai facility.


China Sea Freight Forwarding Market Report Scope
| Full-Container-Load (FCL) |
| Less-than-Container-Load (LCL) |
| Dry/General |
| Reefer |
| Electronics and Semiconductors |
| Chemicals and Petrochemicals |
| Food and Beverage |
| Pharmaceuticals and Healthcare |
| Retail and E-commerce |
| Others |
| North |
| Northeast |
| East |
| Central |
| South |
| Southwest |
| Northwest |
| By Service | Full-Container-Load (FCL) |
| Less-than-Container-Load (LCL) | |
| By Cargo Type | Dry/General |
| Reefer | |
| By End User Industry | Electronics and Semiconductors |
| Chemicals and Petrochemicals | |
| Food and Beverage | |
| Pharmaceuticals and Healthcare | |
| Retail and E-commerce | |
| Others | |
| By Region | North |
| Northeast | |
| East | |
| Central | |
| South | |
| Southwest | |
| Northwest |


Key Questions Answered in the Report
How large will the China sea freight forwarding market be by 2031?
The China sea freight forwarding market size is projected to reach USD 88.41 billion by 2031, expanding at a 4.81% CAGR from 2026 to 2031.
Which service segment is growing fastest within Chinese sea forwarding?
Less-than-container-load services are forecast to grow at 7.53% annually through 2031 as e-commerce parcel volumes rise.
What cargo type is driving premium pricing for forwarders?
Reefer shipments for pharmaceuticals and fresh food are expanding at an 8.72% CAGR and command rates 30-40% higher than dry cargo.
Which region is the new growth hotspot for sea freight forwarding in China?
The Southwest, linked by the New International Land-Sea Trade Corridor and the upcoming Pinglu Canal, is forecast to grow at 6.99% CAGR to 2031.
How are digital platforms changing forwarding operations?
Blockchain bills of lading, China’s Single Window, and AI control towers like CargoWareX cut paperwork by up to 90% and shave one to two days off transit, improving margin and visibility.
Page last updated on:


