United States Retail Logistics Market Size and Share
Market Overview
| Study Period | 2020 - 2031 |
|---|---|
| Forecast Data Period | 2026 - 2031 |
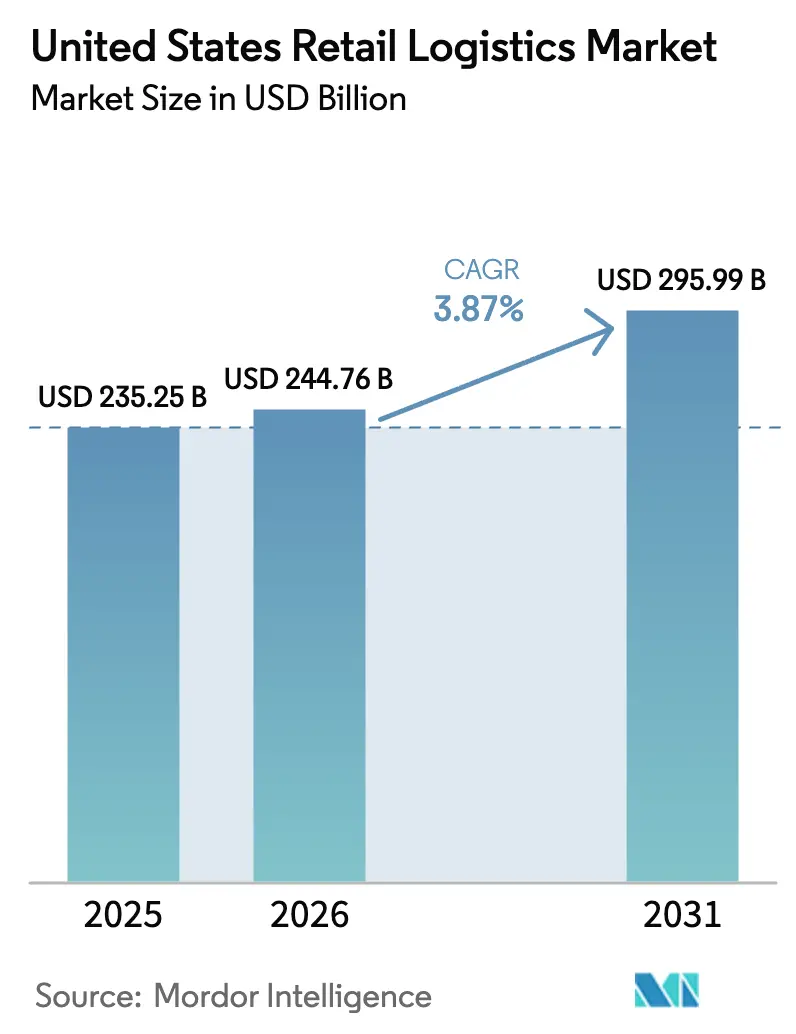
| Base Year Market Size (2025) | USD 235.25 Billion |
| Market Size (2026) | USD 244.76 Billion |
| Market Size (2031) | USD 295.99 Billion |
| Growth Rate (2026 - 2031) | 3.87% CAGR |
| Market Concentration | Medium |
Major Players *Disclaimer: Major Players sorted in no particular order Image © Mordor Intelligence. Reuse requires attribution under CC BY 4.0. | |
United States Retail Logistics Market Analysis by Mordor Intelligence
The United States retail logistics market size was valued at USD 235.25 billion in 2025 and is estimated to grow from USD 244.76 billion in 2026 to reach USD 295.99 billion by 2031, at a CAGR of 3.87% during the forecast period (2026-2031).
Retailers have begun converting stores into fulfillment nodes, temperature-controlled networks are expanding to serve complex biologics pipelines, and federal green-corridor programs are accelerating the shift toward electric line-haul fleets. Transportation services continue to anchor the United States retail logistics market, yet value-added offerings such as kitting, reverse logistics, and specialized packaging are taking share as brands differentiate on fulfillment experience. Rapid BOPIS adoption, nearshoring-driven inventory relocation, and real-time visibility platforms are reshaping asset placement and capital allocation decisions across the United States retail logistics market.
Key Report Takeaways
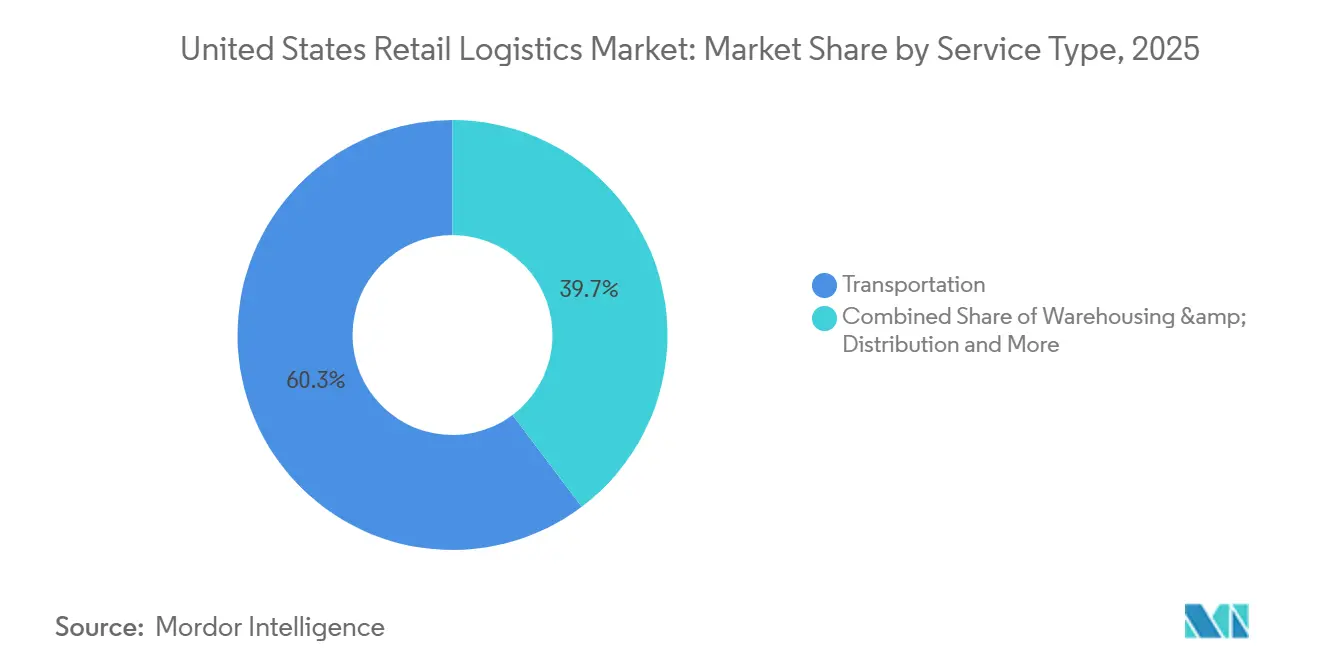
- By service type, transportation held 60.26% of the United States retail logistics market share in 2025, and value-added logistics is projected to expand at a 6.66% CAGR from 2026 to 2031.
- By product type, food and beverages led with 29.31% revenue share in 2025, while healthcare and pharmaceuticals are forecast to advance at a 7.04% CAGR through 2031.
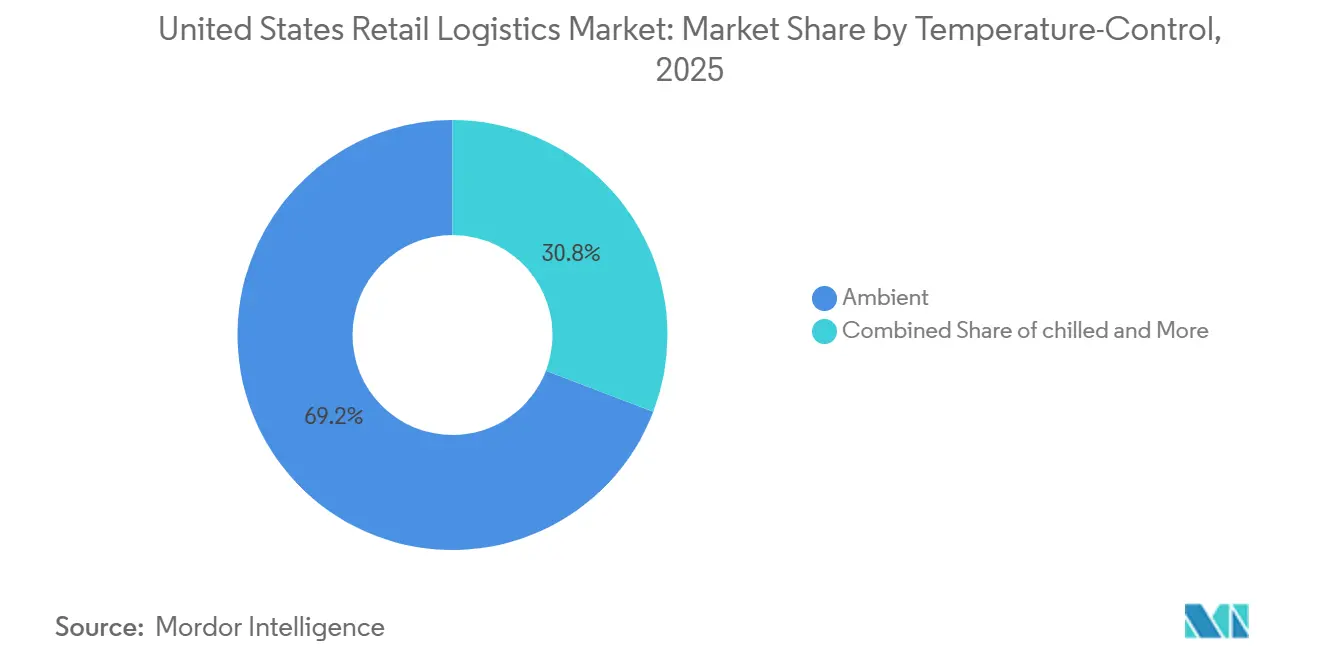
- By temperature-control requirement, ambient held 69.19% of the United States retail logistics market size, and frozen logistics is projected to expand at a 8.20% CAGR by 2031.
- By region, the South commanded 30.50% share of the United States retail logistics market size in 2025 and is set to grow at a 4.42% CAGR over 2026-2031.
Note: Market size and forecast figures in this report are generated using Mordor Intelligence’s proprietary estimation framework, updated with the latest available data and insights as of January 2026.
Worldwide, activity is shaped by contributions from multiple countries and regions, with United states representing one among them. The global report on retail logistics market by Mordor Intelligence reflects how these countries and regional layers combine into a single system.
United States Retail Logistics Market Trends and Insights
Drivers Impact Analysis*
| Driver | (~) % Impact on CAGR Forecast | Geographic Relevance | Impact Timeline |
|---|---|---|---|
| Omnichannel BOPIS Expansion | +1.1% | National suburban clusters | Short term (≤ 2 years) |
| Biologics-Led Ultra-Cold Demand | +0.8% | Boston, San Francisco, RTP hubs | Medium term (2-4 years) |
| Near-shoring & “Made in USA” Incentives | +0.7% | TX, AZ, CA, Rust Belt | Long term (≥ 4 years) |
| Real-Time Freight Visibility Platforms | +0.5% | Nationwide | Medium term (2-4 years) |
| Subscription-Driven Scheduled Delivery | +0.6% | Urban and suburban corridors | Short term (≤ 2 years) |
| Zero-Emission Truck Corridor Funding | +0.3% | I-5, I-95 major routes | Long term (≥ 4 years) |
| Source: Mordor Intelligence | |||
Omnichannel BOPIS (Buy-Online-Pick-Up-In-Store) Expansion
Buy-online-pick-up-in-store (BOPIS) continues to reshape suburban retail logistics by blending digital convenience with physical store networks. Retailers are increasingly redesigning store footprints to accommodate dedicated pickup zones, curbside lanes, and micro-fulfillment backrooms that enable rapid order staging. This model reduces last-mile delivery costs while increasing store traffic, as customers frequently make incremental purchases during pickup visits. The competitive pressure is intensifying as large chains invest in real-time inventory visibility and seamless app-based ordering, raising customer expectations for speed and reliability capabilities that smaller retailers often struggle to match. As suburban populations grow and e-commerce penetration deepens, BOPIS is becoming a default fulfillment option rather than a value-added service[1]Digital Commerce 360, “BOPIS: Buy Online, Pick Up in Store,” digitalcommerce360.com.
Biologics-Led Ultra-Cold Demand
The rapid growth of biologic drugs, cell and gene therapies, and mRNA-based treatments is driving demand for specialized ultra-cold storage and distribution infrastructure. These therapies often require strict temperature ranges, sometimes as low as -70°C, creating a need for advanced cold chain logistics, redundant power systems, and highly monitored transportation networks. Innovation clusters such as Boston, San Francisco, and Research Triangle Park (RTP) are seeing increased investment in temperature-controlled warehousing and last-mile delivery solutions tailored to healthcare providers and research institutions. The complexity of handling sensitive biologics is also pushing logistics providers to adopt real-time tracking, predictive risk management, and compliance-focused operations, elevating the overall sophistication and cost structure of pharmaceutical supply chains[2]BioSpace, “The Growing Importance of Cold Chain Logistics in Biopharma,” biospace.com.
Near-shoring & “Made in USA” Incentives
A combination of geopolitical risk, supply chain disruptions, and government incentives is accelerating the shift toward domestic manufacturing and near-shoring. Policies encouraging “Made in USA” production, particularly in sectors like semiconductors, electric vehicles, and advanced manufacturing, are driving demand for industrial space and logistics infrastructure across regions such as Texas, Arizona, California, and parts of the Rust Belt. This transition is reshaping freight flows, increasing the importance of inland distribution hubs, and shortening supply chains to improve resilience and reduce dependency on overseas suppliers. While the shift requires significant capital investment and time to scale, it is expected to create more stable, regionally concentrated logistics networks over the long term.
Real-Time Freight Visibility Platforms
Digital platforms that provide real-time freight visibility are transforming how goods move across supply chains. By integrating GPS tracking, IoT sensors, and cloud-based analytics, these systems give shippers and logistics providers end-to-end transparency on shipment location, condition, and estimated arrival times. This visibility reduces uncertainty, improves coordination across stakeholders, and enables proactive responses to disruptions such as delays or route changes. Adoption is accelerating nationwide as companies seek to optimize inventory levels, enhance customer service, and reduce detention and dwell times. Over time, these platforms are evolving into predictive tools, using data to forecast bottlenecks and automate decision-making, thereby increasing efficiency and resilience across the freight ecosystem.
Restraints Impact Analysis*
| Restraint | (~) % Impact on CAGR Forecast | Geographic Relevance | Impact Timeline |
|---|---|---|---|
| Industrial Real-Estate Vacancy Lows | -0.6% | Inland Empire, DFW, Chicago, NJ | Short term (≤ 2 years) |
| Rising Cargo Theft & Insurance Costs | -0.4% | CA, TX, FL corridors | Medium term (2-4 years) |
| Cyber-Security Vulnerabilities | -0.3% | National cloud TMS/WMS users | Medium term (2-4 years) |
| Persistent Chassis Shortages | -0.2% | LA/LB, NY/NJ, Savannah, Houston | Short term (≤ 2 years) |
| Source: Mordor Intelligence | |||
Industrial Real Estate Vacancy Lows
Persistently low vacancy rates across major logistics hubs such as the Inland Empire, Dallas-Fort Worth, Chicago, and Northern New Jersey are constraining supply chain expansion. With available warehouse space at historic lows, tenants face rising lease rates, limited location choice, and longer lead times for securing capacity. This imbalance is particularly acute for modern, high-clearance facilities suited for e-commerce and automation, which remain in short supply. As a result, occupiers are forced into suboptimal locations or older assets, increasing transportation inefficiencies and operating costs. In the short term, these constraints limit network scalability and delay expansion plans, especially for fast-growing retailers and third-party logistics providers[3]CoStar, “US Industrial Vacancy Rate Edges Up to 5.6% in Q3,” costar.com.
Rising Cargo Theft & Insurance Costs
Cargo theft is becoming a more organized and technology-enabled threat, particularly along high-volume freight corridors in California, Texas, and Florida. Criminal networks increasingly use tactics such as identity fraud, load interception, and cyber-enabled shipment diversion, targeting high-value and easily resalable goods. In response, insurers are raising premiums, tightening coverage terms, and in some cases withdrawing from high-risk routes altogether. Shippers and carriers are being pushed to invest in enhanced security measures such as GPS tracking, secure parking, and vetted carrier networks, which adds cost and operational complexity. Over the medium term, these pressures erode margins and may lead to rerouting or reshaping of freight flows toward safer, but less efficient, corridors.
*Our forecasts treat driver/restraint impacts as directional, not additive. The impact forecasts reflect baseline growth, mix effects, and variable interactions.
Segment Analysis
By Service Type: Value-Added Capabilities Command Premium Growth
Transportation services generated 60.26% of the 2025 United States retail logistics market share. Value-added offerings, kitting, reverse logistics, and labeling are increasing at 6.66% CAGR, reflecting retailers’ shift toward differentiated fulfillment. Integrated partnerships now bundle transportation, warehousing, and customization, reducing hand-offs and improving visibility.
Warehouse operators embed light-manufacturing stations, returns centers, and package-level personalization inside distribution hubs. Brands pay premiums for these capabilities because customer experience metrics such as delivery accuracy and returns turnaround directly drive loyalty. This shift is transforming warehouses from cost centers into value-generating nodes within the supply chain. As a result, operators who can integrate speed, customization, and data visibility are gaining a competitive edge in both B2B and direct-to-consumer markets.


By Temperature-Control Requirement: Frozen Segment Surges on Biologics Demand
Ambient logistics held 69.19% of the 2025 United States retail logistics market size, yet frozen capacity grew fastest at 8.20% CAGR, spurred by biologics needing -80 °C to -196 °C handling. Supply remains tight: national cold-store vacancy is below 4%, spurring expansions and IPO funding rounds for specialists.
New “ultra-cold” micro-depots near biotech clusters underpin the rising United States retail logistics market size for healthcare shipments. Operators differentiate through GDP certification, redundant power, and real-time temperature telemetry, while advanced inventory management and automated handling systems reduce spoilage and accelerate delivery. Strategic partnerships with last-mile carriers are increasingly key to meeting tight cold-chain SLAs and expanding service coverage.
By Product Type: Food and Beverages Leads, Healthcare & Biologics Surge
Food and beverages retain the 29.31% of the United States retail logistics market size in 2025, supported by extensive ambient, chilled, and frozen networks serving a nationwide population. Healthcare and pharmaceuticals lead growth at 7.04% CAGR through 2031, fuelled by biologics, specialty pharmacy expansion, and direct-to-patient delivery. GDP-compliant facilities, real-time temperature monitoring, chain-of-custody tracking, and regulatory expertise create high barriers to entry.
Strategic acquisitions like UPS’s CAD 2.2 billion (USD 1.6 billion) Andlauer Healthcare deal and European cold chain specialists Frigo-Trans and BPL underscore the premium for specialized logistics. Aging demographics and personalized medicine adoption ensure sustained demand largely insulated from economic cycles. Electronics benefit from e-commerce, but face margin pressure, apparel and footwear adapt to fast-fashion cycles, and furniture grows moderately through housing trends and white-glove omnichannel delivery.
Geography Analysis
Regional logistics performance varies significantly across the United States. The South leads with a 30.50% market share in 2025 and 4.42% CAGR through 2031, driven by port access, manufacturing concentration, and business-friendly regulations. Texas dominates with over USD 1 trillion in annual freight through Houston and rail networks, benefiting from nearshoring and CHIPS Act-driven investments. Florida’s population growth and tourism create specialized demand, while Georgia offers strong air freight connectivity and over 70 shovel-ready industrial sites despite deferred water infrastructure.
The Northeast handles high freight volumes due to dense population and imports via the Port of New York/New Jersey (9.5 million TEUs in 2023), though industrial vacancy is under 3%. The Midwest leverages central geography and Class I rail networks, with Chicago managing over 25% of the United States intermodal volume despite congestion. The West is the gateway for Asian imports, with LA/Long Beach handling 40% of containerized shipments, but congestion, chassis shortages, and higher costs drive some cargo to Gulf and East Coast ports.
The Southwest’s growth has slowed as vacancies normalize and labor tightens, though Arizona benefits from stable power and semiconductor-related infrastructure. Interstate commerce accounts for nearly 60% of shipment value, highlighting the need for multi-regional networks capable of navigating infrastructure constraints and regulatory differences.
Competitive Landscape
The United States retail logistics market is moderately fragmented but seeing accelerating consolidation, as integrated carriers, specialized 3PLs, and tech-enabled brokers compete across overlapping segments while targeting high-margin niches. Cold storage is concentrated, with Lineage Logistics and Americold controlling 71% of top-market capacity following Lineage’s USD 4.4 billion IPO and Americold’s USD 1.74 billion acquisition of Agro Merchants Group. Transportation remains fragmented, though the top 25 for-hire carriers capture 35% of revenue, expanding through acquisitions and organic growth[4]Pharma Commerce, “The Future of Cold Chain Logistics in Biopharma,” pharmacommerce.com.
Competition is intensified by e-commerce giants like Amazon, operating 750,000+ warehouse robots and delivering over 2 billion same- or next-day items, directly challenging traditional 3PLs. Strategic acquisitions increasingly target specialized capabilities in healthcare logistics, automation, and cross-border trade rather than scale alone, exemplified by DSV’s EUR 14.3 billion (USD 16.7 billion) Schenker deal and UPS’s CAD 3+ billion (USD 2.19+ billion) healthcare acquisitions. Technology is now a key differentiator: 87% of providers invest in real-time visibility, predictive AI, and warehouse automation to drive cost and efficiency advantages. White-space opportunities remain in rural delivery, mid-market BOPIS fulfillment, and zero-emission fleets supported by IIJA corridor funding.
United States Retail Logistics Industry Leaders
UPS
FedEx
DHL Group
C.H. Robinson
XPO Inc.
- *Disclaimer: Major Players sorted in no particular order


Recent Industry Developments
- March 2026: Amazon deploys ultra fast (1 hour and 3 hour) delivery windows in hundreds of United States cities marked a service innovation pushing instant delivery benchmarks.
- November 2025: UPS completed the acquisition of AHG, strengthening its cold chain, pharma, and specialized logistics services.
- November 2025: C.H. Robinson expanded its cross-border logistics footprint with more than 450,000 ft² of warehousing and cross-docking capacity in El Paso, Texas, bringing its United States–Mexico gateway footprint to over 2 million ft².
- January 2025: UPS finalized the Frigo-Trans and BPL purchases, cementing a pan-European pharma network.


United States Retail Logistics Market Report Scope
| Transportation | Road |
| Air | |
| Rail | |
| Sea | |
| Warehousing and Distribution | |
| Value-Added Services and Others (Kitting, Packaging, Labeling) |
| Cold Chian | Ambient (15-25 °C) |
| Chilled (2–8 °C) | |
| Frozen (Less than 0 °C) | |
| Non Cold Chain |
| Food and Beverages |
| Apparel and Footwear |
| Electronic Appliances |
| Healthcare and Pharmaceuticals |
| Furniture and Home Furnishings |
| Others |
| Northeast |
| Midwest |
| Southeast |
| Southwest |
| West |
| By Service Type | Transportation | Road |
| Air | ||
| Rail | ||
| Sea | ||
| Warehousing and Distribution | ||
| Value-Added Services and Others (Kitting, Packaging, Labeling) | ||
| By Temperature-Control Requirement | Cold Chian | Ambient (15-25 °C) |
| Chilled (2–8 °C) | ||
| Frozen (Less than 0 °C) | ||
| Non Cold Chain | ||
| By Product Type | Food and Beverages | |
| Apparel and Footwear | ||
| Electronic Appliances | ||
| Healthcare and Pharmaceuticals | ||
| Furniture and Home Furnishings | ||
| Others | ||
| By Region (United States) | Northeast | |
| Midwest | ||
| Southeast | ||
| Southwest | ||
| West | ||


Key Questions Answered in the Report
What CAGR is projected for the United States retail logistics market between 2026 and 2031?
The market is forecast to expand at 3.87% CAGR from 2026 to 2031.
Which service type is growing fastest within United States retail logistics?
Value-added logistics services such as kitting and reverse logistics are advancing at 6.66% CAGR through 2031.
Why is frozen capacity surging in United States retail logistics?
Demand from biologics, cell, and gene therapies that need ultra-cold storage is pushing frozen logistics capacity to an 8.20% CAGR.
Which United States region leads retail logistics revenue?
The South holds 30.50% of 2025 revenue, benefiting from port access, population inflows, and nearshoring-driven manufacturing growth.
How are retailers using stores to cut logistics costs?
Many chains fulfill online orders through in-store BOPIS and curbside pickup, eliminating the last-mile leg and increasing basket size.
What recent M&A deals signal consolidation in United States retail logistics?
Major examples include DSV’s EUR 14.3 billion (USD 16.7 billion) purchase of Schenker and UPS’s CAD 2.2 billion (USD 1.60 billion)acquisition of Andlauer Healthcare.
Page last updated on:


