
Carbonated Soft Drinks Market Size and Share
Market Overview
| Study Period | 2021 - 2031 |
|---|---|
| Market Size (2026) | USD 336.04 Billion |
| Market Size (2031) | USD 439.84 Billion |
| Growth Rate (2026 - 2031) | 5.53 % |
| Fastest Growing Market | Asia-Pacific |
| Largest Market | North America |
| Market Concentration | Medium |
Major Players *Disclaimer: Major Players sorted in no particular order Image © Mordor Intelligence. Reuse requires attribution under CC BY 4.0. | |
Carbonated Soft Drinks Market Analysis by Mordor Intelligence
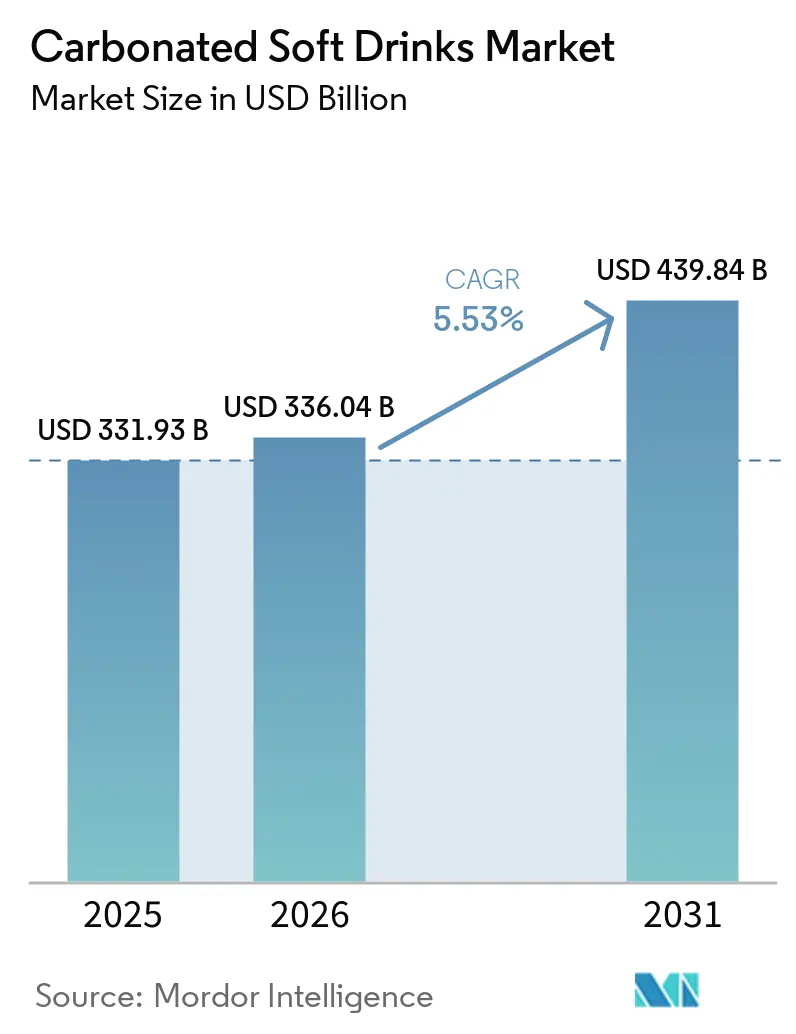
The carbonated soft drink market size is projected to be USD 331.93 billion in 2025, USD 336.04 billion in 2026, and reach USD 439.84 billion by 2031, growing at a CAGR of 5.53% from 2026 to 2031. This growth trajectory translates to a CAGR of 5.53% from 2026 to 2031. The market's momentum is bolstered by a robust value mix. Innovations like zero-sugar launches and functional enhancements are driving revenue, even in regions where unit volumes remain steady. While mature countries continue to be significant consumption hubs, South and Southeast Asia are rapidly expanding their packaged beverage footprint, unveiling fresh demand pools. Both PepsiCo and Coca-Cola are pivoting towards functional claims, zero-sugar extensions, and localized flavor introductions. These strategies are pivotal in retaining current consumers and re-engaging those who've drifted away from soda. The market is witnessing broader usage in foodservice and convenience sectors. In emerging nations, refillable formats are not only making beverages more affordable but also safeguarding profit margins amidst rising packaging costs. The competitive landscape is buzzing, highlighted by Keurig Dr Pepper's spotlight on beverage asset values through its transaction with JDE Peet’s. Yet, challenges loom with sugar taxes and shelf rationalization exerting pressure on full-calorie products and smaller players.
Key Report Takeaways
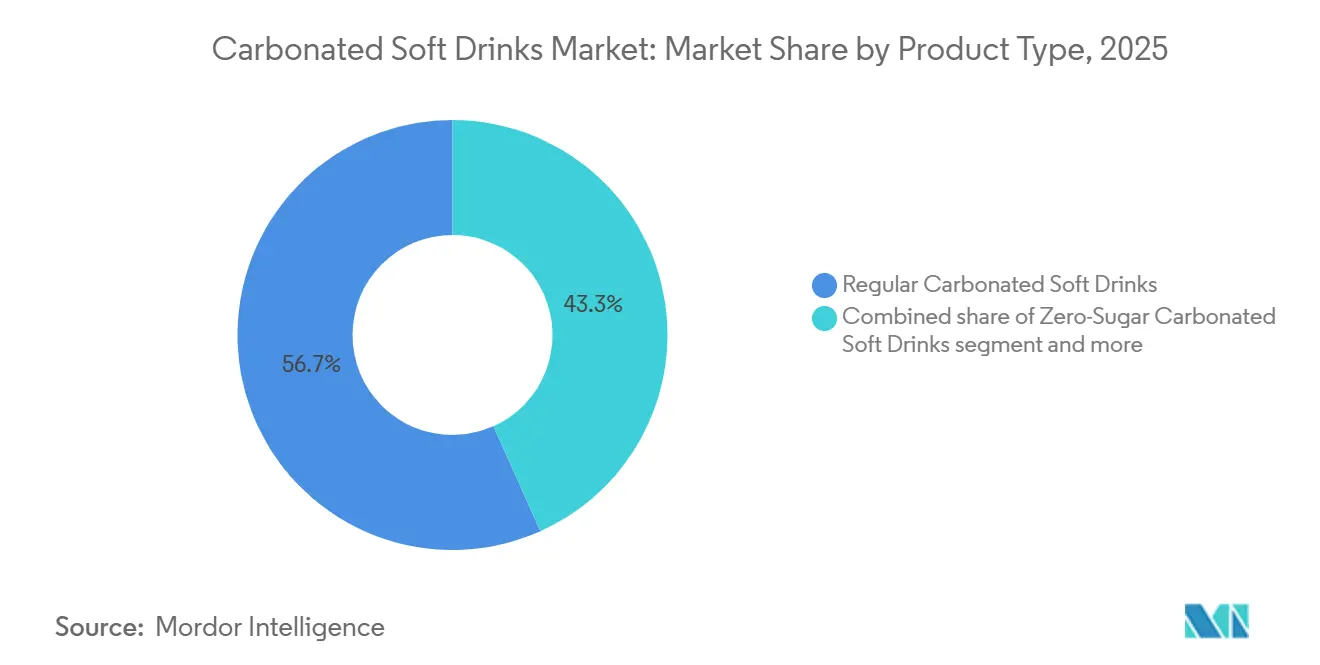
- By product type, regular carbonated soft drinks accounted for the largest share of the carbonated soft drinks market, at 56.71% in 2025, while zero-sugar carbonated soft drinks are projected to grow at the fastest CAGR of 6.96% during 2026-2031.
- By flavor, cola accounted for the largest share of the carbonated soft drinks market, at 43.62% in 2025, while berry flavors are projected to grow at the fastest CAGR of 6.11% during 2026-2031.
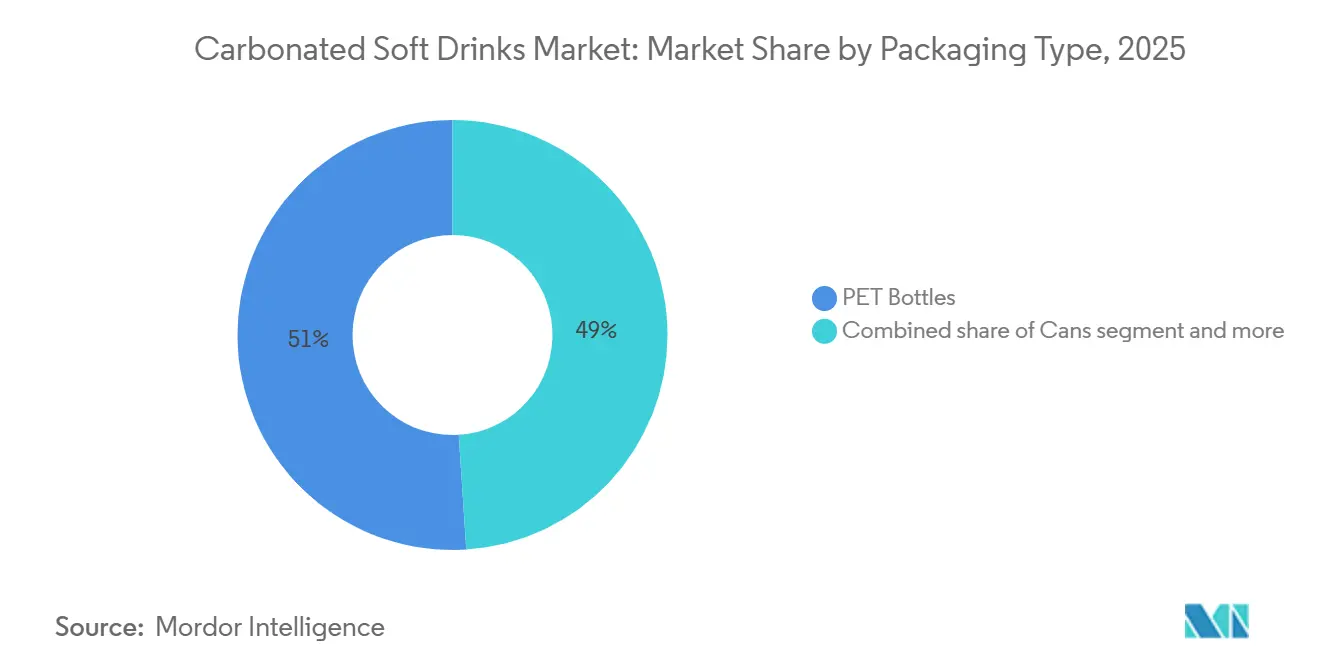
- By packaging type, PET bottles accounted for the largest share of the carbonated soft drinks market, at 51.01% in 2025, while cans are projected to grow at the fastest CAGR of 6.73% during 2026-2031.
- By distribution channel, retail accounted for the largest share of the carbonated soft drinks market, at 65.13% in 2025, while foodservice is projected to grow at the fastest CAGR of 7.51% during 2026-2031.
- By geography, North America accounted for the largest share of the carbonated soft drinks market, at 36.40% in 2025, while Asia-Pacific is projected to grow at the fastest CAGR of 6.58% during 2026-2031.
Note: Market size and forecast figures in this report are generated using Mordor Intelligence’s proprietary estimation framework, updated with the latest available data and insights as of January 2026.
Market Trends and Insights
Drivers Impact Analysis of Carbonated Soft Drinks Market*
| Driver | (~) % Impact on CAGR Forecast | Geographic Relevance | Impact Timeline |
|---|---|---|---|
| Premiumization of Low and Zero-Sugar Carbonates | +1.5% | Global, the highest intensity in North America and Western Europe | Medium term (2–4 years) |
| Expansion of Foodservice Fountain and On-The-Go Consumption | +1.0% | North America, the Asia-Pacific urban centers, and the Middle East | Short term (≤ 2 years) |
| Flavor Localization and Limited-Edition Rotations | +0.8% | Global, highest traction in North America and Asia-Pacific | Short term (≤ 2 years) |
| Returnable and Refillable Packaging Economics in Emerging Markets | +0.6% | South America, MEA, South and Southeast Asia | Long term (≥ 4 years) |
| Convenience-Oriented Consumption Patterns | +0.7% | Global, concentrated in North America, and urban Asia-Pacific | Short to medium term (1–3 years) |
| Advancements in Packaging Technologies | +0.5% | Global, early deployment in Europe and North America | Medium term (2–4 years) |
| Source: Mordor Intelligence | |||
Premiumization of low and zero sugar carbonates
Major portfolios have shifted their focus, with zero-sugar and reduced-calorie carbonated soft drinks (CSDs) now serving as the primary value drivers. The premium pricing of these variants is significantly shaping the overall revenue mix of the segment. In Q1 2026, Pepsi Zero Sugar not only gained traction but also saw an uptick in both volume and value shares within the CSD category. Meanwhile, in February 2026, Coca-Cola Zero Sugar made headlines by integrating into flavored sub-lines, such as Cherry Float, signaling a strategic pivot. The brand's core architecture is now being restructured, positioning zero-sugar as the primary growth driver, overshadowing the traditional full-calorie variant. A 2025 study in BMC Public Health highlighted the impact of tiered soft drink taxes in France, Portugal, and the UK[1]Source: BMC Public Health, “Tiered Soft Drink Taxes and Sugar Reformulation in France, Portugal, and the UK,” BMC Public Health, link.springer.com. The research noted tangible reductions in average sugar content, with the UK leading the charge, achieving a notable drop of about 1.7 grams of sugar per 100 ml. This suggests that companies in taxed regions are not just complying but are also enhancing their reformulation processes. They're establishing systems for sweetener sourcing, flavor masking, and labeling, which are then effectively utilized in markets without such taxes. This indicates a broader trend: the premiumization of zero-sugar variants is transcending its initial regulatory confines. Furthermore, evolving compliance measures, like the EU's nutrition labeling and front-of-pack health claims, are shaping the narrative around zero-sugar products, bolstering their clear-label appeal.
Expansion of foodservice fountain and on-the-go consumption
Fountain dispensers and single-serve portable formats are broadening the occasions for daily consumption of carbonated soft drinks (CSDs), extending beyond traditional grocery and home settings. This shift is generating an additional volume layer that doesn't directly compete with packaged retail. In Canada, the 12 months leading up to December 2025 saw a 6% year-on-year increase in fountain soft drink purchases, predominantly driven by quick-service restaurants. PepsiCo's Q1 2026 investor report highlighted growth in both volume and net revenue for its away-from-home segment. This boost was largely thanks to enhanced brand placements via its DRIPS by Pepsi platform, notably in chains like Saucy! by KFC. A significant trend is emerging: fountain channels are evolving into experimental platforms. Limited-edition flavors are first introduced through dispensers, allowing companies to assess consumer interest before committing to packaged retail SKUs. This approach effectively trims down the costs associated with innovation. In January 2026, Coca-Cola rolled out 7.5-oz mini cans in convenience stores, pricing them individually at USD 1.29. This strategy not only taps into the impulse snack-and-drink market but also encourages trials among consumers hesitant to buy multi-packs.
Flavor localization and limited-edition rotations
Limited-edition and culturally inspired flavor rotations are acting as dynamic tools, boosting shelf velocity and maintaining interest in the CSD category. This approach avoids the need for permanent SKU expansions, which could strain distribution networks and trade inventories. Coca-Cola's February 2026 nationwide launch of Cherry Float, Zero Sugar Cherry Float, and the US and Canada’s permanent reintroduction of Diet Coke Cherry underscore how nostalgia-driven launches can transform passive brand loyalty into urgent, time-sensitive purchases[2]Source: The Coca-Cola Company, “Cherry Flavor Expansion in the United States and Canada,” The Coca-Cola Company, coca-colacompany.com. PepsiCo's Dirty Mountain Dew aims to mainstream the social media-fueled "dirty soda" trend, while its June 2026 MUG Root Beer Floats Vanilla Howler showcases the rapid translation of cultural food trends into carbonated concepts. Limited-edition rotations are outpacing permanent SKU launches in driving incremental sales for retailers. Retailers, having optimized shelf space for base brands, are now prioritizing premium displays for these urgency-driven seasonal variants. Meanwhile, regulatory moves, like front-of-pack labeling rules in the EU, Australia, and Brazil, are subtly influencing which flavor-health pairings can be marketed as wellness-oriented. This narrows the functional innovation scope for flavor developers, but doesn't close it off entirely.
Returnable and refillable packaging economics in emerging markets
In emerging markets, refillable PET and glass bottle systems are becoming economically significant in CSD distribution, primarily as a countermeasure to rising packaging input costs, rather than solely for sustainability reasons. In Latin America, especially in Brazil, Mexico, Colombia, and Argentina, refillable bottle initiatives are not only reducing material costs per unit compared to single-use PET formats but are also integral to the distribution networks of major players like Arca Continental, Coca-Cola FEMSA, and Postobón. These companies cater to hundreds of millions across the region. The financial advantage of refillable markets is most pronounced during fluctuations in aluminum and PET prices: when global input costs surge, South American and certain South Asian producers with established refillable systems face less cost pressure per unit than those in North America and Europe, allowing them to offer more competitive retail prices. Coca-Cola Europacific Partners' investment of EUR 1.5 million (around USD 1.7 million at April 2026 rates) in three German plants to roll out a 0.85-liter rPET bottle – bridging the gap between single-serve and larger formats – underscores the growing economic appeal of returnable and low-material packaging, even in high-end European markets. This trend elevates refillable systems from being seen as a mere solution for emerging markets to a universally applicable cost-efficiency strategy, especially as the costs of sustainability compliance continue to climb.
Restraints Impact Analysis of Carbonated Soft Drinks Market*
| Restraint | (~) % Impact on CAGR Forecast | Geographic Relevance | Impact Timeline |
|---|---|---|---|
| Sugar Tax Drag in High-Consumption Markets | -0.8% | Europe, North America, the Middle East, and Africa (Nigeria, South Africa, UAE, Saudi Arabia) | Medium term (2–4 years) |
| Volume Erosion from Still Water, RTD Tea, and Functional Beverages | -1.2% | Global, most acute in North America and Western Europe | Short to medium term (1–3 years) |
| Aluminum Can and PET Cost Volatility | -0.5% | Global, most acute in North America, Europe, and Japan | Short term (≤ 2 years) |
| Retail Shelf Rationalization Against Lower-Margin Carbonates | -0.4% | North America, Western Europe | Medium term (2–4 years) |
| Source: Mordor Intelligence | |||
Sugar tax drag in high-consumption markets
As of 2025, the WHO's annual report on sugar-sweetened beverage (SSB) taxation reveals that over 100 jurisdictions worldwide have enacted such taxes[3]Source: World Health Organization, “Sugar-Sweetened Beverage Taxation Report 2025,” World Health Organization, who.int. These measures are noticeably curbing the volume of full-calorie carbonated soft drinks (CSDs) in many of the globe's top-consuming markets. In South Africa, the Health Promotion Levy led to a 33% drop in sugar consumption from taxed beverages just two years post-implementation. However, this was somewhat countered by a 15% uptick in consumption of non-taxable SSBs. This trend underscores that while fiscal measures can dampen demand for CSDs, they don't entirely eradicate it. For brand operators, this presents a strategic insight: tiered levy structures introduce a price ladder effect, hastening the shift of consumers towards premium zero-sugar options. This shift occurs at a speed that marketing efforts alone might find challenging, thereby shortening the window for managing the lifecycle of full-calorie SKUs. Moreover, a less frequently highlighted outcome is that investments funded by the levy, like reformulations, new sweetener systems, and adjustments to production lines, create sunk-cost barriers. These barriers nudge brands towards permanent reformulations instead of mere compliance. Furthermore, with ongoing regulatory pressures from governments and health frameworks aligned with the WHO, markets that once sidestepped SSB levies are now feeling the heightened political costs of resisting their adoption.
Volume erosion from still water, RTD tea, and functional beverages
Non-carbonated alternatives, not rival brands, are the primary competitive pressure on carbonated soft drink (CSD) volumes. These alternatives are capturing hydration moments from consumers who prioritize clean-label products. Offerings like still water, ready-to-drink (RTD) teas, and functional beverages, such as kombucha and prebiotic sodas, are collectively diminishing daily CSD consumption. They do this by providing low or zero-calorie hydration, avoiding the health concerns tied to traditional carbonated drinks. In 2025, PepsiCo's acquisition of prebiotic soda brand Poppi was touted as a move to position PepsiCo as a frontrunner in the modern soda landscape. This acquisition underscores the reality: functional non-carbonated and lightly carbonated drinks now occupy premium shelf spaces, a position not easily defended by an organic CSD portfolio alone. The challenge is pronounced in the 18-34 age group, which increasingly views carbonated drinks as occasional treats rather than daily hydration. This shift in behavior has led to a decline in per-capita consumption frequency, even if overall product preference remains intact. In 2026, PepsiCo's bubly sparkling water brand ventured into the full-flavor soda market with bubly POP in Canada. This move highlights a trend: sparkling water brands are encroaching on CSD territory, blurring competitive lines and complicating volume forecasts at the sub-category level.
*Our forecasts treat driver/restraint impacts as directional, not additive. The impact forecasts reflect baseline growth, mix effects, and variable interactions.
Carbonated Soft Drinks Market Segment Analysis
By Product Type:
Zero-Sugar Variants Reshape the Category's Value MixIn 2025, Regular Carbonated Soft Drinks commanded a dominant 56.71% market share, underscoring the continued prominence of full-calorie formats and dispelling notions of a structural decline in the category. Meanwhile, Zero-Sugar Carbonated Soft Drinks emerged as the frontrunner, boasting a robust 6.96% CAGR from 2026 to 2031. This growth, outpacing the broader market, is attributed to strategic portfolio shifts by industry leaders and a clear consumer tilt towards reduced-calorie choices. Highlighting this trend, PepsiCo's Q1 2026 investor insights revealed a surge in both volume and value share for Pepsi Zero Sugar within the CSD realm. Concurrently, Coca-Cola's strategic emphasis on zero-sugar variants in its Cherry lineup underscores a collective industry pivot, with both giants heavily investing in this burgeoning sub-category.
Diet Carbonated Soft Drinks are navigating a pivotal shift: as consumers grow wary of artificial sweeteners, there's a marked shift in new product investments. Instead of the traditional "diet" label, brands are gravitating towards "zero-sugar" branding, offering the same low-calorie appeal but shedding the negative associations tied to sweeteners. While Functional Carbonated Soft Drinks currently occupy the smallest volume segment, their unique positioning at the crossroads of refreshment and wellness, highlighted by PepsiCo's Pepsi Prebiotic Cola and the poppi acquisition, commands a premium value-per-unit, outstripping all other sub-segments. However, as the EU's nutrition labeling reforms and health-claim restrictions in various markets shape the narrative around functional claims, navigating these regulatory waters becomes paramount for any launch strategy in this sub-segment.



By Flavor:
Cola Dominance Coexists With Berry MomentumFrom 2026 to 2031, berry flavors are set to be the fastest-growing sub-segment, expanding at a CAGR of 6.11%. Their rise is fueled by younger consumers gravitating towards vibrant, non-traditional tastes. Additionally, these flavors seamlessly align with zero-sugar formulations, where their intensity compensates for the lack of full-calorie sweetness. In 2025, cola commanded a dominant 43.62% share of the flavor segment, a position bolstered by decades of brand equity and a distribution scale that newer flavors find hard to match profitably. Yet, this supremacy faces challenges as brands increasingly integrate cherry and berry sub-variants into their core offerings. PepsiCo's Q1 2026 results spotlighted Pepsi Wild Cherry's robust growth, underscoring its contributions to both volume and value shares. Meanwhile, Coca-Cola's February 2026 expansion of its multi-SKU Cherry portfolio signals a shared vision: both giants view these berry-adjacent flavors as a fundamental evolution of the cola experience, rather than mere niche additions.
Lemon and lime flavors, while holding a steady secondary position, benefit from their status as restaurant fountain staples. Their resemblance to sparkling water profiles offers them a buffer against the encroachment of non-carbonated substitutes. Meanwhile, the "Other Flavors" category, which includes tropical, root beer, spiced, and seasonal variants, is capitalizing on a limited-edition rotation strategy. A prime example is PepsiCo's June 2026 launch of MUG Root Beer Floats Vanilla Howler, blending a classic American soda flavor with a trendy 'dirty soda' aesthetic, showcasing the industry's knack for weaving cultural food trends into carbonated concepts.
By Packaging Type:
Can Momentum Challenges PET's Volume LeadCans are emerging as the fastest-growing packaging format, projected to register a CAGR of 6.73% from 2026 to 2031. This surge is fueled by a premium on-premise perception, enhanced portability, and a recycling narrative that resonates with sustainability-conscious retail buyers and ESG-driven procurement. In 2025, PET Bottles commanded a significant 51.01% market share, underscoring their cost efficiency and versatility across various retail configurations, from small-serve to multi-liter, a flexibility that cans currently struggle to match at a competitive cost. Crown Holdings has introduced its SuperEnd lightweight beverage can end, which slashes aluminum use by about 10% compared to traditional designs. This innovation is gaining traction among high-volume CSD producers, allowing them to manage rising per-unit aluminum costs without altering their consumer-facing packaging. In June 2026, Pepsi Max unveiled its thermochromic "Perfect Chilled" can, which turns a vivid blue at 8°C, the brand's optimal drinking temperature. This move underscores the increasing trend of active packaging as a tool for consumer engagement, broadening the brand experience beyond just the beverage.
KHS Group's Faktor 101 PET bottle concept, which trims material use by 30% and is compatible with 100% recycled PET, indicates that the lightweighting trend in PET is nearing a pivotal point. Here, material savings could counterbalance the capital costs of transitioning to recycled content. This shift is poised to hasten compliance with EU mandates on single-use plastics, a pressing concern for CSD producers. Meanwhile, other packaging formats, such as glass bottles and cartons, continue to hold their ground in premium and institutional segments. Here, the perceived enhancement in product quality justifies the additional cost.
By Distribution Channel:
Foodservice Outpaces Retail GrowthFrom 2026 to 2031, the foodservice sector is set to dominate the carbonated soft drink market, boasting a robust CAGR of 7.51%. This surge is fueled by a resurgence in away-from-home consumption, the rapid rise of quick-service restaurants (QSRs) across Asia-Pacific and the Middle East, and the strategic use of fountain formats for brand promotion and flavor testing. In 2025, retail channels held a commanding 65.13% market share, largely thanks to the pivotal role of supermarkets and hypermarkets. These retail giants not only drive volume throughput, ensuring the viability of large-format packaging, but also bolster daily promotional activities. PepsiCo's Q1 2026 disclosures highlighted a thriving away-from-home segment, with net revenue and volume growth. Notably, their DRIPS platform has seamlessly integrated branded fountain experiences into KFC's “Saucy!”, a strategy fostering frequent brand interactions in dining settings where carbonated soft drinks (CSDs) are a staple in meal deals.
In the retail landscape, online channels are outpacing traditional brick-and-mortar stores, especially for multi-pack and specialty formats. Meanwhile, convenience stores are riding the wave of single-serve premiumization, a trend underscored by Coca-Cola's January 2026 rollout of 7.5-oz mini cans in c-stores. Data from Ipsos Foodservice Monitor reveals that in 2025, Canadian consumers bought 427 million fountain soft drinks, marking a 6% year-on-year increase. This trend positions fountain drinks as the leading cold beverage in foodservice, underscoring the channel's deep-rooted and habitual consumption patterns.
Geography Analysis
North America Carbonated Soft Drinks Market
In 2025, North America commanded a dominant 36.40% share of the carbonated soft drink market, solidifying its status as the leading regional player. The region enjoys robust per-capita consumption rates, bolstered by the daily integration of convenience stores and quick-service restaurants into consumers' beverage purchasing habits. While the North American carbonated soft drink market sees growth, it's more about refining mixes than broadening volumes, with zero-sugar extensions outpacing traditional offerings. Keurig Dr. Pepper's transaction completion with JDE Peet's in April 2026, coupled with its strategic pivot towards a North American refreshment focus, underscores the region's allure for strategic capital and heightened competitive attention. Canada's strong fountain culture and Mexico's emphasis on refillable packaging, bolstering affordability and local bottling systems, further cement North America's beverage significance.
Europe Carbonated Soft Drinks Market
Europe stands as a pivotal revenue hub for the carbonated soft drink market, yet it's intricately influenced by taxation, packaging regulations, and a pronounced divide between premium zero-sugar and value full-calorie purchases. A 2025 study by BMC Public Health highlighted the impact of tiered taxes in the UK, France, and Portugal, noting a reduction in average sugar content, with the UK leading at a drop of 1.7 grams per 100 ml. This underscores the direct influence of tax structures on product formulation. Germany, Italy, and France emerge as key volume centers, while the region's policy trajectory nudges producers towards recycled content, refillable systems, and comprehensive packaging compliance. Thus, Europe's carbonated soft drink market is as much a product of regulatory shifts and packaging economics as it is of flavor and brand dynamics.
APAC, South America and MEA Carbonated Soft Drinks Market
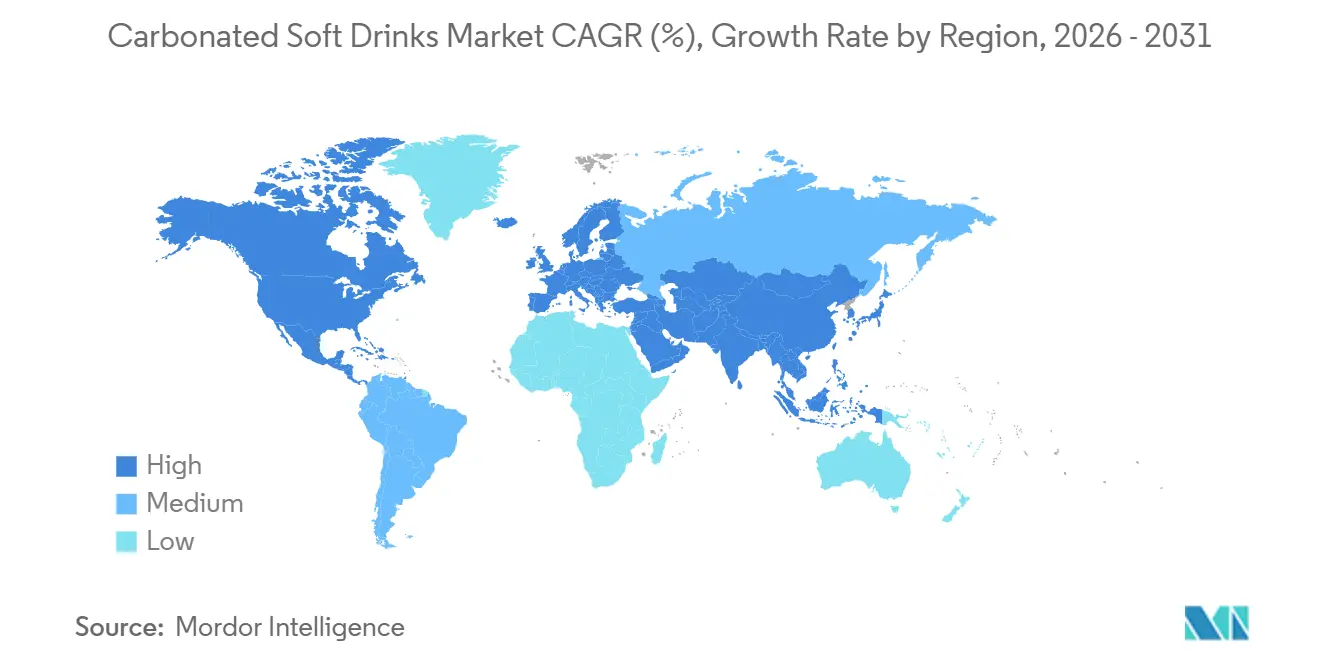
Asia-Pacific is set to lead the carbonated soft drink market with a projected CAGR of 6.58% from 2026 to 2031. Japan's Soft Drink Association highlighted a record-setting domestic sale of carbonated drinks at JPY 4.73 trillion (USD 31.3 billion) in 2024, showcasing the harmonious advance of premiumization and value demand. With their youthful demographics, increasing urbanization, and enhanced access to convenience, India and Southeast Asia present the most promising volume growth opportunities. South America, particularly in nations like Brazil, Colombia, and Argentina, leverages refillable bottle systems to maintain affordability, granting local leaders a structural cost edge. While the Middle East and Africa remain smaller players, they're bolstered by the expansion of quick-service restaurants. South Africa's experience with sugar levies reshaping beverage formulation and demand in major urban markets further highlights the region's evolving dynamics.

Competitive Landscape
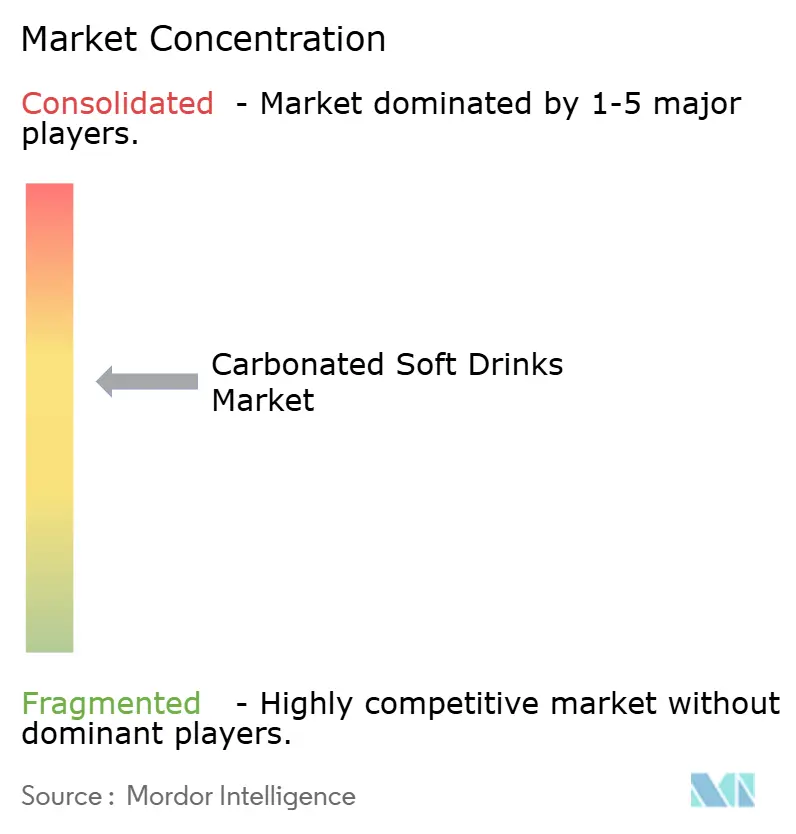
Coca-Cola and PepsiCo dominate the carbonated soft drink market, leveraging their brand depth, extensive bottling reach, and a versatile pricing strategy that caters to both mass and premium tiers. Following its April 2026 acquisition of JDE Peet’s and a strategic split into two U.S.-listed entities, one focusing on North American refreshment beverages and the other on global coffee, Keurig Dr. Pepper has emerged as a formidable contender. This strategic pivot intensifies competition in flavored carbonates and alternative cola formats, particularly in North America, bolstering Dr. Pepper's position. The market also features regional bottlers and local players who maintain their share through refillable systems, route density, and taste portfolios tailored to local preferences.
In regions where local distribution trumps global brand advertising, players like Arca Continental, Coca-Cola FEMSA, Postobón, and Anadolu Grubu hold significant sway. Refresco introduces another competitive dimension, backing private-label and contract manufacturing models, enabling retailers to engage in the carbonated soft drink arena without establishing comprehensive brand systems. Opportunities in the market are emerging in functional carbonated formats, premium localized flavors, and sustainable packaging solutions that align with retailer procurement priorities. PepsiCo’s February 2026 launch of Pepsi Prebiotic Cola underscores the industry's effort to meld soda familiarity with wellness, while Coca-Cola’s Cherry Float introduction highlights the power of flavor innovation in reviving familiar trademarks.
Coca-Cola's initiative in France and Germany, piloting glue-dot bonded PET multipacks with recyclable cardboard handles as a sustainable alternative to plastic shrink wrap, underscores the evolving role of packaging as a competitive edge. Suntory Beverage and Food Limited and Britvic are fortifying their regional franchises by delving deeper into health-centric carbonates and adjacent refreshment sectors. While emerging craft and prebiotic brands may be modest in size, they are steering the carbonated soft drink market's trajectory, with larger firms eyeing them as swift conduits to health-conscious consumers. This dynamic leaves the market dominated by scale leaders, yet open to the influence of smaller innovators on product design, acquisition strategies, and category messaging.
Carbonated Soft Drinks Industry Leaders
The Coca-Cola Company
PepsiCo, Inc.
Keurig Dr Pepper Inc.
Monster Beverage Corporation
Suntory Beverage and Food Limited
- *Disclaimer: Major Players sorted in no particular order
Carbonated Soft Drinks Market Companies Covered in this Report
- The Coca-Cola Company
- PepsiCo, Inc.
- Keurig Dr Pepper Inc.
- Monster Beverage Corporation
- Suntory Beverage and Food Limited
- Britvic plc
- Refresco Group B.V.
- Arca Continental, S.A.B. de C.V.
- Coca-Cola FEMSA, S.A.B. de C.V.
- Parle Agro Private Limited
- National Beverage Corp.
- Jones Soda Co.
- Postobón S.A.
- Anadolu Grubu A.S.
- Asahi Soft Drinks Co., Ltd.
- Red Bull GmbH
- Nestlé S.A.
- SodaStream International Ltd.
- Dr Pepper Snapple Group, Inc.
- Faygo Beverages, Inc.

Recent Industry Developments in Carbonated Soft Drinks Market
- April 2026: Keurig Dr Pepper completed its acquisition of JDE Peet's, securing approximately 96.22% of shares at EUR 31.85 per share for an aggregate value of approximately EUR 14.9 billion (approximately USD 15.8 billion). The transaction marks the largest global beverage merger and acquisition deal of recent years and sets in motion a planned separation into two independent US-listed companies.
- February 2026: PepsiCo launched Pepsi Prebiotic Cola nationwide in the US, the first legacy cola brand to incorporate prebiotic fiber, available in Original Cola and Cherry Vanilla flavors with 30 calories, 5 grams of sugar, and 3 grams of prebiotic fiber per can. The launch followed a sold-out, limited online debut in November 2025 and positions PepsiCo at the intersection of legacy cola and functional wellness categories.
- February 2026: The Coca-Cola Company expanded its Cherry portfolio in the US and Canada with the nationwide rollout of Coca-Cola Cherry Float, Coca-Cola Zero Sugar Cherry Float, and the permanent return of Diet Coke Cherry, with all three SKUs including zero-sugar options, reflecting the brand's strategy of migrating its most equity-rich flavor extensions toward low-calorie formats as the primary growth channel.


Global Carbonated Soft Drinks Market Report Scope
A carbonated soft drink is a non-alcoholic beverage that contains dissolved carbon dioxide gas (CO₂), which creates its characteristic effervescence or fizz. The global carbonated soft drinks market is segmented by product type, flavor, packaging type, distribution channel, and geography. By product type, the market is segmented into regular, diet, zero-sugar, and functional carbonated soft drinks. By flavor, the market is segmented into cola, lemon and lime, berry, and other flavors. By packaging type, the market is segmented into PET bottles, cans, and other packaging types. By distribution channel, the market is segmented into foodservice and retail. The retail segment is further sub-segmented into supermarkets/hypermarkets, convenience stores, online retail, and other distribution channels. By geography, the market is segmented into North America, Europe, Asia-Pacific, South America, and the Middle East and Africa. The Market Forecasts are Provided in Terms of Value (USD).
| Regular Carbonated Soft Drinks |
| Diet Carbonated Soft Drinks |
| Zero-Sugar Carbonated Soft Drinks |
| Functional Carbonated Soft Drinks |
| Cola |
| Lemon and Lime |
| Berry |
| Other Flavors |
| PET Bottles |
| Cans |
| Other Packaging Types |
| Foodservice | |
| Retail | Supermarkets/Hypermarkets |
| Convenience Stores | |
| Online Retail | |
| Other Distribution Channels |
| North America | United States |
| Canada | |
| Mexico | |
| Rest of North America | |
| Europe | United Kingdom |
| Germany | |
| France | |
| Italy | |
| Spain | |
| Sweden | |
| Belgium | |
| Poland | |
| Netherlands | |
| Rest of Europe | |
| Asia-Pacific | China |
| Japan | |
| India | |
| Thailand | |
| Singapore | |
| Indonesia | |
| South Korea | |
| Australia | |
| Rest of Asia-Pacific | |
| South America | Brazil |
| Argentina | |
| Colombia | |
| Peru | |
| Chile | |
| Rest of South America | |
| Middle East and Africa | United Arab Emirates |
| South Africa | |
| Saudi Arabia | |
| Nigeria | |
| Egypt | |
| Morocco | |
| Turkey | |
| Rest of Middle East and Africa |
| Product Type | Regular Carbonated Soft Drinks | |
| Diet Carbonated Soft Drinks | ||
| Zero-Sugar Carbonated Soft Drinks | ||
| Functional Carbonated Soft Drinks | ||
| Flavor | Cola | |
| Lemon and Lime | ||
| Berry | ||
| Other Flavors | ||
| Packaging Type | PET Bottles | |
| Cans | ||
| Other Packaging Types | ||
| Distribution Channel | Foodservice | |
| Retail | Supermarkets/Hypermarkets | |
| Convenience Stores | ||
| Online Retail | ||
| Other Distribution Channels | ||
| Geography | North America | United States |
| Canada | ||
| Mexico | ||
| Rest of North America | ||
| Europe | United Kingdom | |
| Germany | ||
| France | ||
| Italy | ||
| Spain | ||
| Sweden | ||
| Belgium | ||
| Poland | ||
| Netherlands | ||
| Rest of Europe | ||
| Asia-Pacific | China | |
| Japan | ||
| India | ||
| Thailand | ||
| Singapore | ||
| Indonesia | ||
| South Korea | ||
| Australia | ||
| Rest of Asia-Pacific | ||
| South America | Brazil | |
| Argentina | ||
| Colombia | ||
| Peru | ||
| Chile | ||
| Rest of South America | ||
| Middle East and Africa | United Arab Emirates | |
| South Africa | ||
| Saudi Arabia | ||
| Nigeria | ||
| Egypt | ||
| Morocco | ||
| Turkey | ||
| Rest of Middle East and Africa | ||


Key Questions Answered in the Report
What is the current outlook for the carbonated soft drink market through 2031?
The carbonated soft drink market stood at USD 336.04 billion in 2026 and is projected to reach USD 439.84 billion by 2031 at a 5.53% CAGR.
Which product category is expanding fastest in carbonated soft drinks?
Zero-Sugar Carbonated Soft Drinks are the fastest-growing product type, with a projected 6.96% CAGR from 2026 to 2031.
Why are zero-sugar products becoming more important for soda companies?
They support premium pricing, improve revenue mix, and align better with sugar-tax pressure and evolving health expectations in many countries.
Which region leads global sales, and which region is growing fastest?
North America led with 36.40% of 2025 revenue, while Asia-Pacific is expected to grow the fastest at a 6.58% CAGR through 2031.
Page last updated on:





