Market Overview
| Study Period | 2021 - 2031 |
|---|---|
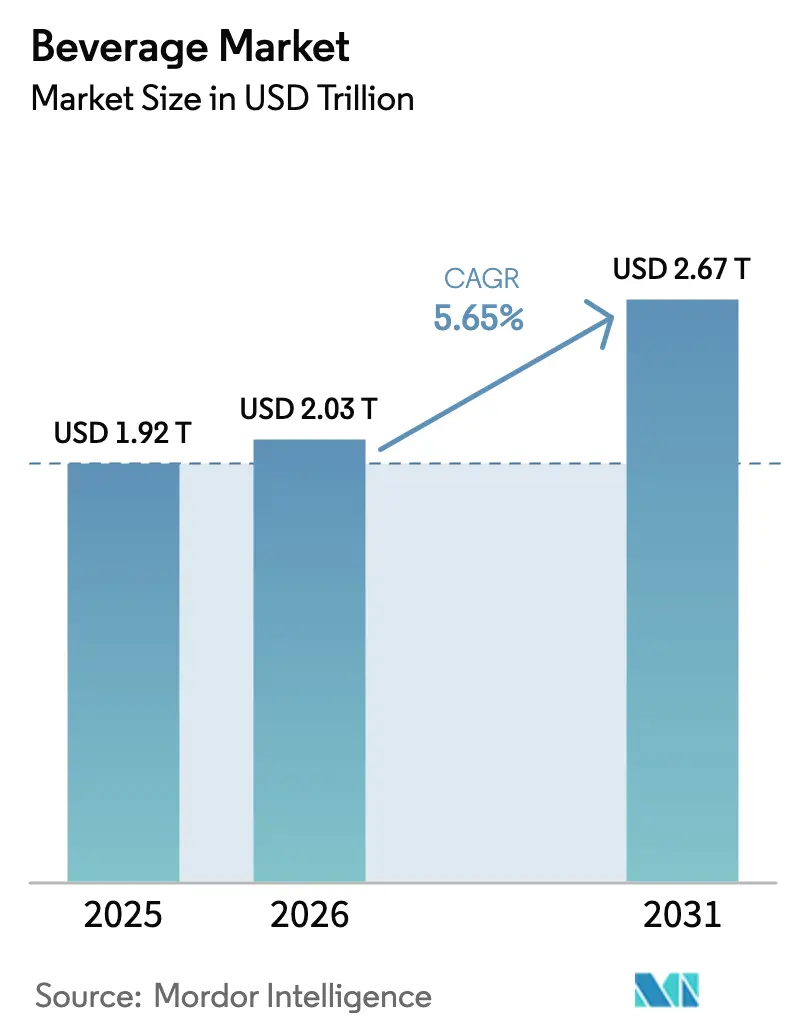
| Market Size (2026) | USD 2.03 Trillion |
| Market Size (2031) | USD 2.67 Trillion |
| Growth Rate (2026 - 2031) | 5.65% CAGR |
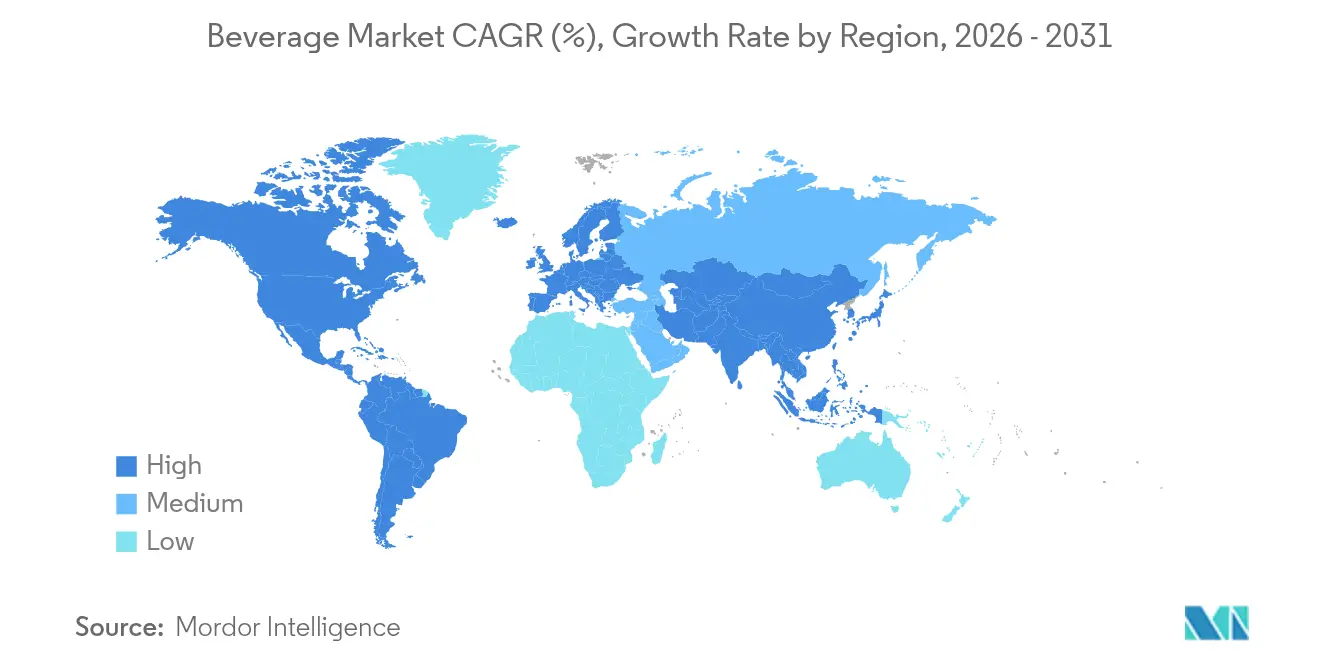
| Fastest Growing Market | Asia-Pacific |
| Largest Market | North America |
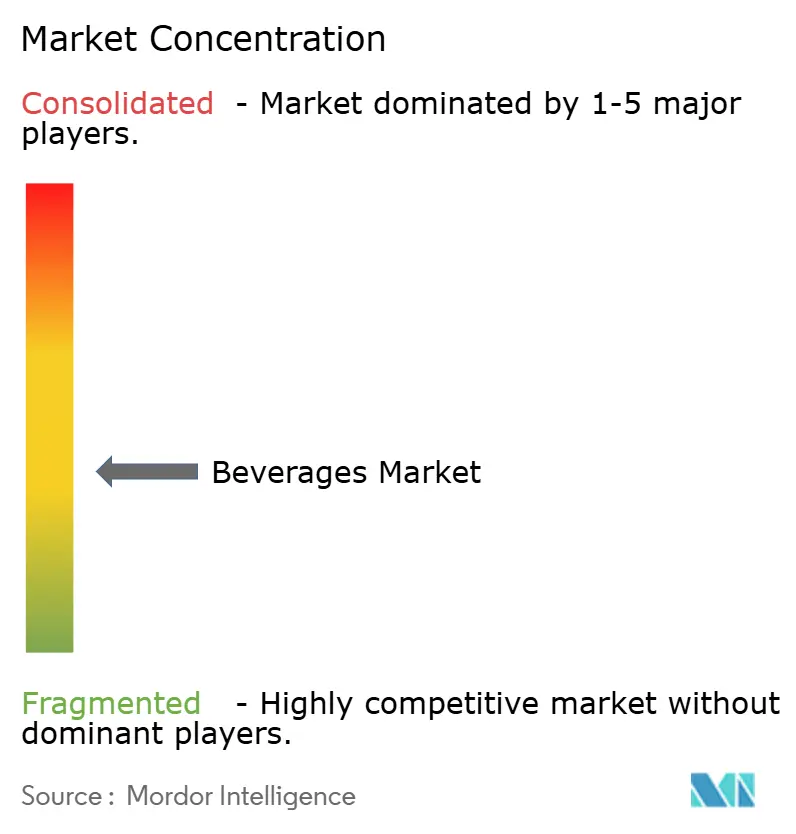
| Market Concentration | Medium |
Major Players
*Disclaimer: Major Players sorted in no particular order Image © Mordor Intelligence. Reuse requires attribution under CC BY 4.0. |
|
Beverage Market Analysis by Mordor Intelligence
Beverage market size in 2026 is estimated at USD 2.03 trillion, growing from 2025 value of USD 1.92 trillion with 2031 projections showing USD 2.67 trillion, growing at 5.65% CAGR over 2026-2031. This beverage market growth is driven by increasing health awareness, premium product demand, and Sustainability concerns that are reshaping packaging choices. Non-alcoholic drinks like functional waters and prebiotic sodas are becoming popular, while premium alcoholic beverages help maintain profits despite inflation. Sustainability requirements are changing packaging trends, with recycled PET and lightweight aluminum cans becoming more common. AI-driven product development, plant-based proteins, and convenient urban formats are speeding up new product launches. In terms of product type, non-alcoholic beverages are growing, balancing the scale of the alcoholic market. For packaging type, recycled PET and lightweight aluminum cans are gaining traction. Energy-boosting products are growing faster than traditional hydration in applications, and on-trade channels increasingly support off-trade distribution. The market is moderately fragmented, with key players including The Coca-Cola Company, PepsiCo Inc., and Bacardi Limited.
Key Report Takeaways
- By product type, alcoholic beverages held 63.78% of the global beverage market share in 2025, while non-alcoholic beverages are growing at a 6.05% CAGR to 2031.
- By packaging type, PET bottles accounted for 61.60% of the global beverage market size in 2025; cans are advancing at a 5.75% CAGR through 2031.
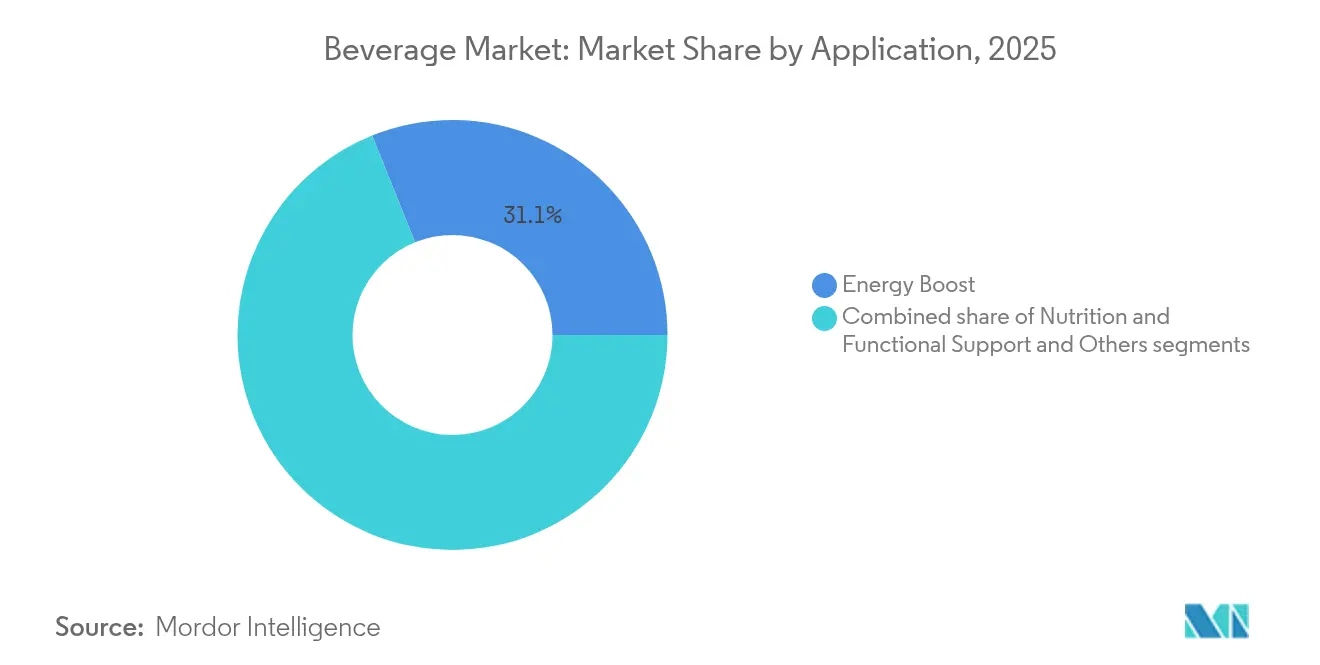
- By application, energy boost captured a 31.10% share of the global beverage market size in 2025, whereas the nutritional and functional support segment is expanding at a 6.95% CAGR.
- By distribution channel, off-trade commanded 71.85% of the global beverage market share in 2025; on-trade is rebounding at a 5.80% CAGR through 2031.
- By geography, North America led with 38.75% revenue share in 2025, yet Asia-Pacific is set to grow at a 5.90% CAGR to 2031.
Note: Market size and forecast figures in this report are generated using Mordor Intelligence’s proprietary estimation framework, updated with the latest available data and insights as of 2026.
Global Beverage Market Trends and Insights
Drivers Impact Table*
| DRIVER | (~) % IMPACT CAGR FORECAST | GEOGRAPHIC RELEVANCE | IMPACT TIMELINE |
|---|---|---|---|
| Rapid urban-on-the-go consumption culture | +0.8% | Global, with Asia-Pacific and urban centers leading | Medium term (2-4 years) |
| Premiumisation in alcoholic and functional drinks | +1.2% | North America and Europe, expanding to Asia-Pacific | Long term (≥ 4 years) |
| Social consumption trends are driving demand for experiential beverages | +0.6% | Global, with 108+ countries implementing | Short term (≤ 2 years) |
| Health consciousness is boosting demand for functional and low-sugar beverages | +0.4% | Europe core, spill-over to North America | Medium term (2-4 years) |
| Sustainability concerns are reshaping packaging choices | +0.7% | North America and Europe, expanding globally | Medium term (2-4 years) |
| Urban lifestyles are increasing demand for ready-to-drink formats | +0.3% | Global, technology-advanced markets first | Long term (≥ 4 years) |
| Source: Mordor Intelligence | |||
Social consumption trends are driving demand for experiential beverages
Social consumption trends are boosting demand for unique beverage experiences, driving the growth of the global beverage market. Younger generations, like Millennials and Gen Z, want more than just a drink; they seek unique flavors, indulgence, and social experiences. For example, a survey by Alcohol Org in July 2025 found that 47% of men and 40% of women binge drank to celebrate the New Year. Similarly, men and women over the age of 20 reported drinking an average of at least two drinks on Halloween[1]Source: Alcohol Org, "Booziest Holidays", alcohol.org. Innovations like unusual flavor combinations (such as chocolate, chili pepper, and botanicals) are attracting adventurous consumers. Ready-to-drink (RTD) cocktails and low or no-alcohol beverages are also becoming more popular as people look for options that fit their lifestyle and health goals. These trends highlight a shift toward beverages that offer new flavors, health benefits, and social enjoyment, making experiential consumption a key factor in the beverage market growth.
Urban lifestyles are increasing demand for ready-to-drink formats
Urban lifestyles, influenced by busy work schedules, long commutes, and more dual-income households, are driving higher demand for ready-to-drink (RTD) beverages. As of 2024, the World Bank reported that 57.3% of the global population lived in urban areas, showing a growing number of consumers looking for convenient drink options[2]Source: World Bank, "Urban Population (% of total population) - World", worldbank.org. These fast-paced routines are increasing the popularity of pre-mixed, grab-and-go beverages that are both functional and flavorful. For example, in 2024, Más+ by Messi was launched as a functional RTD drink with electrolytes, vitamins, and antioxidants. This product is designed as a low-calorie, performance-enhancing option, catering to health-conscious urban consumers who need quick and effective hydration to keep up with their busy lifestyles. Such products are becoming increasingly popular as they align with the needs of modern urban living in the beverage market.
Health consciousness is boosting demand for functional and low-sugar beverages
Health consciousness is driving a growing demand for functional and low-sugar beverages in the market. Consumers are increasingly aware of the health risks associated with high sugar intake, such as obesity, diabetes, heart disease, and dental issues. According to the International Food Information Council (IFIC) Survey, as of 2024, 66% of American consumers are actively trying to reduce their sugar consumption[3]Source: International Food Information Council Org, "2024 IFIC Food and Health SURVEY", ific.org. This shift has led to a rising preference for beverages that provide health benefits, such as added vitamins, minerals, probiotics, or plant-based ingredients, while maintaining low sugar levels. In response, many beverage manufacturers are reformulating their products or introducing new options to meet these changing preferences. For instance, OLIPOP, a brand known for its functional beverages, offers drinks containing 6-9 grams of fiber and only 2-5 grams of sugar per can, as claimed by the company. This trend highlights how brands are adapting to cater to health-conscious consumers seeking better-for-you beverage options in the beverage market.
Sustainability concerns are reshaping packaging choices
Consumers are becoming more aware of the importance of sustainability, which is influencing their choices in beverage packaging. Many are willing to spend more on products with eco-friendly packaging and prefer items that highlight their environmental benefits. For example, 35% of Americans prefer products labeled as non-GMO, according to the International Food Information Council (IFIC) Survey 2024. In response, companies are creating packaging using biodegradable, compostable, and plant-based materials, as well as paper- and fiber-based bottles, to reduce the use of traditional plastics. A notable example is Coca-Cola India’s launch in June 2024 of its Affordable Small Sparkling Package (ASSP), made entirely from recycled PET in 250 ml bottles. This initiative, introduced in Odisha, significantly reduces carbon emissions. These efforts by consumers, regulators, and companies are speeding up the shift toward sustainable and low-impact packaging in the global beverages market.
Restraints Impact Analysis*
| RESTRAINT | (~) % IMPACT ON CAGR FORECAST | GEOGRAPHIC RELEVANCE | IMPACT TIMELINE |
|---|---|---|---|
| Increasing Sugar tax and health regulations | -0.9% | Global, with emerging markets most affected | Short term (≤ 2 years) |
| Fluctuating raw material prices | -0.5% | Global, with 108+ countries implementing | Medium term (2-4 years) |
| Stringent alcohol regulations | -0.3% | Global, with stricter enforcement in developed markets | Long term (≥ 4 years) |
| Labeling and transparency regulations | -0.7% | Global, particularly affecting temperature-sensitive products | Medium term (2-4 years) |
| Source: Mordor Intelligence | |||
Increasing Sugar tax and health regulations
Rising sugar taxes and stricter health regulations are creating significant challenges for the beverages market. For example, in India, sugary carbonated drinks face a high tax rate of 40 percent, which is slowing down innovation and market growth, according to the Indian Council for Research on International Economic Relations as of September 2024[4]Source: Indian Council for Research on International Economic Relations Org, "Carbonated Beverages Industry in India: Tax Policy to Promote Growth, Innovation and Investment", icrier.org . These taxes are part of broader efforts to reduce sugar consumption and address health concerns like obesity and diabetes. As a result, beverage companies are being forced to adapt by either increasing prices, reformulating products to reduce sugar content, or shifting their focus to healthier alternatives. While these changes aim to meet consumer demand for healthier options, they also increase operational costs and create hurdles for companies trying to maintain profitability in a competitive market within the beverage market.
Labeling and transparency regulations
Stricter rules on labeling and transparency are creating challenges for beverage companies. In the U.S., the Food and Drug Administration proposed in January 2025 a front-of-package nutrition label that rates saturated fat, sodium, and added sugars as low, medium, or high. This change is meant to help consumers make healthier choices, but adds pressure on companies to comply. To adapt to these changes and meet consumer demands, Crystal Light launched its first ready-to-drink line in March 2025: the Vodka Refreshers. These canned cocktails clearly show on the front label that they have zero sugar, zero carbs, and only 77 calories, appealing to health-conscious buyers. This focus on clearer labeling and healthier products is driving companies to redesign packaging, adjust recipes, and invest in meeting these requirements, which increases costs and complexity across the beverage industry.
*Our forecasts treat driver/restraint impacts as directional, not additive. The impact forecasts reflect baseline growth, mix effects, and variable interactions.
Segment Analysis
By Product Type: Non-Alcoholic Momentum Counters Alcoholic Scale
Alcoholic beverages made up 63.78% of the global beverage market share in 2025, driven by the strong demand for popular beer and spirits. These products continue to lead in bars and pubs due to their widespread availability and loyal customer base. Premium and craft options are becoming more popular as disposable incomes rise and social drinking gains traction in emerging markets. Seasonal promotions, celebrity endorsements, and convenient packaging formats like cans and mini bottles are also boosting the growth of this category in the beverage market.
The non-alcoholic segment is expected to grow faster, with a projected CAGR of 6.05% through 2031, surpassing the slower growth of alcoholic beverages. This growth is fueled by increasing demand for healthier options, with products like Ready-toDrink (RTD) tea and coffee and juices gaining popularity among younger, health-conscious consumers. These beverages align with the "sober-curious" trend, which encourages moderation. Functional waters, adaptogenic drinks, and prebiotic sodas are becoming favorites for their added health benefits, such as hydration and gut health. Their convenient packaging and premium positioning allow companies to meet changing consumer preferences while achieving higher profit margins.


By Packaging Type: PET Bottles Leads, Cans Accelerates
PET bottles made up 61.60% of the global beverage market share in 2025, driven by their lightweight design, affordability, and versatility across various beverage categories like water, juices, and soft drinks. Their ease of storage and transportation makes them a preferred choice for manufacturers and consumers alike. Increasing regulations requiring 25% recycled content by 2025 are pushing companies to adopt recycled PET (rPET), promoting sustainability and reducing environmental impact. This shift is encouraging the development of more eco-friendly production practices in the industry.
Cans are growing at a CAGR of 5.75%, gaining popularity due to their recyclability, convenience, and appeal in categories like energy drinks and alcoholic beverages. Their durable and portable nature makes them ideal for on-the-go consumption, while sleek designs and modern packaging enhance their attractiveness to consumers. Although glass packaging holds a smaller share of the market, it continues to grow in value because of its premium image. Glass is widely used in high-end and craft beverage segments, where it is associated with quality and sophistication, making it a preferred choice for premium branding.
By Application: Energy Boost Leads, Nutritional and Functional Support Accelerates
Energy-boost beverages accounted for 31.10% of the global beverage market share in 2025, driven by their popularity among fitness enthusiasts, gamers, and individuals with busy schedules. These drinks provide a quick energy boost through ingredients like caffeine, taurine, and vitamins, making them a go-to option for enhancing focus and stamina. Their convenience and ability to support active lifestyles have solidified their position in the market. The introduction of sugar-free and innovative flavor options has broadened their appeal, attracting a wider consumer base.
Nutritional and functional beverages are expected to grow at a CAGR of 6.95% through 2031, as health-conscious consumers increasingly seek products with added benefits. These beverages are formulated with ingredients that promote immunity, digestion, and mental wellness, aligning with the rising demand for healthier choices. Although this segment currently holds a smaller share, its growth is fueled by the appeal of combining hydration with health benefits. The emergence of plant-based and adaptogenic options, along with premium positioning, is further driving interest and expansion in this category.
By Distribution Channel: Off-Trade Scale Meets On-Trade Momentum
Off-trade channels, including supermarkets, convenience stores, and e-commerce platforms, accounted for 71.85% of the global beverage market share in 2025. Consumers preferred these channels for their convenience, allowing them to make quick purchases or receive products directly at their doorstep. Physical stores captured impulse buyers, while e-commerce platforms gained traction through subscription models and personalized offers. This combination of accessibility and tailored services has made off-trade channels a dominant force in the market.
On-trade sales, which include bars, restaurants, and live event venues, are expected to grow at a CAGR of 5.80% through 2031 as social activities and travel return to normal. Upscale bars and taprooms are becoming popular for introducing premium beverage options, enhancing the consumer experience. The adoption of digital menus and QR-code ordering has improved efficiency, reducing wait times and increasing customer satisfaction. These factors are driving the recovery and growth of on-trade sales in the beverages market.
Geography Analysis
North America leads the market with a 38.75% share in 2025, supported by its extensive distribution networks and established brands. Consumers in this region readily purchase premium and functional beverages, showing strong purchasing power. The Food and Drug Administration's (FDA) new labeling rules for added sugars have increased transparency and consumer trust. Major companies like PepsiCo and Keurig Dr Pepper are focusing on health-conscious products, launching drinks like Gatorade Fit and Bai antioxidant beverages. While large-scale production helps maintain profits, various challenges exist, including sugar taxes in Philadelphia and bottle deposit requirements in California. These factors require careful management to maintain profitable operations.
Asia-Pacific shows the highest growth rate at 5.90% through 2031, driven by rapid urbanization and rising consumer incomes. This growth is changing beverage preferences across the region, with consumers seeking more diverse drink options. Chinese company Nongfu Spring is meeting demand with low-sugar teas and vitamin-enhanced water, while Coca-Cola expands in India with Kinley water. Japan continues to innovate in the ready-to-drink coffee segment, with companies like Suntory and Asahi introducing convenient cold brew options. The region's varied retail landscapes and tax systems require companies to develop market-specific strategies for pricing and packaging.
Europe maintains steady growth while balancing sustainability requirements and premium product demand. The European Union's new regulation requiring 25% recycled content in plastic bottles by 2025 is changing how companies approach packaging. Major brands like Danone and Nestlé are responding by introducing recycled PET bottles across their European operations. Tourism recovery in Southern Europe is boosting sales of traditional drinks like Aperol spritz and sangria. Northern European markets are seeing significant growth in plant-based beverages, with brands like Oatly gaining popularity. These regional differences highlight the need for customized market approaches within Europe.

Competitive Landscape
The beverage market shows moderate fragmentation. Large companies like Coca-Cola, PepsiCo, and Anheuser-Busch InBev control most distribution networks and supply chains. These major players face growing competition from new brands that focus on health benefits and unique product offerings. Small companies are gaining market share by making drinks with special ingredients like adaptogens and low-sugar options. This change shows how consumer preferences are shifting away from traditional sodas. The market now includes more variety in drink types, giving customers more choices than ever before.
Companies are buying other businesses to grow in new drink categories. An example is Keurig Dr Pepper, which spent USD 990 million to buy Ghost Beverages and enter the energy drink market. PepsiCo bought Poppi, a company that makes prebiotic sodas, and then created its own Pepsi Prebiotic Cola. This new cola is different from regular Pepsi because it has added fiber, less sugar, and no artificial sweeteners. It's the biggest change in cola drinks in the past 20 years. These purchases show how big companies are trying to keep up with changing consumer tastes across the beverage industry.
New technology helps companies stay competitive in several ways. Companies are using artificial intelligence to create new flavors faster than before. They also use blockchain technology to track ingredients and improve recycling systems for plastic bottles. Digital tools make it easier for small stores to order and manage their drink inventory. However, new rules about sugar content and plastic packaging are creating challenges. These rules make it possible for new companies to compete within the beverage industry with bigger ones by offering healthier or more environmentally friendly drinks. The beverage market continues to change as companies adapt to new regulations and consumer demands.
Beverage Industry Leaders
-
Nestlé S.A.
-
PepsiCo, Inc.
-
Anheuser-Busch InBev
-
The Coca-Cola Company
-
Bacardi Limited
- *Disclaimer: Major Players sorted in no particular order

Recent Industry Developments
- July 2025: PepsiCo introduced Pepsi® Prebiotic Cola, which represented the evolution of cola created to reflect the tastes and values of cola consumers. This innovation included 5 grams of cane sugar, had 30 calories, and contained no artificial sweeteners. The product delivered the classic crisp, refreshing taste of Pepsi with the added functional ingredient of 3 grams of prebiotic fiber.
- May 2025: PepsiCo, Inc. completed the acquisition of poppi for USD 1.95 billion, which included USD 300 million in anticipated cash tax benefits, resulting in a net purchase price of USD 1.65 billion. The deal structure incorporated a performance-based earnout component that was contingent on meeting specific performance metrics.
- February 2025: Coca‑Cola launched Simply Pop, its first prebiotic soda under the Simply brand. The product contained 6 g of prebiotic fiber, vitamin C, zinc, and no added sugar. The company formulated the beverage with 25–30% real fruit juice and offered it in five fruit-forward flavors.
- October 2024: Keurig Dr Pepper acquired a 60% stake in Ghost Beverages for USD 990 million in January 2024. The deal marked a strategic move to strengthen its position in the high-growth energy drink segment. It also allowed the company to expand its functional beverage portfolio targeting younger, fitness-driven consumers.


Global Beverage Market Report Scope
The beverages market covers the analysis of alcoholic and non-alcoholic beverages, drinks, and other potable liquids intended for human consumption, including beer, wine, soft drinks, fruit juices, and packaged or bottled water.
The beverages market is segmented by product type, distribution channel, and geography. The product type is segmented into alcoholic and non-alcoholic beverages. Alcoholic beverages are further sub-segmented into beer, wine, and spirits. Non-alcoholic beverages are further sub-segmented into energy and sports drinks, soft drinks, bottled water, packaged juice, RTD tea and coffee, and other non-alcoholic beverages. By distribution channel, the market is segmented into on-trade and off-trade. Off-trade channel is further sub-segmented into supermarkets/hypermarkets, convenience/grocery stores, online retail stores, and other off-trade channels. By geography, the market is segmented into North America, Europe, South America, Asia-Pacific, and the Middle East and Africa.
The market sizing and forecasts have been done for each segment based on value (in USD).
By Product Type
| Alcoholic Beverages | Beer |
| Wine | |
| Spirits | |
| Ready-to-Drink (RTD) Cocktails | |
| Hard Seltzers | |
| Non-Alcoholic Beverages | Carbonated Soft Drinks |
| Bottled Water | |
| Juices and Nectars | |
| Energy and Sports Drinks | |
| Ready-to-Drink (RTD) Tea and Coffee | |
| Dairy and Plant-based Drinks | |
| Other Non-Alcoholic Beverages |
By Packaging Type
| PET Bottles |
| Glass Bottles |
| Cans |
| Others |
By Application
| Energy Boost |
| Nutritional and Functional Support |
| Others |
By Distribution Channel
| On-trade | |
| Off-trade | Supermarkets/Hypermarkets |
| Convenience Stores | |
| Online Retailers | |
| Specialty Stores |
By Geography
| North America | United States |
| Canada | |
| Mexico | |
| Rest of North America | |
| South America | Brazil |
| Colombia | |
| Chile | |
| Peru | |
| Argentina | |
| Rest of South America | |
| Europe | United Kingdom |
| Germany | |
| France | |
| Italy | |
| Spain | |
| Russia | |
| Poland | |
| Belgium | |
| Sweden | |
| Rest of Europe | |
| Asia-Pacific | China |
| Japan | |
| India | |
| Australia | |
| Indonesia | |
| South Korea | |
| Thailand | |
| Singapore | |
| Rest of Asia-Pacific | |
| Middle East and Africa | South Africa |
| Saudi Arabia | |
| United Arab Emirates | |
| Nigeria | |
| Egypt | |
| Morocco | |
| Turkey | |
| Rest of Middle East and Africa |
| By Product Type | Alcoholic Beverages | Beer |
| Wine | ||
| Spirits | ||
| Ready-to-Drink (RTD) Cocktails | ||
| Hard Seltzers | ||
| Non-Alcoholic Beverages | Carbonated Soft Drinks | |
| Bottled Water | ||
| Juices and Nectars | ||
| Energy and Sports Drinks | ||
| Ready-to-Drink (RTD) Tea and Coffee | ||
| Dairy and Plant-based Drinks | ||
| Other Non-Alcoholic Beverages | ||
| By Packaging Type | PET Bottles | |
| Glass Bottles | ||
| Cans | ||
| Others | ||
| By Application | Energy Boost | |
| Nutritional and Functional Support | ||
| Others | ||
| By Distribution Channel | On-trade | |
| Off-trade | Supermarkets/Hypermarkets | |
| Convenience Stores | ||
| Online Retailers | ||
| Specialty Stores | ||
| By Geography | North America | United States |
| Canada | ||
| Mexico | ||
| Rest of North America | ||
| South America | Brazil | |
| Colombia | ||
| Chile | ||
| Peru | ||
| Argentina | ||
| Rest of South America | ||
| Europe | United Kingdom | |
| Germany | ||
| France | ||
| Italy | ||
| Spain | ||
| Russia | ||
| Poland | ||
| Belgium | ||
| Sweden | ||
| Rest of Europe | ||
| Asia-Pacific | China | |
| Japan | ||
| India | ||
| Australia | ||
| Indonesia | ||
| South Korea | ||
| Thailand | ||
| Singapore | ||
| Rest of Asia-Pacific | ||
| Middle East and Africa | South Africa | |
| Saudi Arabia | ||
| United Arab Emirates | ||
| Nigeria | ||
| Egypt | ||
| Morocco | ||
| Turkey | ||
| Rest of Middle East and Africa | ||


Key Questions Answered in the Report
How large is the global beverages market in 2026?
The global beverages market size is USD 2.03 trillion in 2026.
What CAGR is projected for beverages through 2031?
The market is forecast to grow at a 5.65% CAGR between 2026 and 2031.
Which packaging format is growing fastest?
Cans are expanding at a 5.75% CAGR because of recyclability and convenience advantages.
Which segment shows the highest growth within applications?
Nutritional and Functional Support lead with a 6.95% CAGR, fueled by active-lifestyle demand.
Which region will add the most incremental revenue?
Asia-Pacific is forecast to contribute the highest incremental sales, climbing at a 5.90% CAGR.
Page last updated on:


