Soft Drinks Market Size and Share
Market Overview
| Study Period | 2021 - 2031 |
|---|---|
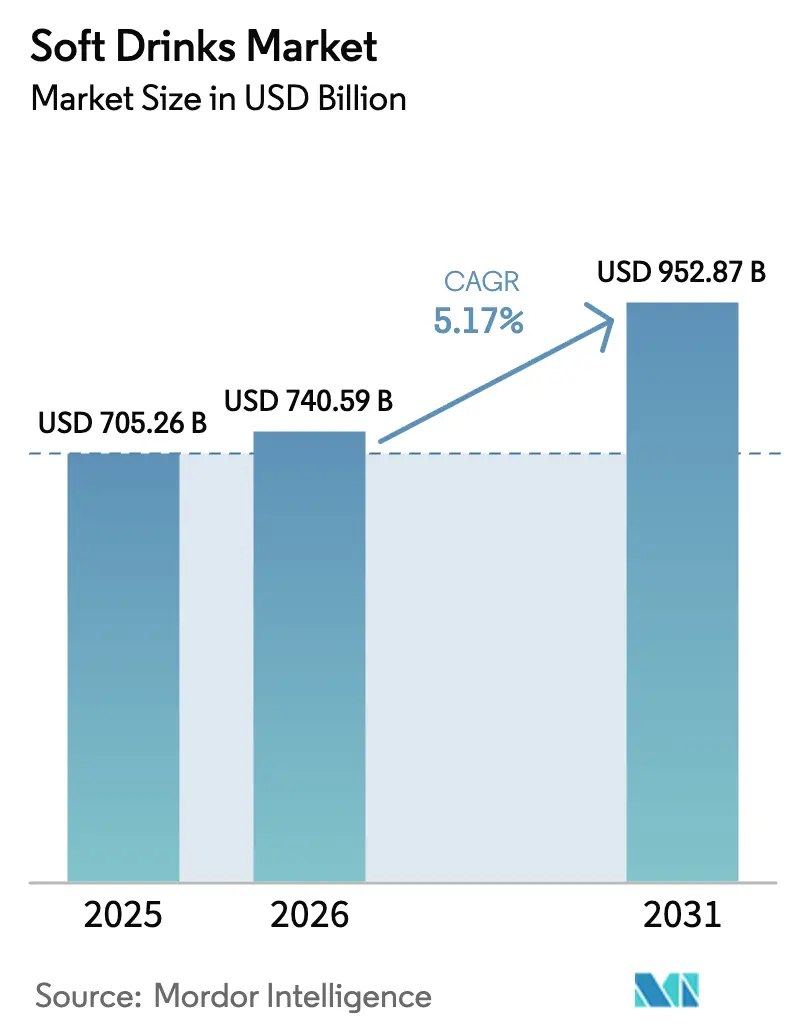
| Market Size (2026) | USD 740.59 Billion |
| Market Size (2031) | USD 952.87 Billion |
| Growth Rate (2026 - 2031) | 5.17% CAGR |
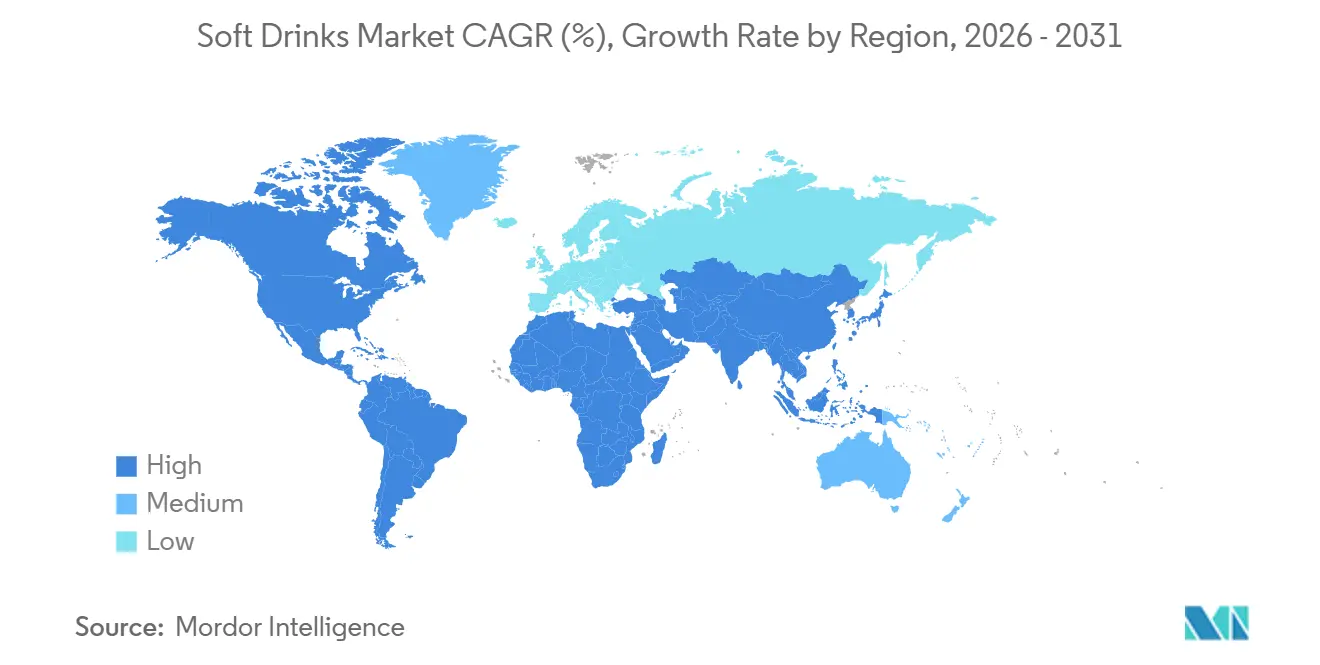
| Fastest Growing Market | Asia Pacific |
| Largest Market | North America |
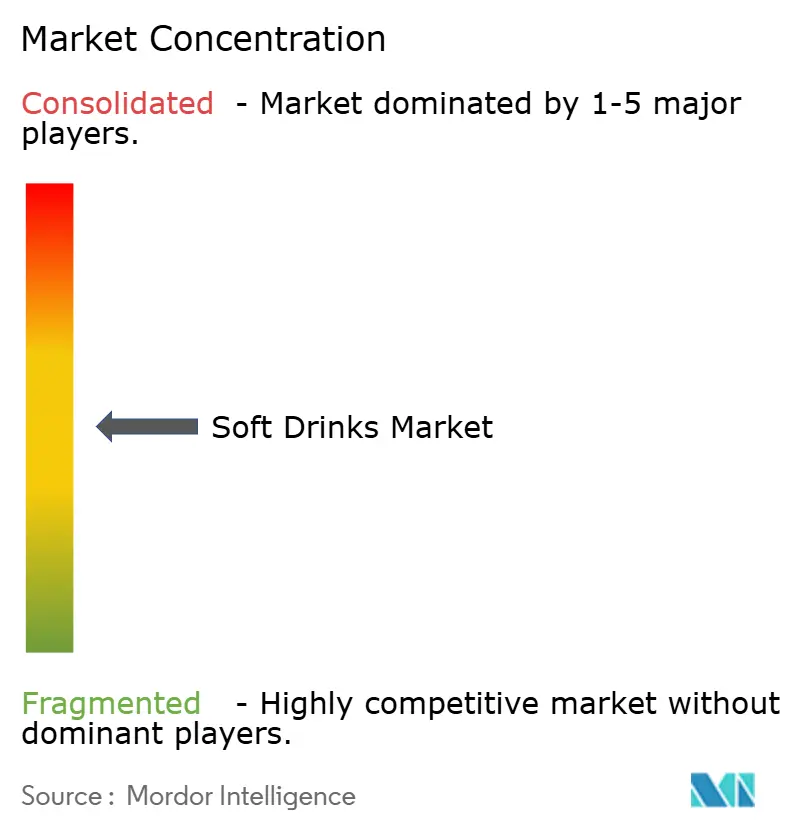
| Market Concentration | Medium |
Major Players
*Disclaimer: Major Players sorted in no particular order Image © Mordor Intelligence. Reuse requires attribution under CC BY 4.0. |
|
Soft Drinks Market Analysis by Mordor Intelligence
In 2025, the soft drinks market was valued at USD 705.26 billion and is expected to grow from USD 740.59 billion in 2026 to USD 952.87 billion by 2031, registering a CAGR of 5.17% between 2026 and 2031. The market is witnessing a shift in consumer preferences, with growing demand for beverages that provide hydration, support immunity, and enhance cognitive focus. This trend is driving the market away from traditional "refreshment-only" offerings toward functional beverages that can justify premium pricing. Carbonated soft drinks, which contributed a major part of global revenue in 2025, are now facing challenges due to increasing sugar taxes and growing health concerns. Off-trade retail channels, which held a significant share in 2025, are gradually losing momentum to on-trade outlets as restaurants and quick-service operators recover to pre-pandemic levels and secure long-term exclusive fountain contracts. In terms of packaging, polyethylene-terephthalate (PET) dominated in 2025, but premium craft sodas in glass bottles are gaining popularity. The industry's growth is further bolstered by innovative formulations, sustainable packaging solutions, and effective omnichannel distribution strategies.
Key Report Takeaways
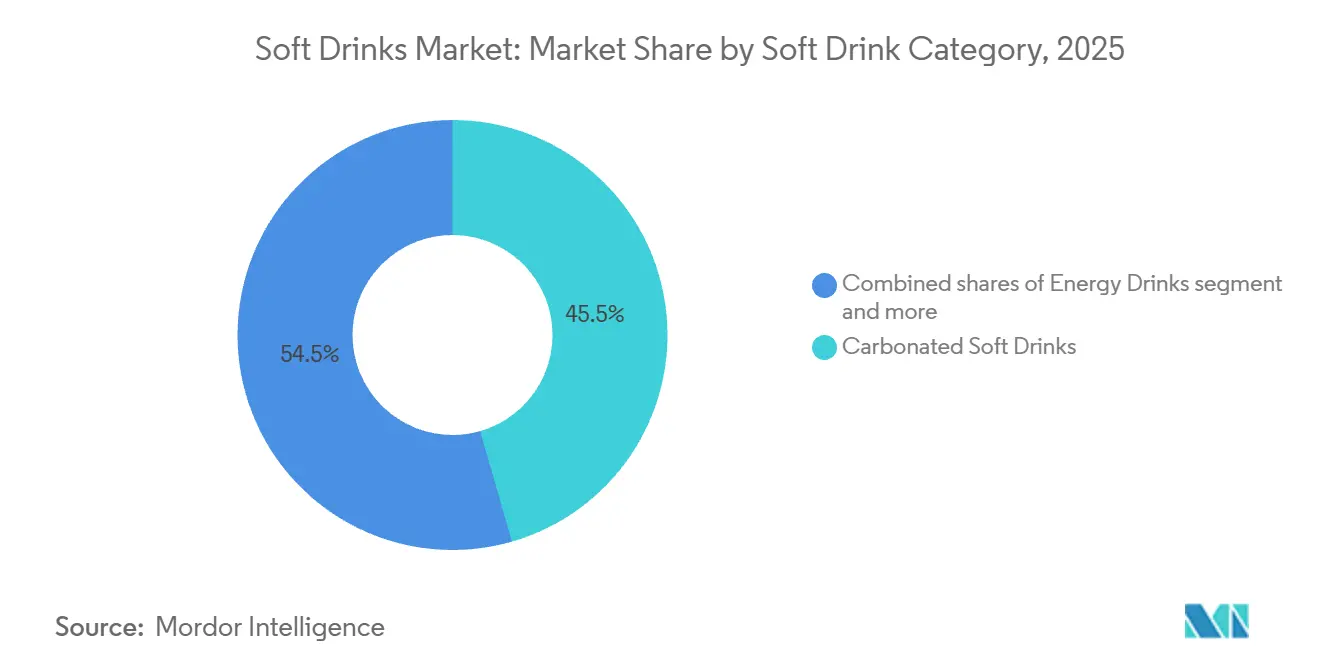
- By soft drink category, carbonated soft drinks led with 45.54% of the soft drinks market share in 2025, whereas natural and organic energy drinks are projected to grow at a 6.54% CAGR from 2026 to 2031.
- By packaging type, PET bottles accounted for 59.23% share of the soft drinks market size in 2025, while glass bottles are advancing at a 5.78% CAGR over 2026-2031.
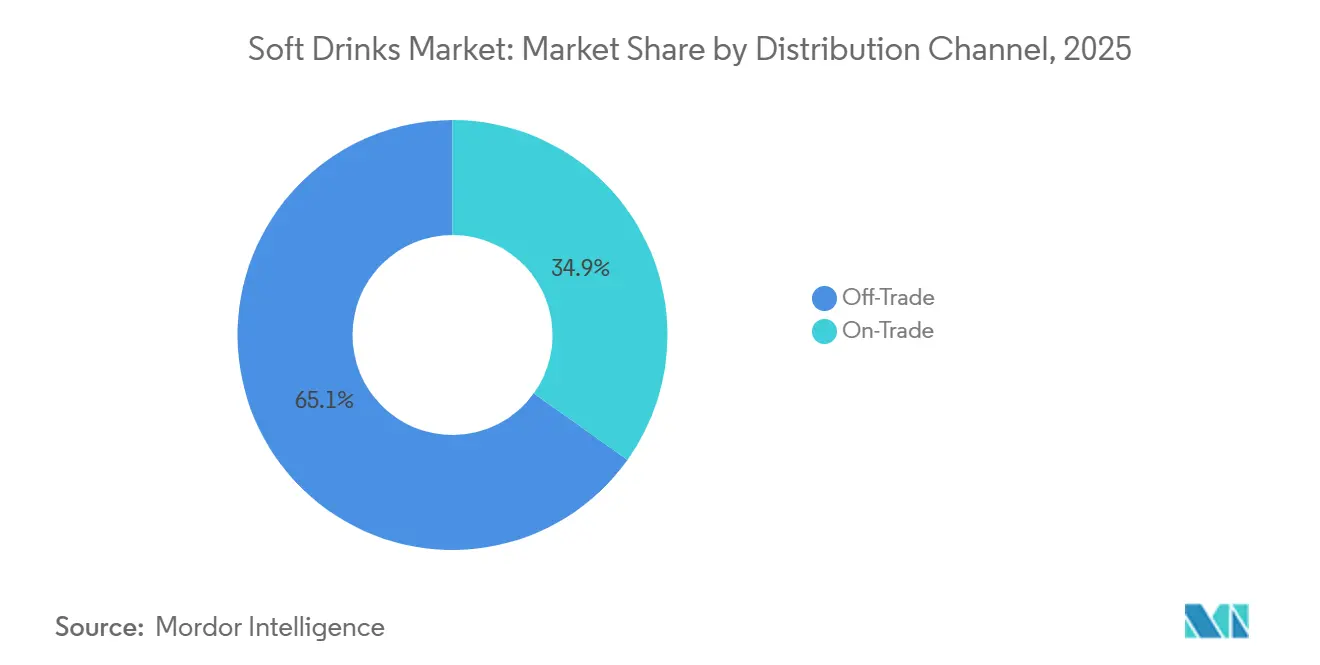
- By distribution channel, off-trade outlets held 65.12% revenue share in 2025, yet on-trade is forecast to post the fastest 6.02% CAGR through 2031 as restaurants and QSR chains lock in exclusive fountain agreements.
- By geography, North America recorded the highest share in 2025 at 34.42%, while Asia-Pacific, driven by rapid urbanization and a youthful demographic bulge, is projected to be the fastest-growing region with a robust 6.21% CAGR.
Note: Market size and forecast figures in this report are generated using Mordor Intelligence’s proprietary estimation framework, updated with the latest available data and insights as of January 2026.
Global Soft Drinks Market Trends and Insights
Drivers Impact Analysis*
| Driver | (~) % Impact on CAGR Forecast | Geographic Relevance | Impact Timeline |
|---|---|---|---|
| Rising demand for functional beverages | +1.2% | Global, led by Asia-Pacific and North America | Medium term (2-4 years) |
| Sugar-reduction technologies and natural sweeteners | +0.9% | North America and European Union, expanding to Latin America | Short term (≤ 2 years) |
| Digital marketing and social media engagement | +0.7% | Global, strongest in smartphone-dense urban markets | Short term (≤ 2 years) |
| Convenience and on-the-go packaging | +0.8% | Global, urban centers in Asia-Pacific and North America | Medium term (2-4 years) |
| Foodservice, QSR, and out-of-home partnerships | +0.6% | North America, Europe, emerging Asia-Pacific | Medium term (2-4 years) |
| Emerging-market urbanization and youth demographics | +1.3% | Core Asia-Pacific, spill-over into Middle East and Latin America | Long term (≥ 4 years) |
| Source: Mordor Intelligence | |||


Rising demand for functional beverages
The growing demand for functional beverages is a significant driver in the market, with natural and organic energy drinks projected to grow at a 6.54% CAGR through 2031, outpacing traditional carbonated soft drinks. Consumers are increasingly drawn to beverages that provide added health benefits, such as probiotics, adaptogens, and nootropics, which were previously associated with dietary supplements. For example, PepsiCo's Prebiotic Cola launched in July 2025, reflects this trend. The product contains 5 grams of cane sugar, 30 calories, and no artificial sweeteners, showcasing how established brands are evolving to meet the rising preference for healthier options. This shift represents a structural change in consumer behavior, as younger demographics now prioritize functional benefits over taste when selecting ready-to-drink beverages. Additionally, this trend is driving demand for innovative products like cold-brew coffee infused with collagen peptides and RTD teas fortified with L-theanine, creating growth opportunities for co-packers with advanced aseptic-filling capabilities.
Sugar reduction technologies and natural sweeteners
Sugar-reduction technologies and natural sweeteners are driving significant changes in the soft drink market. The success of the Soft Drink Industry Levy (SDIL) in the United Kingdom, which has reduced sugar content in shop-bought soft drinks by nearly half, highlights the growing focus on healthier beverage options[1]Source: Open Government Licence, “Strengthening the Soft Drinks Industry Levy-Summary of responses,” gov.uk. Multinational companies are increasingly adopting blends of stevia, monk fruit, and allulose as alternatives to traditional sweeteners. However, these solutions face challenges such as aftertaste, cost, and regulatory compliance. Coca-Cola, for instance, has invested in cane-sugar-extract sweeteners that replicate the mouthfeel of sucrose without the glycemic impact. Despite the potential, this research and development process is capital-intensive and requires revalidating shelf life across global manufacturing networks. Additionally, regions like Latin America and Southeast Asia, which are piloting similar levies, are expected to accelerate the adoption of natural sweeteners, further supporting growth in the soft drink market.
Digital marketing and social media engagement
Digital marketing has significantly shortened the time required for beverage brands to move from concept development to national distribution, allowing niche players to overcome traditional retail barriers. Platforms such as TikTok have demonstrated effectiveness, with influencer campaigns achieving lower cost-per-impression rates compared to television advertising. Additionally, Instagram's shoppable posts facilitate direct-to-consumer (D2C) transactions, removing the need for distributor margins. This transition is particularly influential in the functional beverages market, where educating consumers about ingredients like adaptogens, including ashwagandha and rhodiola, is supported by long-form content on platforms such as YouTube and podcast sponsorships. These platforms allow brands to provide detailed information, build trust, and engage with a targeted audience more effectively. However, regulatory scrutiny is increasing. In 2024, the U.S. Federal Trade Commission implemented updated influencer-disclosure guidelines, mandating clear labeling of paid partnerships and cautioning against concealing commercial relationships. These guidelines aim to enhance transparency and ensure consumers are aware of promotional content [2]Source: Federal Trade Commission, "FTC's Endorsement Guides What People Are Asking," ftc.gov.
Convenience and on-the-go packaging
The increasing pace of urbanization and shifting commuting habits are driving the demand for convenient and portable packaging solutions. Consumers are seeking packaging that supports their busy, on-the-go lifestyles, leading to the growing adoption of single-serve, resealable formats. In response to this trend, Coca-Cola introduced lightweight PET bottles in 2024, reducing their weight from 21 grams to 18.5 grams. This initiative not only reduces transportation costs but also aligns with Extended Producer Responsibility (EPR) mandates in Europe, showcasing how packaging innovation can address both economic and regulatory requirements. Additionally, aseptic cartons are gaining traction in the juice and ready-to-drink (RTD) coffee segments. These cartons provide ambient shelf stability, eliminating the need for cold-chain logistics and enabling broader distribution, including in rural and underserved areas. A notable development in 2024 was SIG’s launch of the Terra alu-free carton, which removes the aluminum foil layer traditionally used as an oxygen barrier. This innovation significantly reduces the carbon footprint of the packaging while appealing to brands aiming for carbon-neutral certification, reflecting the growing importance of sustainability in packaging solutions.
Restraints Impact Analysis*
| Restraint | (~) % Impact on CAGR Forecast | Geographic Relevance | Impact Timeline |
|---|---|---|---|
| Heightened health concerns around sugar and calories | -1.1% | Global, acute in developed markets | Short term (≤ 2 years) |
| Ingredient scrutiny and clean-label demands | -0.6% | North America and European Union, spreading to Latin America and Asia-Pacific | Medium term (2-4 years) |
| Negative public image of carbonated and artificial beverages | -0.5% | North America, Western Europe, urban Asia-Pacific | Medium term (2-4 years) |
| Water scarcity and resource pressures | -0.4% | Middle-East and Africa, Latin America, stressed zones in Asia Pacific and North America | Long term (≥ 4 years) |
| Source: Mordor Intelligence | |||
Heightened health concerns around sugar and calories
Increasing awareness of the health risks associated with sugar-sweetened beverages, such as obesity, type 2 diabetes, and cardiovascular disease, has reduced per-capita consumption in developed markets. Organizations like the World Health Organization have encouraged governments to implement stricter taxes on sugary and alcoholic beverages[3]Source: WHO, “WHO urges governments to unlock health taxes on sugary drinks and alcohol to save lives and raise revenue,” who.int. While studies have been ongoing to evaluate the tax's impact on obesity, these regulatory measures have placed pressure on profit margins. The higher cost of natural sweeteners compared to high-fructose corn syrup has added to the challenge, as brands have been unable to fully pass on these costs to consumers without risking a decline in sales volumes. Additionally, carbonated soft drinks, which accounted for a significant share of 2025 revenue, are facing structural challenges as health-conscious consumers increasingly opt for alternatives like unsweetened sparkling water, kombucha, and functional beverages.
Ingredient scrutiny and clean-label demands
Clean-label demands have expanded beyond sweeteners to include preservatives, colorants, and flavor enhancers. This shift has driven brands to adopt natural preservation technologies such as high-pressure processing, UV treatment, and plant-derived antimicrobials. However, these methods involve higher capital and operational costs compared to conventional thermal pasteurization. Additionally, regulatory fragmentation has further complicated the landscape. For example, the European Union's Novel Foods Regulation required pre-market approval for ingredients not widely consumed, delaying the introduction of monk fruit extract and allulose in the EU market. Brands unable to meet clean-label standards risk losing shelf space to competitors that prioritize transparency as a key differentiator.
*Our forecasts treat driver/restraint impacts as directional, not additive. The impact forecasts reflect baseline growth, mix effects, and variable interactions.
Segment Analysis
By Soft Drink Category: Functional formulations redefine growth
Carbonated soft drinks remain the largest segment within the soft drink market, accounting for 45.54% of revenue in 2025. However, the segment is facing structural challenges, including sugar taxes and growing health concerns, which are leading to a decline in per-capita consumption, particularly in developed markets. Within this category, standard and diet colas are losing market share to fruit-flavored carbonates. These alternatives offer greater reformulation flexibility and cater to younger consumers who are increasingly drawn to unique and innovative taste profiles. Despite these challenges, the segment continues to hold a significant share of the market due to its widespread availability and established consumer base.
Natural and organic energy drinks are emerging as the fastest-growing segment, with a projected CAGR of 6.54% through 2031. This growth is driven by a shift in consumer preferences toward clean-label ingredients and functional benefits. These drinks, often infused with adaptogens and nootropics, are gaining traction among white-collar professionals seeking sustained focus without the side effects associated with traditional high-caffeine formulations. Additionally, the broader energy drink category is witnessing diversification, with sugar-free and energy shot formats also contributing to growth. The increasing demand for functional beverages that align with health and wellness trends positions this segment as a key driver of innovation and market expansion.


By Packaging Type: Sustainability Mandates accelerate material innovation
PET bottles remain the largest segment, holding a significant share of the packaging market. In 2025, PET bottles accounted for 59.23% of the packaging volume, driven by their widespread use across various industries. However, sustainability mandates are reshaping this segment. Regulatory frameworks, such as the Extended Producer Responsibility (EPR) schemes in Europe, require 25% recycled content in PET bottles by 2025 and 30% by 2030. This has led brands to prioritize securing post-consumer resin (PCR) supplies, which are priced 20-30% higher than virgin PET. Companies are also adopting material efficiency strategies to meet these mandates. For instance, Coca-Cola’s 2024 initiative to reduce PET bottle weight from 21 grams to 18.5 grams highlights efforts to lower freight costs while aligning with sustainability goals. Despite these challenges, PET bottles continue to dominate due to their versatility and cost-effectiveness.
Glass bottles, on the other hand, are emerging as the fastest-growing segment, projected to grow at a 5.78% CAGR through 2031. This growth is largely attributed to the premiumization trend in beverages such as craft sodas, kombucha, and organic juices, where glass packaging is perceived as a symbol of authenticity and environmental responsibility. Additionally, aseptic packaging formats, including cartons and pouches, are gaining traction in the juice and ready-to-drink coffee markets. These formats offer ambient shelf stability, eliminating the need for cold-chain logistics and enabling distribution in rural areas lacking refrigeration infrastructure. Innovations like SIG’s Terra alu-free carton, introduced in 2024, further enhance the appeal of sustainable packaging by reducing the carbon footprint by 30%. As sustainability mandates accelerate material innovation, glass bottles and aseptic packages are becoming increasingly attractive to brands aiming to align with evolving consumer preferences and regulatory requirements.
By Distribution Channel: On-trade recovery outpaces off-trade maturity
Off-trade channels remain the largest segment in the beverage distribution market, accounting for 65.12% of revenue in 2025. Supermarkets and hypermarkets dominate this space, leveraging private-label products and promotional strategies to drive volume. However, these channels face challenges such as margin compression as consumers opt for more affordable options during periods of economic uncertainty. Convenience stores are gaining prominence within the off-trade segment, offering immediate access to chilled single-serve SKUs that command a premium price compared to supermarket multi-packs. This shift highlights the evolving consumer preference for convenience and immediacy in beverage purchases.
On-trade channels, while smaller in size, are the fastest-growing segment, projected to expand at a 6.02% CAGR through 2031. Restaurants, bars, and convenience stores are driving this growth by capturing impulse purchases and social-consumption occasions that e-commerce cannot replicate. Exclusive partnerships, such as Subway's 10-year agreement with PepsiCo signed in 2024, underline the strategic importance of on-trade alliances in enhancing brand visibility and innovation. Additionally, online retail within the off-trade segment is experiencing rapid growth, driven by subscription models and direct-to-consumer brands that bypass traditional distribution channels. These trends reflect the increasing consumer demand for personalized and predictable purchasing experiences.
Geography Analysis
North America, comprising the United States, Canada, Mexico, and smaller markets, remains the largest geography in the global soft drinks market, holding a 34.42% share in 2025. The region is characterized by its maturity and a strong focus on innovation, with functional beverages and sugar-free options steadily gaining traction over traditional carbonated soft drinks. In the United States, the largest single-country market, per-capita consumption of carbonated soft drinks continues to decline as health-conscious millennials and Gen Z consumers increasingly prefer alternatives like sparkling water, kombucha, and ready-to-drink coffee. Mexico has also seen a reduction in per-capita consumption due to the implementation of an excise tax on sugary drinks. Additionally, exclusive foodservice partnerships, such as Subway's long-term deal with PepsiCo and Papa John's contract renewal, highlight the strategic importance of on-trade relationships in ensuring consistent volume growth.
Asia-Pacific, encompassing countries like China, India, Japan, and others, is the fastest-growing geography, driven by rapid urbanization and a youthful demographic, with a CAGR of 6.21% forecasted for 2026-2031. In China, urbanization has surged, adding millions of new urban consumers who favor ready-to-drink tea, isotonic sports drinks, and premium fruit juices. Local brands dominate rural and tier-3 city markets with affordable formats, while international players focus on premium and functional offerings for urban millennials. India is also witnessing significant growth, with its expanding urban population and a young demographic driving demand for ready-to-drink coffee, energy drinks, and flavored sparkling water. Meanwhile, Japan's ready-to-drink tea market remains highly competitive, with local brands innovating to maintain relevance in a mature segment. Across the region, regulatory frameworks and consumer preferences continue to shape market dynamics.
Europe, South America, and the Middle East and Africa (MEA) present diverse dynamics that contribute to the overall market landscape. Europe is undergoing a transformation driven by stringent sustainability mandates and sugar-reduction policies, with reformulation efforts and premiumization trends reshaping product portfolios. In South America, Brazil leads the market, supported by São Paulo's affluence, although inflation and currency volatility pose challenges. Chile's regulatory measures have reduced sugary drink consumption while encouraging reformulation. In the MEA region, Saudi Arabia and the UAE benefit from high disposable incomes and a strong mall culture, with halal certifications and heat-resistant packaging differentiating products. At the same time, countries like Nigeria and Egypt focus on affordable options but hold potential for growth as their economies develop. Water scarcity in the GCC states has also prompted government-mandated water stewardship initiatives, influencing capital expenditure in the soft drinks market.

Competitive Landscape
The global soft drinks market is moderately fragmented and has a dominance of brands like Coca-Cola and PepsiCo in the carbonated beverages segment, while energy drinks, functional beverages, and ready-to-drink (RTD) categories remain highly fragmented. Established players capitalize on scale economies, proprietary fountain equipment, and global procurement strategies to maintain their margins. Meanwhile, emerging brands are exploring niche opportunities in products like kombucha, adaptogen sodas, and protein-infused coffee, often supported by strong social media-driven communities. Innovations such as AI-powered demand forecasting by Coca-Cola and direct-to-consumer subscription models by PepsiCo are enhancing supply chain agility and responsiveness. Additionally, strategic moves like Red Bull's investment in a kombucha startup, Monster's new plant in Brazil, and Keurig Dr Pepper's joint venture in Asia-Pacific's RTD tea market highlight the growing focus on cross-category expansion through mergers, acquisitions, and greenfield ventures.
Patent activity in the soft drinks market underscores the ongoing competition to develop natural sweetener blends and shelf-stable protein beverages, with over 120 beverage-related patents granted in 2025. Sustainability has become a critical area of focus, as companies strive to align with consumer expectations and regulatory pressures. Initiatives such as aluminum life cycle assessments by packaging providers and the adoption of lightweight PET and recycled PET (rPET) materials are helping incumbents mitigate the backlash against plastic waste. These efforts not only enhance environmental credentials but also provide a competitive edge in marketing. The emphasis on sustainability is shaping the strategies of both global and regional players, as they seek to balance innovation with environmental responsibility.
Local players, such as Nongfu Spring in China and AJE Group in Peru, are leveraging hyper-local flavors and agile route-to-market networks to compete effectively in rural areas. By offering products tailored to regional preferences and maintaining competitive pricing, these companies are successfully challenging multinational corporations in specific markets. This dynamic highlights the importance of balancing global brand equity with local relevance. As the market evolves, the interplay between global strategies and localized approaches will continue to define the competitive landscape, influencing the future direction of the soft drinks industry.
Soft Drinks Industry Leaders
-
The Coca-Cola Company
-
PepsiCo Inc.
-
Keurig Dr Pepper Inc.
-
Suntory Holdings Ltd.
-
Red Bull GmbH
- *Disclaimer: Major Players sorted in no particular order

Recent Industry Developments
- November 2025: Gatorade reimagined its brand by partnering with Netflix’s “Stranger Things 5” and fashion brands, leveraging these collaborations to strengthen its connection with modern athletes and enhance its market presence.
- October 2025: PepsiCo is expanding its protein offerings with revamped products across its Propel, Muscle Milk, and Starbucks Coffee brands to meet the growing demand for nutritional drinks.
- May 2024: Coca-Cola has successfully rolled out lighter PET bottles for its brands Coke, Sprite, and Fanta, reducing the average bottle weight from 21g to 18.5g. This initiative has led to a decrease in carbon emissions associated with logistics.


Global Soft Drinks Market Report Scope
Soft drinks, a staple in the non-alcoholic beverage realm, blend water, sweeteners, flavorings, and acids. Many also incorporate functional ingredients like vitamins, minerals, or herbal extracts. Catering to varied consumer tastes, soft drinks offer an array of flavors, sugar-free options, and fortified products, solidifying their significance in the beverage landscape.
The soft drink market categorizes its offerings into segments: carbonated soft drinks, juices, ready-to-drink (RTD) coffee, RTD tea, and energy drinks. Within carbonated soft drinks, options range from standard cola and diet cola to fruit-flavored variants. Juices are divided into 100% juice, juice drinks (up to 24% juice), nectars (25-99% juice), and concentrates. RTD coffee includes iced coffee, cold brew, and other variants, while RTD tea spans iced, green, herbal, and more. Sports drinks diversify into isotonic, hypertonic, hypotonic, electrolyte-enhanced water, and protein-based options. Packaging types include PET bottles, glass bottles, metal cans, aseptic packages, and disposable cups. Distribution channels are split into on-trade and off-trade, with the latter further divided into supermarkets/hypermarkets, convenience stores, specialty shops, and online retail. Geographically, the market spans North America, Europe, Asia-Pacific, South America, and the Middle East and Africa, with valuations presented in USD across all segments.
| Carbonated Soft Drinks | Standard Cola |
| Diet Cola | |
| Fruit Flavored Carbonates | |
| Other Types | |
| Juices | 100% Juice |
| Juice Drinks (up to 24% Juice) | |
| Nectars (25-99% Juice) | |
| Juice concentrates | |
| RTD Coffee | Iced coffee |
| Cold brew coffee | |
| Other RTD Coffee | |
| RTD Tea | Iced tea |
| Green tea | |
| Herbal tea | |
| Other RTD Tea | |
| Energy Drinks | Traditional Energy Drinks |
| Sugar-free or Low-calories Energy Drinks | |
| Natural/Oraganic Energy Drinks | |
| Energy Shots | |
| Other Energy Drinks | |
| Sport Drinks | Isotonic |
| Hypertonic | |
| Hypotonic | |
| Electrolyte-Enhanced Water | |
| Protein-based Sport Drinks |
| PET Bottles |
| Glass Bottles |
| Metal Can |
| Aseptic packages |
| Disposable Cups |
| On-Trade | |
| Off-Trade | Supermarket/Hypermarket |
| Convenience Stores | |
| Specialty Stores | |
| Online Retail | |
| Other Distribution Channels |
| North America | United States |
| Canada | |
| Mexico | |
| Rest of North America | |
| Europe | Germany |
| United Kingdom | |
| Italy | |
| France | |
| Spain | |
| Netherlands | |
| Poland | |
| Belgium | |
| Sweden | |
| Rest of Europe | |
| Asia-Pacific | China |
| India | |
| Japan | |
| Australia | |
| Indonesia | |
| South Korea | |
| Thailand | |
| Singapore | |
| Rest of Asia-Pacific | |
| South America | Brazil |
| Argentina | |
| Colombia | |
| Chile | |
| Peru | |
| Rest of South America | |
| Middle East and Africa | South Africa |
| Saudi Arabia | |
| United Arab Emirates | |
| Nigeria | |
| Egypt | |
| Morocco | |
| Turkey | |
| Rest of Middle East and Africa |
| By Soft Drink Category | Carbonated Soft Drinks | Standard Cola |
| Diet Cola | ||
| Fruit Flavored Carbonates | ||
| Other Types | ||
| Juices | 100% Juice | |
| Juice Drinks (up to 24% Juice) | ||
| Nectars (25-99% Juice) | ||
| Juice concentrates | ||
| RTD Coffee | Iced coffee | |
| Cold brew coffee | ||
| Other RTD Coffee | ||
| RTD Tea | Iced tea | |
| Green tea | ||
| Herbal tea | ||
| Other RTD Tea | ||
| Energy Drinks | Traditional Energy Drinks | |
| Sugar-free or Low-calories Energy Drinks | ||
| Natural/Oraganic Energy Drinks | ||
| Energy Shots | ||
| Other Energy Drinks | ||
| Sport Drinks | Isotonic | |
| Hypertonic | ||
| Hypotonic | ||
| Electrolyte-Enhanced Water | ||
| Protein-based Sport Drinks | ||
| By Packaging Type | PET Bottles | |
| Glass Bottles | ||
| Metal Can | ||
| Aseptic packages | ||
| Disposable Cups | ||
| By Distribution Channel | On-Trade | |
| Off-Trade | Supermarket/Hypermarket | |
| Convenience Stores | ||
| Specialty Stores | ||
| Online Retail | ||
| Other Distribution Channels | ||
| By Geography | North America | United States |
| Canada | ||
| Mexico | ||
| Rest of North America | ||
| Europe | Germany | |
| United Kingdom | ||
| Italy | ||
| France | ||
| Spain | ||
| Netherlands | ||
| Poland | ||
| Belgium | ||
| Sweden | ||
| Rest of Europe | ||
| Asia-Pacific | China | |
| India | ||
| Japan | ||
| Australia | ||
| Indonesia | ||
| South Korea | ||
| Thailand | ||
| Singapore | ||
| Rest of Asia-Pacific | ||
| South America | Brazil | |
| Argentina | ||
| Colombia | ||
| Chile | ||
| Peru | ||
| Rest of South America | ||
| Middle East and Africa | South Africa | |
| Saudi Arabia | ||
| United Arab Emirates | ||
| Nigeria | ||
| Egypt | ||
| Morocco | ||
| Turkey | ||
| Rest of Middle East and Africa | ||


Market Definition
- Carbonated Soft Drinks (CSDs) - Carbonated soft drinks (CSDs) refer to non-alcoholic beverages that are carbonated and typically flavored, containing dissolved carbon dioxide to create effervescence. These beverages commonly include cola, lemon-lime, orange, and various fruit-flavored sodas. Marketed in cans, bottles, or fountain dispense.
- Juices - We have considered packaged juices which encompass non-alcoholic beverages derived from fruits, vegetables, or a combination thereof, processed and sealed in various packaging formats such as bottles, cartons, or pouches. Excluding fresh juices, this market segment involves commercially prepared and preserved juices, often with added preservatives and flavors.
- Ready-to-Drink (RTD) Tea and RTD Coffee - Ready-to-Drink (RTD) tea and RTD coffee are pre-packaged, non-alcoholic beverages that are brewed and prepared for consumption without further dilution. RTD tea typically includes various tea varieties, infused with flavors and sweeteners, and comes in bottles, cans, or cartons. Similarly, RTD coffee involves pre-brewed coffee formulations, often mixed with milk, sugar, or flavorings, and is conveniently packaged for on-the-go consumption.
- Energy Drinks - Energy drinks are non-alcoholic beverages formulated to provide a quick boost of energy and alertness. Whereas, sports drinks are beverages designed to hydrate and replenish electrolytes, particularly after physical exertion, exercise, or intense activity
| Keyword | Definition |
|---|---|
| Carbonated Soft Drinks | Carbonated soft drinks (CSDs) are a combination of carbonated water and flavouring, sweetened by sugar or a non-sugar sweeteners. |
| Standard Cola | Standard Cola is defined as the original flavor of cola soda. |
| Diet Cola | A cola-based soft drink containing no or low amounts of sugar |
| Fruit Flavored Carbonates | A carbonated beverage prepared from fruit juice/fruit flavor with carbonated water and containing sugar, dextrose, invert sugar or liquid glucose either singly or in combination. It may contain peel oil and fruit essences. |
| Juice | Juice is a drink made from the extraction or pressing of the natural liquid contained in fruit and vegetables. |
| 100% Juice | Fruit/vegetable juice made from fruit in the form of its juice with no water added to make up the volume. It is not permitted to add sugars, sweeteners, preservatives, flavourings or colourings to fruit juice. |
| Juice Drinks (up to 24% Juice) | Fruit/vegetable juice drinks with up to 24% fruits/vegetable extract. |
| Nectars (25-99% Juice) | Juices that can have between 25 and 99% of fruit, with the minimum legal limits defined depending on the type of fruit |
| Juice concentrates | Juice Concentrates are those form of juices when most of this liquid is removed resulting in a thick, syrupy product known as juice concentrate. |
| RTD Coffee | Packaged coffee beverages that are sold in a prepared form and are ready for consumption at the time of purchase. |
| Iced Coffee | An iced coffee is a cold version of coffee, usually a combination of hot espresso and milk with ice added to it. |
| Cold Brew Coffee | Cold brew also called cold water extraction or cold pressing is made by steeping ground coffee in room-temperature water for several hours. |
| RTD Tea | Ready-to-drink (RTD) tea is a packaged tea product ready for immediate consumption without brewing or preparation |
| Iced Tea | Ice tea or iced tea is a drink made from tea without milk but with sugar and sometimes fruit flavourings, drunk cold. |
| Green Tea | Green tea is a tea beverage which promotes mental alertness, relieving digestive symptoms and promoting weight loss. |
| Herbal Tea | Herbal tea beverages are made from the infusion or decoction of herbs, spices, or other plant material in hot water. |
| Energy Drink | A type of drink containing stimulant compounds, usually caffeine, which is marketed as providing mental and physical stimulation. They may or may not be carbonated and may also contain sugar, other sweeteners, or herbal extracts, among numerous possible ingredients. |
| Sugar-free or Low-calories Energy Drinks | Sugar-free or Low-calories Energy Drinks are sugar-free, artificially sweetened energy drinks with few or no calories. |
| Traditional Energy Drink | Traditional Energy Drinks are functional soft drinks containing ingredients designed to boost the consumer's energy. |
| Natural/Oraganic Energy Drinks | Natural/Organic energy drinks are energy drinks free of artificial sweeteners and synthetic colorings. Instead, they contain naturally derived ingredients such as green tea, yerba mate, and botanical extracts. |
| Energy Shots | A small but highly concentrated energy drink that contains large amounts of caffeine and/or other stimulants. The quantity is comparatively smaller compared to energy drinks. |
| Sports Drink | Sports drinks are beverages designed specifically for the rapid supply of fluid, carbohydrates, and electrolytes before, during or after exercise. |
| Isotonic | Isotonic drinks contain similar concentrations of salt and sugar as in the human body, and are designed to quickly replace fluids lost during exercise but with an increase of carbohydrate. |
| Hypertonic | Hypertonic drinks have a higher concentration of salt and sugar than the human body. They are best drunk after exercise as it is important to replace glycogen levels quickly after exercise. |
| Hypotonic | Hypotonic drinks are designed to quickly replace fluids lost during exercise. They have very low carbohydrate content and a lower concentration of salt and sugar than the human body. |
| Electrolyte-Enhanced Water | Electrolyte water is water infused with electrically-charged minerals, such as sodium, potassium, calcium, and magnesium. |
| Protein-based Sport Drinks | Protein-based sports drinks are those sports drinks which has added protein in it that will improve performance and reduce muscle protein breakdown. |
| On-Trade | The on-trade refers to places that sell beverages for immediate consumption on the premises like bars, restaurants, and pubs |
| Off-Trade | Off-trade usually means places like liquor stores, supermarkets and other places where you don't consume the beverage right away. |
| Convenience Store | A retail business that provides the public with a convenient location to quickly purchase a wide variety of consumable products and services, generally food and gasoline. |
| Specialty store | A specialty store is a shop/store that carries a deep assortment of brands, styles, or models within a relatively narrow category of goods |
| Online Retail | Online retail is a type of eCommerce whereby a business sells goods or services directly to consumers from a website. |
| Aseptic Packaging | Aseptic packaging refers to the filling of a cold, commercially sterile product under sterile conditions into a presterilized container and closure under sterile conditions to form a seal that effectively excludes microorganisms. These includes tetra packs, cartons, pouches etc. |
| PET Bottle | PET bottle means a bottle made of polyethylene terephthalate. |
| Metal Cans | Metal containers made of aluminum or tin- plated or zinc-plated steel, which are commonly used for packaging food, beverages or other products. |
| Disposable Cups | Disposable Cup means a cup or other container designed for single use to serve beverages, such as water, cold drinks, hot drinks and alcoholic beverages. |
| Gen Z | A way of referring to the group of people who were born in the late 1990s and early 2000s. |
| Millenial | Anyone born between 1981 and 1996 (ages 23 to 38 in 2019) is considered a Millennial |
| Taurine | Taurine is an amino acid that supports immune health and nervous system function. |
| Bars & Pubs | It is a drinking establishment licensed to serve alcoholic drinks for consumption on the premises. |
| Café | It is a foodservice establishment serving refreshments (mainly coffee) and light meals. |
| On the go | It means doing / dealing with while busily engaged with something and not diverting plans in order to accommodate. |
| Internet Penetration | The Internet Penetration Rate corresponds to the percentage of the total population of a given country or region that uses the Internet. |
| Vending Machine | A machine that dispenses small articles such as food, drinks, or cigarettes when a coin or token is inserted |
| Discount store | A discount store or discounter offers a retail format in which products are sold at prices that are in principle lower than an actual or supposed "full retail price". Discounters rely on bulk purchasing and efficient distribution to keep down costs. |
| Clean Label | Clean label on the beverage market are drinks that are made from few ingredients of natural origin and are not or only slightly processed. |
| Caffeine | An alkaloid compound which is a stimulant of the central nervous system. It is mainly used recreationally, as a mild cognitive enhancer to increase alertness and attentional performance. |
| Extreme sport | Action sports, adventure sports or extreme sports are activities perceived as involving a high degree of risk. |
| High-intensity interval training | It incorporates several rounds that alternate between several minutes of high intensity movements to significantly increase the heart rate to at least 80% of one's maximum heart rate, followed by short periods of lower intensity movements. |
| Shelf life | The length of time for which an item remains usable, fit for consumption, or saleable. |
| Cream Soda | Cream soda is a sweet soft drink. Generally flavored with vanilla and based on the taste of an ice cream float |
| Root Beer | Root beer is a sweet North American soft drink traditionally made using the root bark of the sassafras tree Sassafras albidum or the vine of Smilax ornata as the primary flavor. Root beer is typically, but not exclusively, non-alcoholic, caffeine-free, sweet, and carbonated. |
| Vanilla Soda | A carbonated soft drink flavoured with vanilla. |
| Dairy-Free | A product that does not contain any milk or milk products from cows, sheep or goats. |
| Caffeine-Free Energy Drinks | Caffeine-free energy drinks rely on other ingredients to boost the energy. Popular choices include amino acids, B vitamins, and electrolytes. |


Research Methodology
Mordor Intelligence follows a four-step methodology in all our reports.
- Step-1: IDENTIFY KEY VARIABLES: In order to build a robust forecasting methodology, the variables and factors identified in Step 1 are tested against available historical market numbers. Through an iterative process, the variables required for market forecast are set, and the model is built on the basis of these variables.
- Step-2: Build a Market Model: Market-size estimations for the forecast years are in nominal terms. Inflation is not a part of the pricing, and the average selling price (ASP) is kept constant throughout the forecast period for each country.
- Step-3: Validate and Finalize: In this important step, all market numbers, variables, and analyst calls are validated through an extensive network of primary research experts from the market studied. The respondents are selected across levels and functions to generate a holistic picture of the market studied.
- Step-4: Research Outputs: Syndicated reports, custom consulting assignments, databases & subscription platforms


