
Market Overview
| Study Period | 2021 - 2031 |
|---|---|
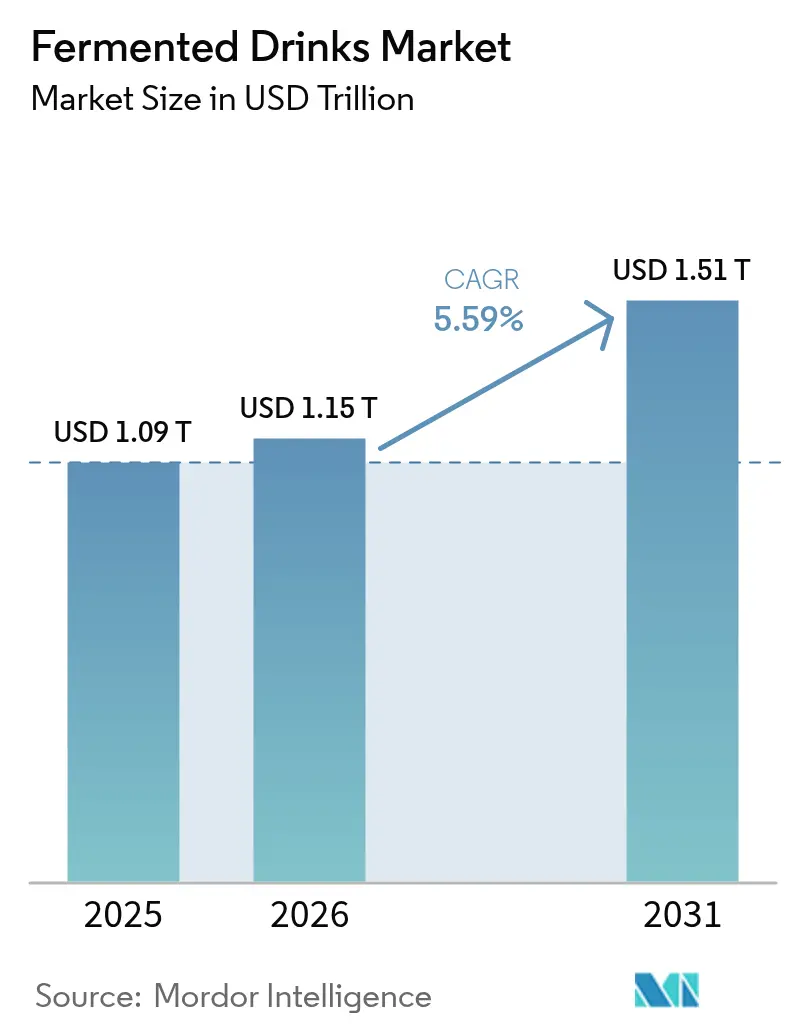
| Market Size (2026) | USD 1.15 Trillion |
| Market Size (2031) | USD 1.51 Trillion |
| Growth Rate (2026 - 2031) | 5.59 % |
| Fastest Growing Market | Middle East and Africa |
| Largest Market | Asia Pacific |
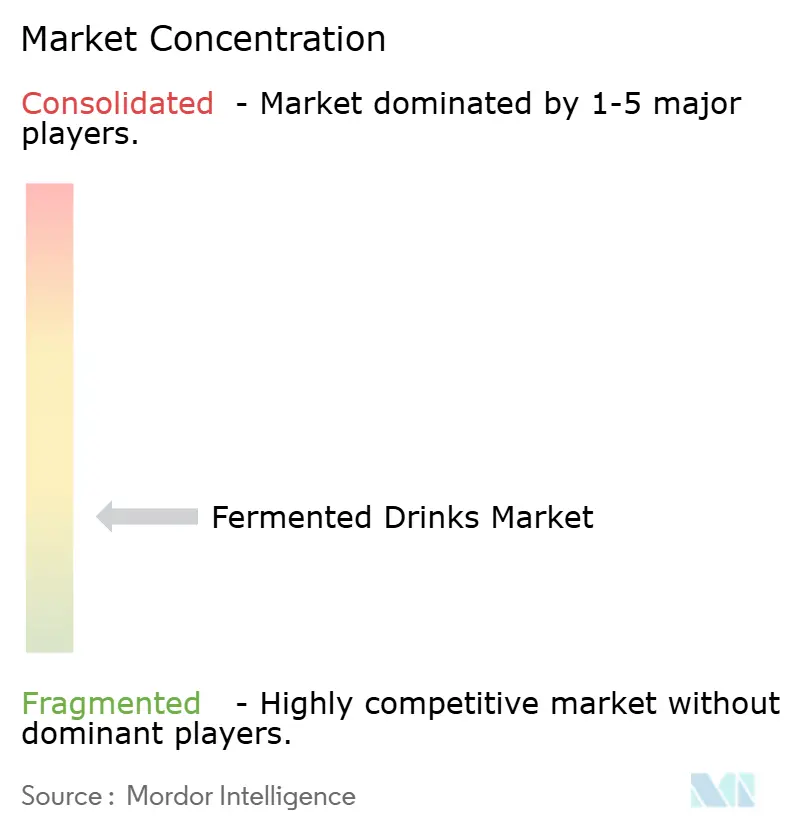
| Market Concentration | Low |
Major Players *Disclaimer: Major Players sorted in no particular order Image © Mordor Intelligence. Reuse requires attribution under CC BY 4.0. | |
Fermented Drinks Market Analysis by Mordor Intelligence
The fermented drinks market size is projected to expand from USD 1.09 trillion in 2025 and USD 1.15 trillion in 2026 to USD 1.51 trillion by 2031, registering a CAGR of 5.59% between 2026 to 2031. Alcoholic beverages continue to dominate in terms of value; however, non-alcoholic probiotic drinks, such as kombucha and kefir, are growing at twice the rate of beer. This highlights a dual growth trend, where wellness-focused innovation is surpassing traditional volume-driven strategies. The gap between price tiers is expanding, as premium craft brands are achieving price increases of over 50%, while mainstream brands are concentrating on defending their market share through strategies such as offering multipacks and forming private-label partnerships. The rise of e-commerce is compressing route-to-market margins, which is shifting negotiation power away from distributors and toward supermarkets that control digital storefronts. Packaging preferences are also undergoing changes; although bottles remain the most widely used format, aluminum cans are increasingly preferred due to recycling mandates. These mandates are helping producers lower compliance costs associated with scope 3 net-zero emissions targets.
Key Report Takeaways
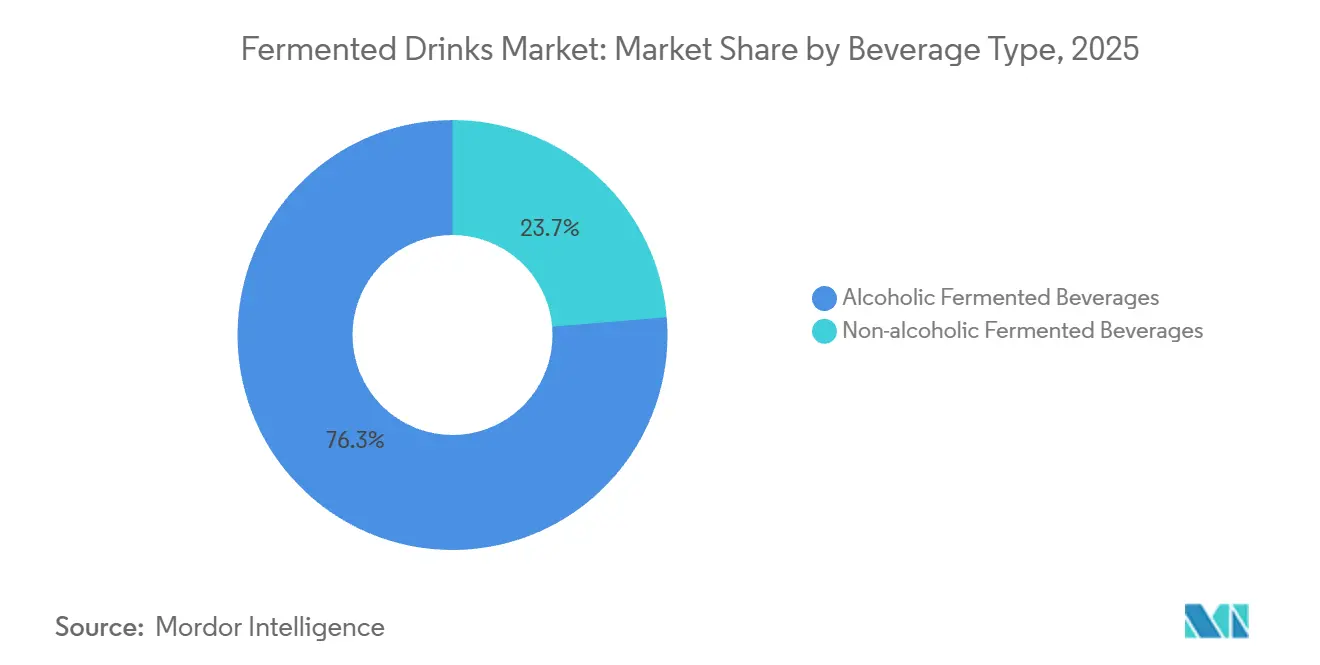
- By beverage type, alcoholic formats led with 76.32% of fermented drinks market share in 2025, and non-alcoholic alternatives are advancing at an 8.02% CAGR through 2031.
- By distribution channel, off-trade accounted for 70.43% share of the fermented drinks market size in 2025, while online retail is projected to expand at a 12.3% CAGR between 2026-2031.
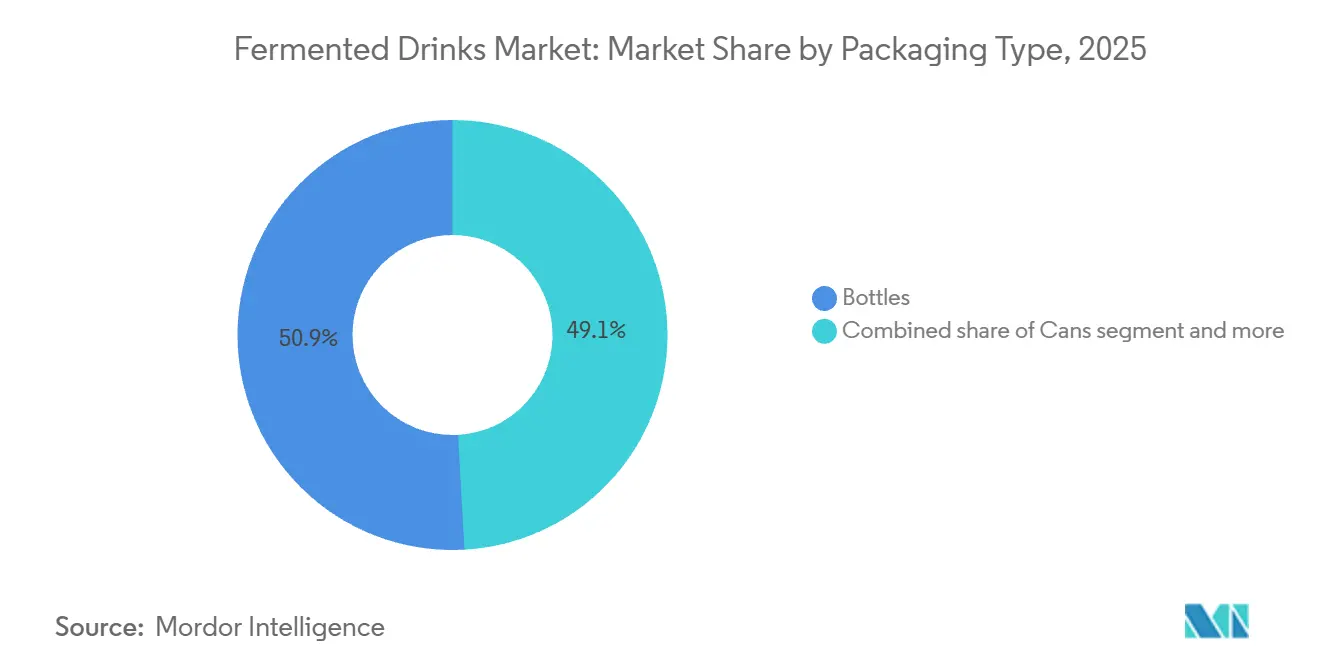
- By packaging type, glass bottles held 50.89% of fermented drinks market share in 2025 and cans are growing at 7.79% through 2031.
- By geography, Asia-Pacific captured 33.82% share in 2025; the Middle East and Africa region is set to post the fastest 7.23% CAGR to 2031.
Note: Market size and forecast figures in this report are generated using Mordor Intelligence’s proprietary estimation framework, updated with the latest available data and insights as of 2026.
Market Trends and Insights
Drivers Impact Analysis of Fermented Drinks Market*
| Driver | (~) % Impact on CAGR Forecast | Geographic Relevance | Impact Timeline |
|---|---|---|---|
| Rising consumer awareness of probiotic benefits for gut health and immunity | +1.2% | Global, with concentration in North America, Western Europe, urban Asia-Pacific | Medium term (2-4 years) |
| Increasing demand for functional beverages supporting digestion and wellness | +1.0% | Global, particularly urban centers in APAC, North America, Northern Europe | Medium term (2-4 years) |
| Shift toward natural and organic alternatives to sugary drinks | +0.9% | North America, Western Europe, Australia, emerging in urban South America | Long term (≥ 4 years) |
| Growing popularity of plant-based and non-dairy fermented options like kombucha and kefir | +0.8% | North America, Europe, urban APAC markets including Singapore, South Korea | Medium term (2-4 years) |
| Advancements in fermentation technologies improving efficiency and product consistency | +0.6% | Global, led by innovation hubs in Europe, North America, Japan | Long term (≥ 4 years) |
| Premiumization trends favoring artisanal and craft fermented beverages | +0.7% | North America, Western Europe, affluent APAC cities, spill-over to MEA | Short term (≤ 2 years) |
| Source: Mordor Intelligence | |||
Rising consumer awareness of probiotic benefits for gut health and immunity
Probiotic-enriched fermented drinks are increasingly becoming mainstream grocery items, transitioning from niche wellness products. This shift is driven by clinical evidence linking gut microbiome diversity to improved immune function and mental health outcomes. Research published in peer-reviewed journals highlights that regular consumption of live-culture beverages can modulate inflammatory markers and enhance vaccine response rates. These findings align with the priorities of health-conscious consumers focusing on post-pandemic wellness. Danone reported a 23% year-over-year increase in probiotic dairy drink sales across European markets in 2025, attributing this growth to targeted digital campaigns emphasizing strain-specific health benefits. Similarly, Yakult Honsha expanded its production capacity in India by 30% in early 2025, anticipating sustained demand from urban millennials seeking preventive health solutions. This growing awareness is further amplified by influencer endorsements and telehealth platforms recommending fermented beverages as adjunct therapies for digestive disorders. However, a key challenge for the industry lies in substantiating health claims without attracting regulatory scrutiny. Regulatory bodies, such as the Food and Drug Administration (FDA), issued updated guidance in 2024 requiring randomized controlled trial data to support immunity-related marketing assertions, adding complexity to the promotion of these products.
Increasing demand for functional beverages supporting digestion and wellness
Functional beverage positioning is significantly influencing product development strategies, as brands incorporate digestive enzymes, prebiotics, and adaptogens into fermented bases to achieve premium pricing and differentiate themselves from traditional soft drinks. PepsiCo's KeVita line launched a turmeric-ginger kombucha variant in mid-2025, targeting consumers interested in anti-inflammatory benefits alongside probiotic cultures. This product secured distribution in 12,000 retail outlets within six months. The Coca-Cola Company's Health-Ade brand utilized its acquisition capital to expand into functional kefir smoothies, combining fermented dairy with plant protein and medium-chain triglyceride (MCT) oil to attract fitness-focused consumers. This integration of fermentation and functional ingredients is also prominent in Asia-Pacific markets. For instance, Bright Food Group introduced a fermented soy beverage fortified with omega-3 fatty acids in China, capturing an 8% market share in the functional drinks category within its first year. Regulatory frameworks are evolving, with International Organization for Standardization (ISO) 20963 standards for probiotic enumeration in beverages adopted by 18 countries in 2025, offering manufacturers clearer compliance guidelines.
Shift toward natural and organic alternatives to sugary drinks
Sugar reduction mandates and consumer resistance to artificial sweeteners are driving a shift toward naturally fermented beverages. These beverages derive their sweetness from residual fruit sugars and fermentation byproducts rather than added sucrose or high-fructose corn syrup. The European Union's revised sugar tax thresholds, effective January 2025, impose penalties on beverages containing more than 5 grams of sugar per 100 milliliters [1]Source: European Union, “Sugar Tax Directive,” food.ec.europa.eu. This regulation has incentivized reformulation efforts, favoring products like kombucha and kefir, which naturally fall below this limit. For example, GT's Living Foods leveraged this trend by introducing an organic kombucha line certified under United States Department of Agriculture (USDA) Organic and Non-GMO (Genetically Modified Organism) Project standards. This strategic move resulted in an 18% revenue growth in North America during 2025. Similarly, Nestlé's acquisition of a minority stake in a Swiss-based organic kefir producer in late 2024 highlights the growing importance of clean-label positioning as a critical factor for maintaining relevance in the market. The organic segment, however, faces supply chain challenges. Certified organic tea and dairy inputs carry price premiums of 25% to 40% compared to conventional alternatives. These higher costs compress margins, particularly for smaller producers that lack long-term supplier contracts.
Growing popularity of plant-based and non-dairy fermented options like kombucha and kefir
Plant-based fermentation is expanding its reach to new consumer segments, particularly lactose-intolerant individuals and flexitarians who are seeking dairy alternatives without compromising their probiotic intake. Products such as oat-based kefir and coconut-water kombucha are gaining popularity. For example, Remedy Drinks reported that its coconut kefir line accounted for 22% of total sales in Australia in 2025, an increase from 14% in 2024. Furthermore, Asahi Group Holdings Limited invested USD 35 million in early 2025 to establish a plant-based fermentation facility in Japan. This facility focuses on producing soy-based probiotic drinks for export to Southeast Asian markets, where dairy consumption is culturally limited. A significant technical challenge in this market is maintaining viable probiotic counts in non-dairy matrices, as lactose-free substrates require strain adaptation and pH buffering to ensure shelf stability. Advances in encapsulation technology, such as the alginate-based microencapsulation patented by Danone in 2024, have improved probiotic survival rates to over 90% during a 12-month shelf life in plant-based beverages.
Restraints Impact Analysis of Fermented Drinks Market*
| Restraint | (~) % Impact on CAGR Forecast | Geographic Relevance | Impact Timeline |
|---|---|---|---|
| Stringent food safety and labeling regulations increasing compliance burdens | -0.8% | Global, particularly stringent in EU, North America, Japan | Short term (≤ 2 years) |
| Short shelf life and spoilage risks requiring advanced preservation | -0.6% | Global, acute in tropical and subtropical regions lacking cold-chain infrastructure | Medium term (2-4 years) |
| Supply chain disruptions affecting raw ingredient availability | -0.5% | Global, concentrated impact in barley-dependent Europe, tea-dependent APAC | Short term (≤ 2 years) |
| Complex standardization of fermentation processes for consistency | -0.4% | Global, most challenging for craft producers and emerging market entrants | Long term (≥ 4 years) |
| Source: Mordor Intelligence | |||
Stringent food safety and labeling regulations increasing compliance burdens
Regulatory tightening regarding probiotic labeling and pathogen control is creating significant challenges for market participants, increasing barriers to entry and requiring reformulation efforts that shift resources away from innovation and toward compliance. In 2024, the United States Food and Drug Administration (FDA) introduced revised Current Good Manufacturing Practice guidelines for fermented beverages. These guidelines mandate quarterly third-party testing for Listeria monocytogenes and Salmonella in facilities producing unpasteurized kombucha and kefir, significantly increasing compliance costs for producers [2]Source: U.S. Food and Drug Administration, “Current Good Manufacturing Practice Guidance for Fermented Beverages,” fda.gov. Similarly, in 2025, the European Food Safety Authority (EFSA) implemented more stringent probiotic strain identification requirements. These new rules require whole-genome sequencing for any strain marketed with health claims, adding both financial and time burdens to the product development process. Smaller producers are feeling the impact more acutely, as compliance costs represent a much larger proportion of their revenue compared to multinational corporations that have dedicated regulatory affairs teams. This uneven burden is accelerating consolidation within the market. For example, Bio-tiful Dairy was acquired by Lactalis Group in late 2024, a move partly driven by the need to access the acquirer's established regulatory infrastructure.
Short shelf life and spoilage risks requiring advanced preservation
Live-culture beverages face inherent stability challenges, as probiotic viability declines significantly after a limited period of refrigerated storage. This limitation restricts distribution reach and increases the risk of retailer markdowns. Schreiber Foods invested a substantial amount in high-pressure processing equipment across multiple facilities in North America, extending the shelf life of kefir while maintaining probiotic counts above one billion colony-forming units per serving. This breakthrough enabled entry into convenience store channels that were previously inaccessible due to turnover constraints. In the Middle East and Africa, cold-chain infrastructure gaps exacerbate spoilage risks. It is estimated that a significant percentage of fermented dairy shipments in these regions experience temperature excursions, rendering the products unsaleable. To address challenges in tropical markets with unreliable refrigerated distribution, Kombucha Wonder Drink transitioned to shelf-stable pasteurized formulations during the year of investment. While this shift sacrificed live-culture positioning, it enabled the company to capture volume in these regions. The trade-off between shelf life and probiotic authenticity is driving changes in product design. Some brands are adopting dual stock-keeping unit (SKU) strategies, offering both live-culture and pasteurized variants tailored to the capabilities of specific distribution channels.
*Our forecasts treat driver/restraint impacts as directional, not additive. The impact forecasts reflect baseline growth, mix effects, and variable interactions.
Fermented Drinks Market Segment Analysis
By Beverage Type:
Non-Alcoholic Surge Challenges Alcoholic DominanceAlcoholic fermented beverages accounted for 76.32% of the market share in 2025. This reflects established consumption patterns and the extensive distribution networks that have been developed over decades by beer and cider producers. On the other hand, non-alcoholic fermented beverages are projected to grow at an annual rate of 8.02% through 2031, surpassing the alcoholic segment's compound annual growth rate (CAGR) of 4.8%. This growth highlights a significant shift in consumer preferences, driven by an increasing focus on wellness and supportive regulatory developments. Beer continues to be the largest alcoholic subsegment, supported by mass-market lagers in the Asia-Pacific region and craft India Pale Ales (IPAs) in North America. However, it is facing challenges in volume as health-conscious consumers reduce alcohol consumption and governments implement stricter drunk-driving regulations. Cider is gaining market share in Europe, particularly in the United Kingdom and Spain, where fruit-forward flavor profiles appeal to younger consumers seeking lower-alcohol alternatives to wine. For example, Heineken's Strongbow brand reported an 11% volume growth in 2025.
Sake is experiencing premiumization in export markets, with Japanese producers targeting high-end restaurants in North America and Europe. Despite this, domestic consumption in Japan has been declining for multiple decades as younger consumers increasingly prefer beer and spirits. This trend reflects a broader shift in consumer behavior, where traditional alcoholic beverages like sake are losing ground to other options that align more closely with evolving tastes and preferences.


By Distribution Channel:
Off-Trade Dominance Masks E-Commerce DisruptionThe off-trade channel accounted for 70.43% of the market share in 2025 and is projected to grow at a rate of 7.82% through 2031. This growth is driven by the expansion of supermarket private-label offerings and increased e-commerce penetration, which reduces reliance on traditional on-premise consumption. Supermarkets and hypermarkets remain the largest subsegment within the off-trade channel, utilizing their control over shelf-space allocation to secure listing fees and promotional support from branded producers. This dynamic tends to benefit multinational companies with substantial marketing budgets over smaller craft producers. Convenience and grocery stores are gaining market share in urban areas, where consumers prioritize proximity and impulse purchases over price considerations. For instance, 7-Eleven reported a 14% year-over-year growth in refrigerated kombucha sales across its North American network in 2025. Specialty stores, such as health food retailers and organic markets, continue to command premium pricing but face increasing competition from mainstream grocers that are expanding their natural and organic product sections to attract wellness-focused consumers.
Online retail stores represent the fastest-growing subsegment within the off-trade channel, with an anticipated annual growth rate of 12.3% through 2031. Direct-to-consumer (DTC) models are enabling craft producers to bypass distributor margins and foster customer loyalty through subscription programs. For example, GT's Living Foods launched a direct-to-consumer subscription service in 2025, offering a 15% discount on recurring kombucha deliveries. Within nine months, this initiative accounted for 8% of the company’s total revenue and provided valuable zero-party data to guide flavor development.
By Packaging Type:
Sustainability Mandates Propel Can AdoptionBottles accounted for 50.89% of the packaging share in 2025, supported by consumer perceptions that glass preserves flavor integrity and conveys a premium image. However, aluminum cans are growing at an annual rate of 7.79% through 2031, driven by sustainability regulations and supply chain efficiencies. The European Union's Single-Use Plastics Directive, fully enforced in 2025, is accelerating the shift from polyethylene terephthalate (PET) bottles to aluminum cans and glass. For instance, Carlsberg has committed to achieving 100% recyclable packaging across its European portfolio by 2027. Aluminum cans offer higher recyclability, with closed-loop recycling rates exceeding 70% in developed markets compared to 30% for glass. Additionally, their lighter weight reduces transportation emissions by 15% to 20% per unit shipped [3]Source: The Aluminum Association, “Sustainability Report 2025,” aluminum.org. In 2025, Anheuser-Busch InBev invested USD 120 million in expanding can manufacturing capacity across four continents, anticipating continued substitution from bottles as corporate net-zero commitments influence procurement strategies.
Tetra packs and cartons are gaining popularity in ambient-stable fermented beverages, particularly in regions with limited refrigerated retail infrastructure. Tetra Pak reported an 18% volume growth in aseptic packaging for fermented dairy drinks in the Middle East and Africa during 2025. Kegs and barrels remain critical for on-trade distribution, especially in craft beer and kombucha taprooms, but face volume challenges as on-premise consumption lags behind off-trade growth. Sustainability-focused innovation is evident in refillable glass bottle systems, such as those piloted by Remedy Drinks in Australia. In this system, consumers return empty bottles to retail partners for cleaning and refilling, reducing single-use packaging by 85% per unit consumed.

Geography Analysis
APAC, North America and Europe Fermented Drinks Market
In 2025, the Asia-Pacific region led the global market, capturing 33.82% of the total market share. This dominance was primarily driven by China's beer consumption, which remains the largest globally by volume, despite lower per-capita intake compared to developed markets. Japan's sake industry, deeply rooted in tradition, is transitioning toward export-oriented premiumization as domestic demand declines. In China, the fermented beverage market is evolving, with mass-market lagers losing ground to craft beer and imported cider among urban millennials seeking alternatives to legacy brands associated with banquet culture. Traditional fermented dairy drinks like suanmei tang continue to maintain strongholds in rural provinces. Japan's sake exports increased by 12% in volume in 2025, supported by demand from North American and European fine-dining establishments. However, domestic breweries face succession challenges as younger generations show less interest in inheriting family operations, creating opportunities for corporate consolidation.
India and Europe Fermented Drinks Market
India emerged as the fastest-growing segment in 2025, with kombucha and kefir gaining popularity in tier-1 cities. This growth is attributed to the expansion of health-food retailers and the availability of direct imports through e-commerce platforms. However, regulatory uncertainty surrounding probiotic health claims has limited broader marketing efforts. In Europe, kombucha adoption is also rising among health-conscious urban consumers, contributing to the region's overall growth. Germany's craft breweries achieved a 6% market share in 2025 by adhering to traditional ingredients while experimenting with fermentation techniques, despite the constraints of the Reinheitsgebot purity law, which dates back to 1516.
United Kingdom and North America Fermented Drinks Market
Other notable developments include the United Kingdom's cider market, which remains the largest globally on a per-capita basis. Heineken's Strongbow and Pernod Ricard's Bulmers held a combined 60% market share but faced volume pressures from the increasing popularity of hard seltzers and ready-to-drink cocktails among younger consumers. In North America, the United States accounted for the majority of regional volume, driven by the proliferation of craft beer and the mainstreaming of kombucha in grocery and convenience store channels. The Boston Beer Company's Samuel Adams brand experienced volume declines in 2025 as consumer preferences shifted toward lower-calorie hard seltzers and non-alcoholic alternatives. In response, the company expanded its Truly hard seltzer line and acquired a minority stake in a kombucha producer. PepsiCo's KeVita and Coca-Cola's Health-Ade competed for leadership in the kombucha category, with both brands achieving distribution in over 30,000 retail outlets by 2025 and investing in national advertising campaigns positioning kombucha as a functional alternative to soda.
Regulatory Landscape
Regulation for fermented drinks is tightening around food safety controls, probiotic claims, and alcohol-threshold compliance, especially for kombucha and other low-ABV products that can drift upward during distribution. In the United States, products below 0.5% ABV generally sit within non-alcoholic regulatory channels, while products at or above 0.5% ABV can move into Alcohol and Tobacco Tax and Trade Bureau (TTB) oversight for formula and labeling, which increases compliance and monitoring burdens for brands managing active fermentation.
In the European Union, mandatory HACCP implementation under Regulation (EC) No 852/2004 remains a baseline requirement for fermented beverage operators. In 2025, the EU introduced stricter expectations for substantiating probiotic strain identity when health claims are used, including whole-genome sequencing in EFSA-related compliance pathways. For 2026, EU novel-food authorizations and labeling conditions for microbiome-linked ingredients, including amended conditions for pasteurized Akkermansia muciniphila under EU 2026/391, point to a clearer but more documentation-heavy route for functional and next-generation fermented drink formulations in non-alcoholic segments.
Value Chain Analysis
The fermented drinks value chain spans agricultural and specialty inputs (barley, fruit, tea, dairy, and cultures/strains), processing aids and packaging (glass bottles, aluminum cans, and aseptic cartons), fermentation and downstream stabilization (including cold-chain or shelf-stable processing), and route-to-market via off-trade, on-trade, and fast-expanding online retail. Operational bottlenecks concentrate on strain management, shelf-life control, and compliance testing for live-culture products, which can drive investment in preservation technologies and tighter QA systems to protect retailer service levels.
Route-to-market control and portfolio adjacency are also reshaping margin capture. Challenger fermented brands are using retailer programs and direct supply agreements to bypass distribution barriers, highlighted by REAL securing a nationwide rollout into over 880 Tesco stores in April 2026 through the Tesco Accelerator Programme. At the same time, consolidation and capability-buying are pulling niche fermentation brands into larger beverage platforms, including AG Barrs February 2026 acquisition of Fentimans (and Frobishers) and Millstream Brewings April 2026 acquisition of Kismet Kombucha, both of which leverage existing production and distribution infrastructure to scale fermented and adult soft drink offerings.
Competitive Landscape
The global fermented drinks market is characterized by low concentration, with multinational corporations such as Anheuser-Busch InBev, Heineken, and Danone competing alongside numerous regional craft producers and family-owned breweries. These smaller players collectively account for 40% to 45% of global volume. This market fragmentation is driven by low barriers to entry in the craft segment, where fermentation equipment costs range from USD 50,000 to USD 200,000. Additionally, niche players leverage localized flavors and health-focused positioning to build loyal customer bases without relying on large-scale operations. Multinational companies are focusing on portfolio diversification, with PepsiCo and Coca-Cola acquiring kombucha brands to offset declining soda consumption. Similarly, beer producers like Carlsberg and Asahi are investing in non-alcoholic fermented beverages to appeal to health-conscious consumers and expand their market reach.
Significant growth opportunities exist in hybrid categories such as hard kombucha and probiotic energy drinks. These segments remain underdeveloped, with limited presence from established players, while consumer demand is growing faster than supply-side innovation. Companies that can innovate and meet this demand are well-positioned to capture market share in these emerging categories. The ability to address consumer preferences for functional beverages that combine health benefits with unique flavors will be a key driver of success in these hybrid segments.
Emerging disruptors are utilizing direct-to-consumer models and proprietary fermentation technologies to bypass traditional distribution channels. For example, GT's Living Foods and Remedy Drinks have achieved national scale without relying on distributor networks, which typically take 25% to 35% margins. In 2024, Danone filed a patent for a continuous fermentation bioreactor that reduces production cycle time by 40% while maintaining probiotic viability above 2 billion colony-forming units (CFU) per serving. This technological advancement could lower production costs and enable competitive pricing in mass-market channels. Regulatory compliance is becoming a critical factor in the market, as smaller producers face challenges in meeting the costs of third-party testing and strain identification required by the United States Food and Drug Administration (FDA) and the European Food Safety Authority (EFSA) guidelines. This creates consolidation opportunities for larger companies with established regulatory infrastructure. The next phase of competition in the market will likely focus on standardizing fermentation processes, optimizing cold-chain logistics, and educating consumers on probiotic efficacy without risking enforcement actions from health authorities.
Fermented Drinks Industry Leaders
Anheuser-Busch InBev SA/NV
Heineken N.V.
Carlsberg Group
The Boston Beer Company
- *Disclaimer: Major Players sorted in no particular order
Fermented Drinks Market Companies Covered in this Report
- Anheuser-Busch InBev SA/NV
- Heineken N.V.
- Carlsberg Group
- The Boston Beer Company
- Paine Schwartz Partners
- GT’s Living Foods
- PepsiCo Inc.
- The Coca-Cola Company
- Danone SA
- Nestlé SA
- Yakult Honsha Co. Ltd
- Bright Food Group Co. Ltd
- Schreiber Foods Inc.
- Bio-tiful Dairy Ltd
- Asahi Group Holdings
- Pernod Ricard SA
- Fentimans Ltd
- Remedy Drinks
- Kombucha Wonder Drink
- Lactalis Group

Market Opportunities and Future Outlook
Functional and non-alcoholic fermented drinks create whitespace in premium, low-sugar positioning where compliance-ready health and microbiome narratives can be paired with retail execution. The market already shows mainstream pull-through for fermentation-led propositions in off-trade: in April 2026, REAL expanded slow-fermented sparkling tea distribution into over 880 Tesco stores, showing that large-chain listings can move fermented propositions beyond specialty channels when supply consistency and merchandising support are in place.
Cross-category investment is widening the competitive set and increasing partnership opportunities across packaging, cold-chain, and co-manufacturing. Capacity and network expansions by global beverage operators also support broader fermented drink adjacencies, including premium beer and flavored malt bases that anchor hard-fermented hybrids in developed markets. In May 2026, Diageo opened the Littleconnell Brewery in Ireland under a near EUR 1 billion investment program (2020-2029), and in March 2026 it received planning permission to double capacity at the same site, reinforcing the role of large, modern brewing assets in supplying innovation pipelines and export-oriented portfolios while smaller brands focus on differentiated fermentation processes and DTC-led community building.
Recent Industry Developments in Fermented Drinks Market
- February 2026: Anheuser-Busch completed the acquisition of BeatBox, adding a scaled ready-to-drink party punch platform to its Beyond Beer portfolio. The deal expands Anheuser-Buschs reach in fast-turn convenience and off-trade formats that sit adjacent to flavored fermented and RTD occasions, increasing competitive pressure on smaller premium and craft players.
- June 2025: Anheuser-Busch commenced retail sales of Phorm Energy, a nootropic-infused energy drink developed in partnership with 1st Phorm and Dana White. The launch shows how major beverage groups use existing route-to-market strength to push functional positioning into mainstream shelves, raising the bar for fermented functional drinks competing for the same wellness-led consumer spend.
- November 2024: Bliss Body introduced Indias first millet-fermented functional beverage range with sugar-free formulations in multiple flavors. This launch broadened the ingredient and fermentation base beyond tea and dairy, supporting product localization strategies in emerging markets where affordability, shelf stability, and culturally familiar grains can accelerate adoption.


Fermented Drinks Market Report Scope and Research Methodology
Market Definition and Coverage
For this study, the fermented drinks market is defined as packaged beverages produced through controlled fermentation and sold through on-trade and off-trade channels, covering alcoholic and non-alcoholic options across major global regions.
Scope exclusions: We exclude home-brewed output, unrecorded informal sales, and fermentation inputs sold as ingredients rather than finished drinks.
Segments Covered in This Report
- By Beverage Type
- Alcoholic Fermented Beverages
- Beer
- Cider
- Sake
- Others
- Non-alcoholic Fermented Beverages
- Kombucha
- Kefir
- Fermented Dairy Drinks
- Other Non-alcoholic Fermented
- Alcoholic Fermented Beverages
- By Distribution Channel
- On-Trade
- Off-Trade
- Supermarkets/Hypermarkets
- Convenience/Grocery Stores
- Specialty Stores
- Online Retail Stores
- By Packaging Type
- Bottles
- Cans
- Tetra Packs/Cartons
- Kegs and Barrels
- Others
- By Geography
- North America
- United States
- Canada
- Mexico
- Rest of North America
- Europe
- Germany
- United Kingdom
- Italy
- France
- Spain
- Netherlands
- Poland
- Belgium
- Sweden
- Rest of Europe
- Asia-Pacific
- China
- India
- Japan
- Australia
- Indonesia
- South Korea
- Thailand
- Singapore
- Rest of Asia-Pacific
- South America
- Brazil
- Argentina
- Colombia
- Chile
- Peru
- Rest of South America
- Middle East and Africa
- South Africa
- Saudi Arabia
- United Arab Emirates
- Nigeria
- Egypt
- Morocco
- Turkey
- Rest of Middle East and Africa
- North America
Data Sources, Market Sizing, and Validation
Desk Research
Desk work starts with building the demand context for fermented drinks, and then mapping it to what is measurable in public data. We typically reference sources such as FAO statistics, UN Comtrade trade flows, USDA and other national agriculture and food statistics, OECD consumption indicators, and peer reviewed nutrition and food science journals that discuss fermented beverage trends.
On top of this, we use company annual reports, earnings call notes, and investor presentations to understand category mix, pricing moves, and channel exposure. For cross checks, we may use paid subscriptions for company financials and intelligence, news and financials, patent databases, and in some countries shipment level import export data when it helps validate trade heavy categories. This list is not exhaustive, and many other sources were also used to collect data, validate assumptions, and clarify findings.
Primary Interviews and Surveys
Primary work was used to pressure test the desk assumptions on what counts as a fermented drink in commercial terms, and how pricing and packaging are shifting by channel. We spoke with a mix of brand owners, distributors, packaging stakeholders, and category managers across APAC, EMEA, and the Americas so that regional demand signals and on-trade versus off-trade splits could be validated and adjusted.
Distribution of primary research fieldwork respondents
| Company type | Respondent position | Region |
|---|---|---|
| Top tier: 33% | CXOs: 12% | APAC: 46% |
| Mid tier: 46% | Functional/Unit leaders: 29% | EMEA: 29% |
| Smaller Players: 21% | Managers: 59% | Americas: 25% |
Market-Sizing & Forecasting
Sizing is built using a top-down model where published alcohol and non-alcohol beverage consumption, production, and trade indicators are reconstructed by region and then filtered into fermented drink categories through category shares and channel splits. The totals are then corroborated with selective bottom-up approximations, mainly by sampling supplier and brand level revenue disclosures, checking average selling price by pack type, and validating implied volumes against distribution feedback.
Key model inputs include alcoholic versus non-alcoholic mix, on-trade and off-trade share movements, packaging mix (bottles, cans, cartons, and kegs), price tier migration, and region level per capita consumption trends. Where the data is thin for smaller countries, we fill gaps using proxy indicators such as urbanization, retail penetration, and import dependence, and then adjust once primary feedback confirms whether the proxy behavior is realistic.
For forecasting, scenario analysis is used so that base case growth reflects the most consistent assumptions from interviews, such as expected premiumization pace, e-commerce share, and packaging substitution, followed by sensitivity bands for faster or slower price growth. This keeps the model repeatable and easy to trace back to the core drivers, rather than relying on hard to verify micro level sales tallies.
Data Validation & Update Cycle
Outputs are checked against independent signals, including trade balances for key fermented categories, alcohol tax and consumption trend direction (where available), and reported company performance to ensure the implied growth is not out of line. When a number looks unusual, we re-check the input series, currency timing, and channel split assumptions, and we re-contact sources if the variance still cannot be explained.
Before sign-off, the model and narrative go through a multi step internal review so calculation logic, units, and definitions remain consistent across regions and years. Reports are refreshed annually, and interim updates are made when material events occur, such as major regulatory changes, large pricing shocks, or structural channel disruptions. Right before delivery, an analyst does a final pass so the shared view reflects the latest available information.
Mordor Intelligence's Fermented Drinks Market Size Measured Against Other Published Estimates
Published market sizes for fermented drinks can vary widely even when the titles look similar, because the product boundary and the counted revenue point are not always aligned. Differences also show up when one estimate leans more on price led expansion while another leans on volume, or when the refresh date and currency conversion timing are not the same.
The table shows a noticeable spread, and in Mordor Intelligence's model the scope counts commercial sales of alcoholic and non-alcoholic fermented beverages across on-trade and off-trade, while leaving out home-brewed and informal volumes that cannot be validated consistently across countries. Some published figures also appear to anchor the total to a narrower set of probiotic style drinks or to a different starting year, which changes the implied base and the growth curve even if the forecast CAGR looks close.
Benchmark comparison
| Source | Market Size | Gaps in Research Methodology |
|---|---|---|
| Mordor Intelligence | USD 1.15 T (2026) | |
| Global Consultancy A | USD 0.97 T (2026) | Uses a lower 2026 base that appears closer to recorded retail tracked categories, which can undercount on-trade and parts of traditional fermented beverages in markets with limited disclosure, and it may apply more conservative price progression. |
| Industry Publisher B | USD 4.20 B (2026) | Looks like a narrow definition focused on selected probiotic or functional fermented drinks, so major alcoholic fermented beverages are likely not included, which compresses the total to a much smaller addressable scope. |
Taken together, the comparison points to scope and measurement choices as the main drivers of the gap, rather than a simple math difference. By keeping assumptions tied to observable consumption and trade signals, and then checking them through channel and packaging realities shared in interviews, we end up with a total that is easier to reproduce and explain year to year.


Key Questions Answered in the Report
How large is global demand for fermented drinks by 2031?
It is forecast to reach USD 1.51 trillion, growing at a 5.59% CAGR between 2026-2031.
Which segment is expanding fastest?
Non-alcoholic probiotic beverages such as kombucha and kefir are set to grow at 8.02% annually.
What region leads category value today?
Asia-Pacific commands 33.82% of global sales, driven by China and Japan.
Why are aluminum cans gaining share?
Cans offer 70% closed-loop recyclability and reduce transport emissions by 15%, aligning with corporate net-zero targets.
What regulatory hurdle most affects small brands?
Quarterly pathogen testing and genome sequencing requirements raise compliance costs by USD 50,000-150,000 per production line.
Page last updated on:


 Your data is secure and never sold or shared.


