B2C E-Commerce Market Size and Share
Market Overview
| Study Period | 2020 - 2031 |
|---|---|
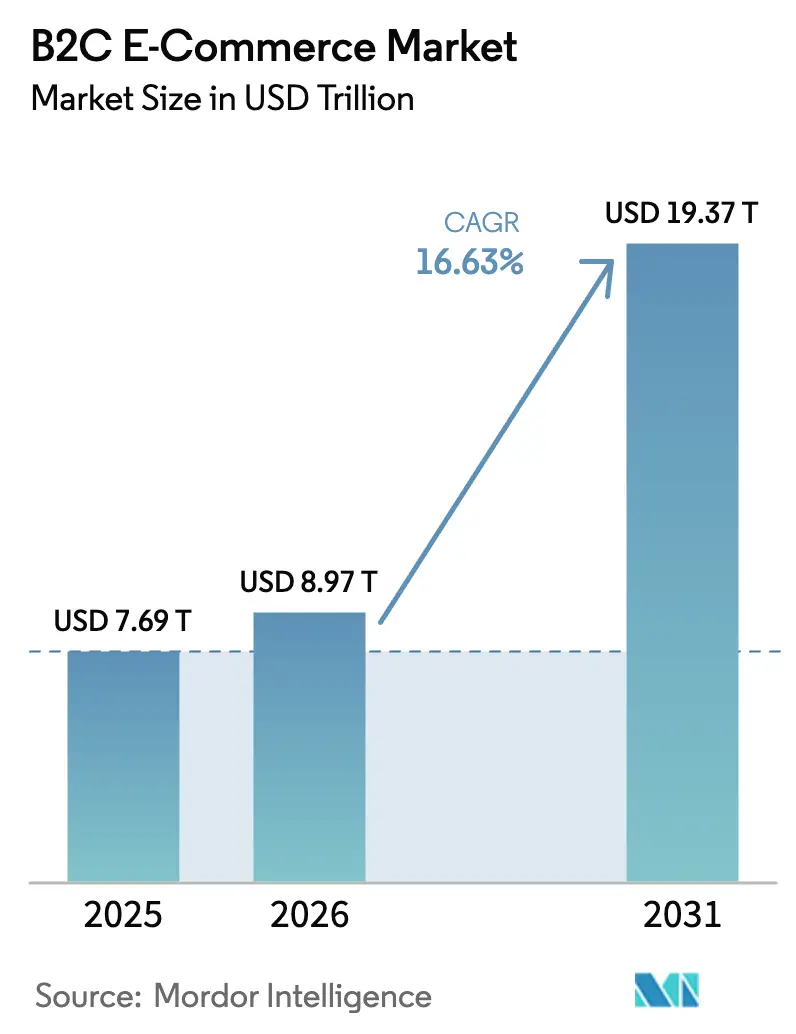
| Market Size (2026) | USD 8.97 Trillion |
| Market Size (2031) | USD 19.37 Trillion |
| Growth Rate (2026 - 2031) | 16.63% CAGR |
| Fastest Growing Market | Asia Pacific |
| Largest Market | North America |
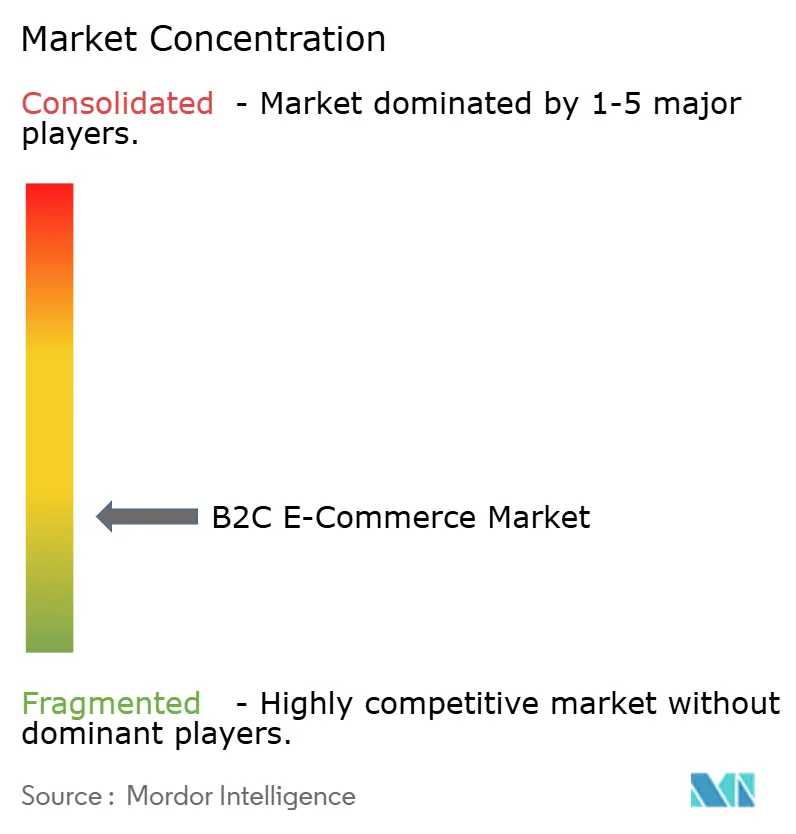
| Market Concentration | Low |
Major Players *Disclaimer: Major Players sorted in no particular order Image © Mordor Intelligence. Reuse requires attribution under CC BY 4.0. | |
B2C E-Commerce Market Analysis by Mordor Intelligence
The B2C E-Commerce market size is expected to grow from USD 7.69 trillion in 2025 to USD 8.97 trillion in 2026 and is forecast to reach USD 19.37 trillion by 2031 at 16.63% CAGR over 2026-2031. Digital wallets, already responsible for 53% of global online transaction value, are accelerating checkout speed and reducing cart abandonment, while stricter data-privacy rules raise compliance costs for cross-border platforms. Asia-Pacific remains the primary growth engine, expanding at a 22.5% CAGR as rising smartphone penetration turns tier-2 cities in China and India into major demand centers. Competitive intensity is rising in mature markets as Walmart and other omnichannel retailers enhance last-mile services to challenge Amazon’s 37.6% U.S. share. Meanwhile, regulatory reforms in Europe most notably the Digital Services Act seek to level the playing field but also introduce material operational overheads. These dynamics are tilting investment toward mobile optimization, AI-driven personalization, and flexible payment options that improve conversion and retention.[1]U.S. Census Bureau, “Quarterly Retail E-Commerce Sales Report,” census.gov
Key Report Takeaways
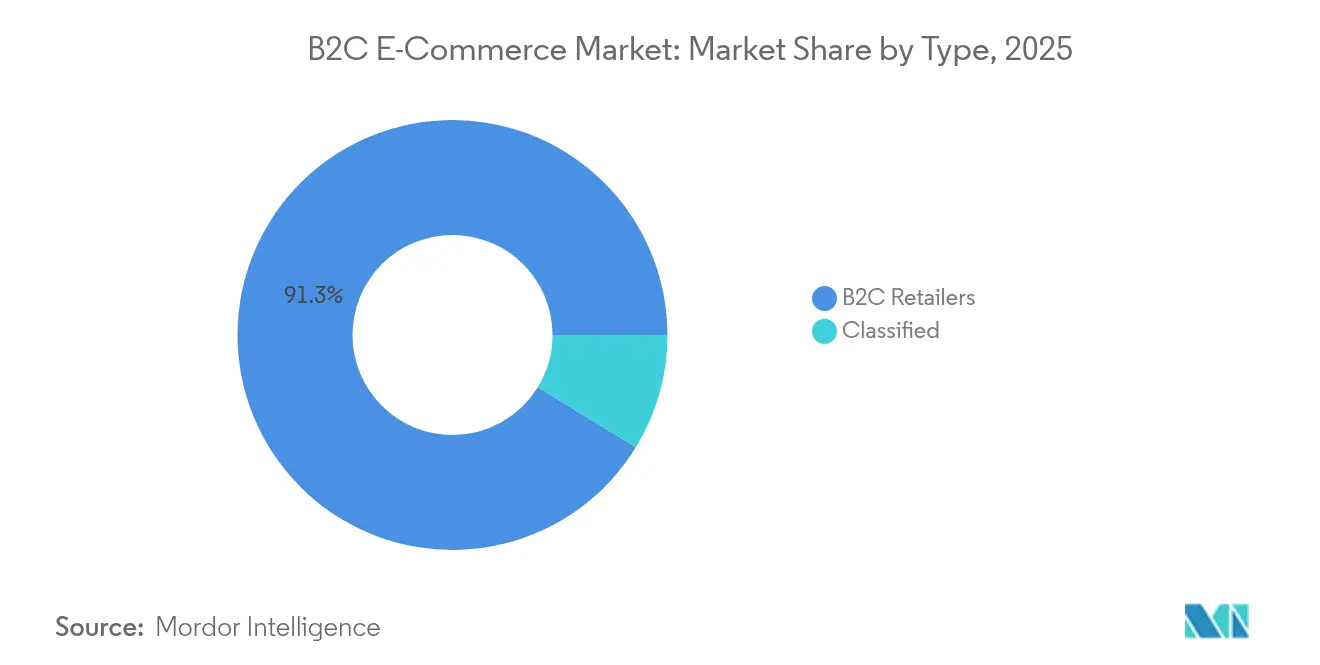
- By type, B2C retailers led with 91.25% of B2C e-commerce market share in 2025, while the classified segment is forecast to grow at a 21.12% CAGR through 2031.
- By payment method, digital wallets commanded 48.62% share of the B2C e-commerce market size in 2025 and are expected to expand at a 19.52% CAGR to 2031.
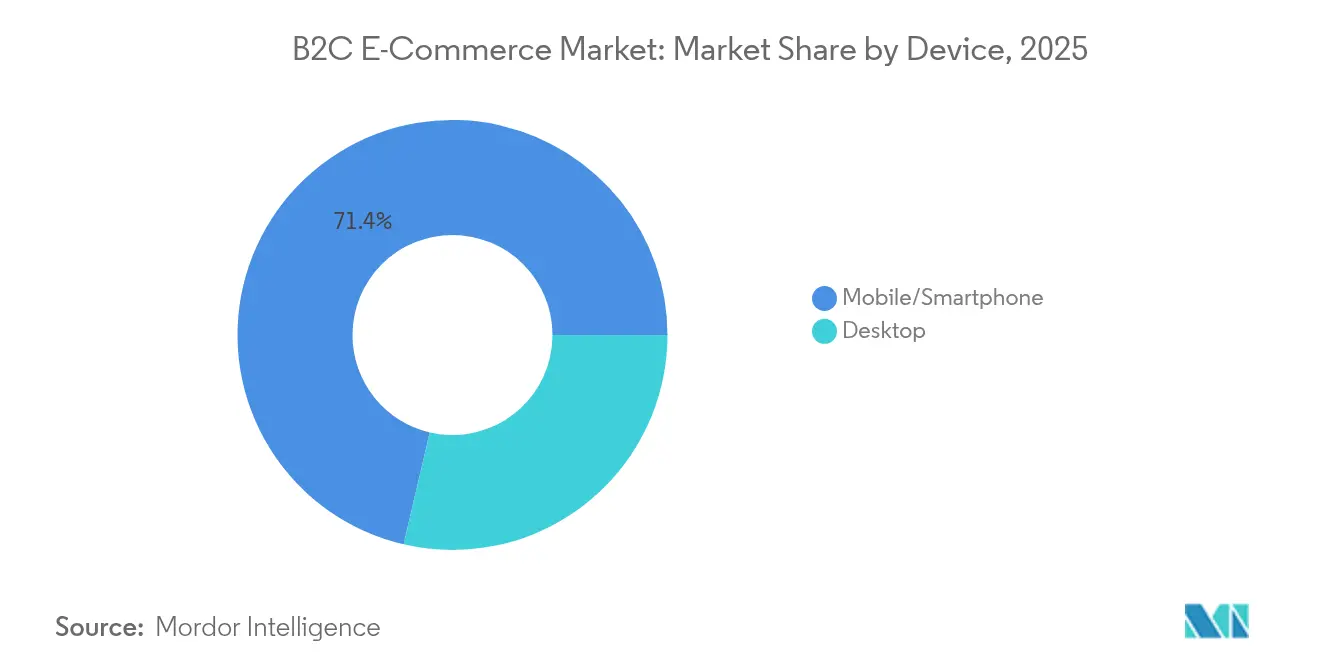
- By device, mobile captured 71.35% revenue share in 2025; it is advancing at an 18.62% CAGR to 2031.
- By application, fashion & apparel held 23.65% of the B2C e-commerce market size in 2025, whereas food & beverage is projected to grow fastest at 21.92% CAGR.
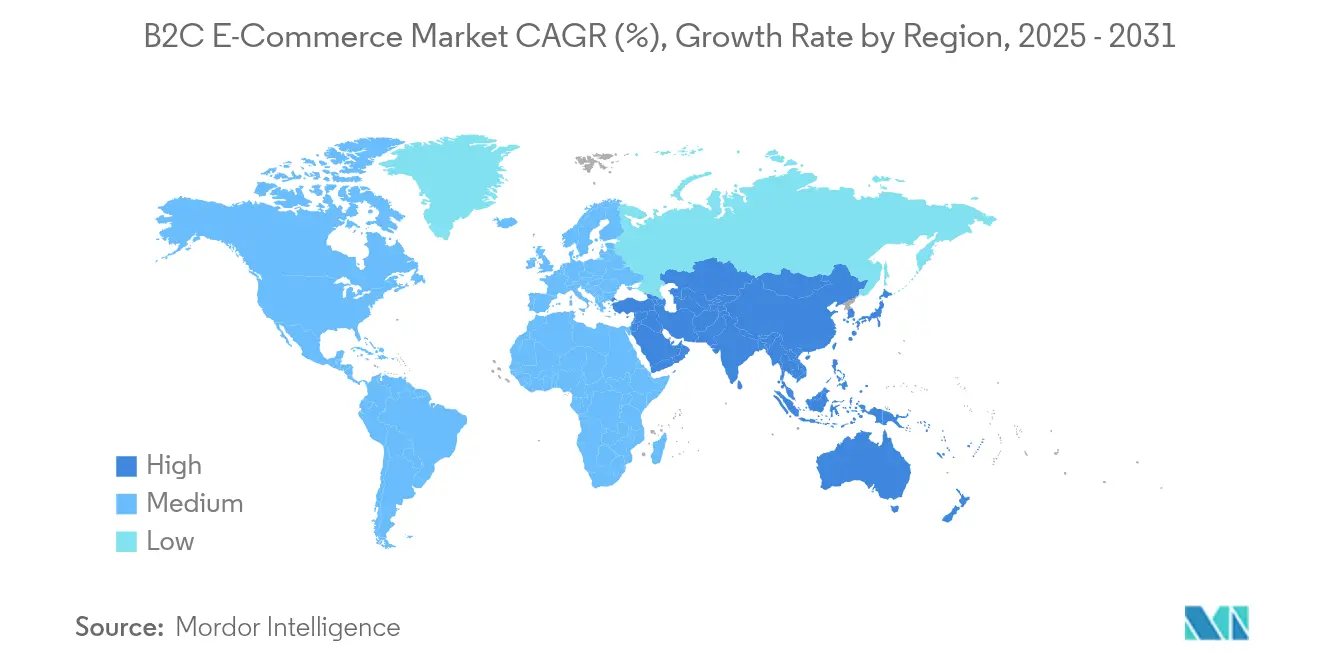
- By geography, North America accounted for 37.45% of global revenues in 2025, but Asia-Pacific is on track for the highest regional CAGR of 22.08% through 2031.
Note: Market size and forecast figures in this report are generated using Mordor Intelligence’s proprietary estimation framework, updated with the latest available data and insights as of 2026.
Global B2C E-Commerce Market Trends and Insights
Drivers Impact Analysis*
| B2C E-Commerce Market: Drivers Impact Summary | (~) % Impact on CAGR Forecast | Geographic Relevance | Peak Impact |
|---|---|---|---|
| Accelerating Mobile-First Shopping Behaviour in Asia–Pacific | +3.2% | Asia-Pacific, with spillover to global markets | Medium term (~ 3-4 yrs) |
| Rapid Urban Middle-Class Expansion in Tier-2 Chinese & Indian Cities | +2.8% | China, India, with regional influence across Asia-Pacific | Long term (≥ 5 yrs) |
| Cross-Border Selling Incentives via EU's Digital Single Market | +1.9% | European Union, with global export implications | Medium term (~ 3-4 yrs) |
| Buy-Now-Pay-Later (BNPL) Adoption Among Gen-Z North Americans | +1.5% | North America, with growing influence in Europe and APAC | Short term (≤ 2 yrs) |
| Social-Commerce Integration on Short-Video Platforms (Brazil, Indonesia) | +2.3% | Latin America, Southeast Asia | Medium term (~ 3-4 yrs) |
| Grocery-Last-Mile Delivery Innovations in GCC Countries | +1.2% | Middle East, particularly GCC countries | Short term (≤ 2 yrs) |
| Source: Mordor Intelligence | |||
Accelerating Mobile-First Shopping Behaviour in Asia–Pacific
Mobile commerce is reshaping the B2C e-commerce market as smartphones become the primary gateway to online retail. By 2025, mobile devices are expected to generate 75% of global digital sales, equivalent to USD 6.5 trillion. China already records 82% of e-commerce transactions via mobile, a figure that underscores the strategic value of super-app ecosystems that integrate payments, logistics, and social engagement. Brands with dedicated apps enjoy conversion rates 30% higher than mobile-optimized web shops, prompting merchants to allocate greater budgets to app-centric marketing and retention. The trend is amplified by reliable 5G networks and digital-wallet ubiquity, which lower latency and reduce friction at checkout. As a result, mobile optimization is no longer optional; it is a baseline requirement for customer acquisition and lifetime-value enhancement across the B2C e-commerce market.
Rapid Urban Middle-Class Expansion in Tier-2 Chinese & Indian Cities
Emergent middle-class households in tier-2 and tier-3 urban centers now drive more than half of new online shoppers in both China and India. In India, these cities accounted for 64% of new brick-and-mortar store launches in March 2024, signaling omnichannel strategies that mirror rising digital demand. Disposable income growth and improved logistics corridors shorten delivery times, encouraging first-time online buyers to leapfrog traditional retail formats. Consumption behaviors differ from megacities: value seekers in smaller markets prioritize deals and curated assortments over ultrafast delivery, directing attention toward specialized marketplaces that emphasize price efficiency. Consequently, merchants expanding into these locales must localize merchandising, payment options, and after-sales service to convert first-time users into repeat buyers and sustain the broader B2C e-commerce market growth trajectory.[3]Anchanto, “Top 11 Ecommerce Logistics Trends in UAE in 2025,” anchanto.com
Cross-Border Selling Incentives via EU Digital Single Market
The EU’s Digital Single Market initiative lifted B2C online sales to EUR 887 billion (USD 960 billion) in 2023, equivalent to 4% of European GDP. Policy tools such as the Vertical Block Exemption Regulation and the Digital Markets Act dismantle geo-blocking and platform exclusivity, making it simpler for mid-size brands to reach pan-European customers. Harmonized VAT thresholds and streamlined consumer protection rules improve price transparency and shipping predictability, nurturing higher conversion for cross-border carts. Despite administrative complexity, the net result is faster inventory turn and wider assortment across the B2C e-commerce market. Merchants that implement localized domain management, multi-currency checkout, and compliance automation can monetize the broadened addressable market ahead of slower-moving rivals.[2]European Commission, “Questions and Answers on the Digital Services Act,” ec.europa.eu
Buy-Now-Pay-Later (BNPL) Adoption Among Gen-Z North Americans
BNPL services have overtaken credit cards as the preferred online payment tool for Gen-Z shoppers during peak seasons, increasing holiday-period transactions by 15% in 2024. Retailers offering BNPL observe average basket sizes 6.4% higher than those relying on traditional card rails. The model removes upfront credit checks, reducing perceived financial barriers for younger, lower-income segments and improving conversion for discretionary product categories. However, adoption is maturing, with Bank of America data showing only a 0.5 percentage-point usage uptick year over year, indicating that growth will shift from volume acquisition to margin optimization. Merchants therefore explore incremental revenue via bundled services such as extended warranties and subscription add-ons, embedding BNPL deeper into the monetization framework of the B2C e-commerce market.
Restraints Impact Analysis*
| B2C E-Commerce Market: Restraints Impact Summary | (~) % Impact on CAGR Forecast | Geographic Relevance | Peak Impact |
|---|---|---|---|
| Heightened GDPR & Digital Services Act Compliance Costs | -1.8% | European Union, with global implications for multinational platforms | Medium term (~ 3-4 yrs) |
| Counterfeit Risk on Third-Party Marketplaces (MENA & LATAM) | -1.2% | Middle East, North Africa, Latin America | Short term (≤ 2 yrs) |
| Rising Cross-Border Logistics Surcharges Post-UPU Reform | -0.9% | Global, with particular impact on China-to-US/EU shipments | Short term (≤ 2 yrs) |
| Persistent Cash-On-Delivery Dependency in African Markets | -1.5% | Africa, with spillover effects in parts of Middle East and South Asia | Long term (≥ 5 yrs) |
| Source: Mordor Intelligence | |||
Heightened GDPR & Digital Services Act Compliance Costs
European rules now require enhanced data processing disclosures, traceable ad targeting, and algorithmic transparency, driving annual compliance outlays of USD 430 million per large platform. Non-compliance can trigger fines up to 6% of global turnover, prompting firms to invest in automated moderation, incident reporting, and consent management. The opportunity cost includes delayed feature releases and diversion of R&D funds that could have improved user experience. Smaller merchants face higher commission fees as platforms pass through regulatory overhead, reducing price competitiveness in the B2C e-commerce market. Over time, cost pressures may accelerate industry consolidation around players with the scale to absorb compliance spending.
Counterfeit Risk on Third-Party Marketplaces (MENA & LATAM)
Proliferation of counterfeit listings erodes brand equity and consumer trust, especially where IP enforcement is weak. False-positive fraud filters caused USD 308 billion in lost e-commerce revenue worldwide during 2023. Merchants operating in Latin America and the Middle East allocate larger budgets to authentication, warranty programs, and customer service, compressing margins. Elevated chargeback ratios also raise acquiring-bank fees, complicating cost-to-serve calculations. Platforms that deploy AI-based image recognition and blockchain provenance tooling can mitigate reputational damage and differentiate on trust, limiting the drag on the B2C e-commerce market.
*Our forecasts treat driver/restraint impacts as directional, not additive. The impact forecasts reflect baseline growth, mix effects, and variable interactions.
Segment Analysis
By Type: Classified Growth Challenges Retail Dominance
The B2C retailers segment delivered 91.25% of 2025 revenue, underscoring consumer familiarity with large-scale storefronts and integrated logistics. Transactional depth, loyalty programs, and extensive SKU breadth enable these players to maintain high repeat-purchase rates. Nonetheless, the classified segment’s 21.12% CAGR illustrates shifting preferences toward specialized discovery models that connect supply and demand with lower listing fees. Baltic Classifieds Group grew H1 2025 revenue 17% to EUR 41.8 million (USD 45.7 million) as real-estate and job portals monetized premium placements.
Classified marketplaces deploy lean inventory-light models, improving capital efficiency and facilitating rapid regional expansion. As a result, they attract SMEs seeking targeted reach without the expense of full-service marketplaces. For incumbent retailers, rising traffic fragmentation requires broader 3P strategies; Walmart pushed third-party share from 26% to 35.8% to protect wallet share. The B2C e-commerce market is therefore converging toward hybrid structures where proprietary logistics coexist with peer-to-peer listings, expanding consumer choice while intensifying competition.


By Payment Method: Digital Wallets Reshape Transaction Landscape
Digital wallets processed 48.62% of 2025 online sales and are forecast to grow at a 19.52% CAGR, more than double the pace of card-based payments. Penetration reaches 82% of e-commerce value in China and 56% in India, reinforcing Asia-Pacific’s leadership in cashless transactions. Wallet ecosystems bundle loyalty, micro-lending, and insurance, deepening user stickiness and generating ancillary revenue streams that extend beyond pure payments.
Cards continue to lose share projected to drop from 31% to 20% by 2028 as tokenization and biometric authentication reduce friction for wallet transactions. Account-to-account schemes leveraging open banking raise competitive stakes by cutting interchange fees. Merchants that integrate multiple wallet providers capture a broader demographic, shortening settlement cycles and lowering chargeback risk, thereby improving the overall economics of the B2C e-commerce market.
By Device: Mobile Dominance Accelerates Platform Evolution
Mobile accounted for 71.35% of 2025 transactions and is on track for an 18.62% CAGR, fueled by app-centric engagement and one-click checkout experiences. Average daily mobile screen time of 4.4 hours translates into high-frequency micro-purchases. Meanwhile, desktop remains relevant for complex, high-ticket orders, with average order values 35.1% higher than mobile. Retailers are narrowing this gap by embedding augmented-reality previews and AI chat assistants into mobile flows, boosting consumer confidence for larger purchases.
In parallel, mobile-wallet integration simplifies in-app payment, with total wallet transactions expected to exceed USD 10 trillion by 2025. Social platforms blur the boundary between discovery and checkout; Instagram and Facebook collectively influenced USD 1.2 trillion in sales during 2024, driving incremental traffic to merchant apps and reinforcing mobile’s primacy within the B2C e-commerce market.
By Application: Food & Beverage Outpaces Traditional Categories
Fashion & apparel retained a 23.65% revenue share in 2025, benefitting from fast-turnover assortments and influencer-driven demand cycles. Yet food & beverage is the fastest-expanding category, projected at a 21.92% CAGR as quick-commerce models normalize 30-minute grocery fulfillment in dense urban corridors. Consumer electronics sustain a sizeable share due to standardized SKUs and aggressive promotions, while beauty & personal care scales via subscription replenishment.
Furniture & home décor adoption accelerates through augmented-reality visualization that reduces size and color uncertainty. Across segments, IBM identifies modernization, dynamic product-experience management, order intelligence, and secure payments as four AI use cases boosting conversion and lifetime value. These advances collectively deepen category penetration and widen the addressable base for the B2C e-commerce market.
Geography Analysis
North America generated 37.45% of global revenue in 2025, anchored by mature logistics infrastructure and a 90% internet-penetration rate. U.S. retail e-commerce sales grew 9.4% year over year to USD 308.9 billion in Q4 2024. BNPL services continue to shape spending habits, particularly among Gen Z cohorts who favor flexible repayment over revolving credit. Despite Amazon’s dominant 37.6% share, heightened competition from Walmart, Target, and niche D2C brands is pushing platforms to accelerate same-day delivery and experiment with generative-AI customer service to sustain repeat purchase frequency across the B2C e-commerce market.
Asia-Pacific is the fastest-growing region, expanding at 22.08% CAGR on the back of mobile-commerce ubiquity and rising discretionary income. China’s market reached USD 1.47 trillion in sales, while India aims to triple from USD 125 billion in FY 2024 to USD 345 billion by FY 2030. Unified Payments Interface transactions in India hit USD 270.3 billion in January 2025, showcasing real-time payment scalability. Tier-2 and tier-3 city expansion broadens reach and underpins long-term volume growth, making the region indispensable to the future B2C e-commerce market.
Europe is undergoing regulatory transformation. The Digital Single Market generated EUR 887 billion (USD 960 billion) in 2023 B2C sales, yet regional disparities persist, with Western Europe losing one percentage point of share as Southern and Eastern Europe recorded double-digit growth. The Digital Services Act introduces strict content moderation standards, compelling platforms to overhaul ad-targeting algorithms. While these measures raise short-term costs, harmonized rules reduce long-run market fragmentation and enhance cross-border scalability within the B2C e-commerce market.
Latin America shows strong momentum, led by MercadoLibre’s logistics investment that slashed average delivery times in Brazil. Social-commerce channels gain substantial traction, particularly on WhatsApp, where small merchants conduct end-to-end transactions inside chat threads. Cybersecurity remains a concern; 79% of organizations reported ransomware attacks in 2024. As digital wallets penetrate, cross-border sales from Asia are projected to account for more than one-quarter of the region’s volume by 2026.
The Middle East and Africa reveal diverse adoption curves. In the GCC, e-commerce revenues are rising 23% annually as the UAE logistics sector is forecast to top USD 30 billion in 2025. Cash-on-delivery remains prevalent in parts of Africa, dampening digital-checkout efficiency; however, the African Continental Free Trade Area aims to grow regional online sales to USD 50 billion by 2027. Unified payment standards and infrastructure upgrades will be critical to unlocking latent demand and accelerating the B2C e-commerce market across the continent.

Competitive Landscape
The B2C e-commerce market combines concentrated leadership in mature economies with fragmentation in emerging regions. Amazon and Alibaba leverage proprietary logistics networks, cloud infrastructure, and media ecosystems to command scale advantages. Shopify’s partnership with Google integrates AI-based recommendations into merchant storefronts, augmenting discovery at minimal code overhead. In Latin America, MercadoLibre invests USD 500 million to deepen last-mile density, reinforcing service differentiation.
White-space expansion centers on tier-2 cities and vertical marketplaces. Temu, owned by Pinduoduo, is forecast to grow at a 58.6% CAGR by exploiting gamified pricing and aggressive seller subsidies. Walmart’s shift toward a 3P model—lifting third-party GMV share to 35.8%—demonstrates the strategic value of network effects that diversify assortment without inventory risk. AI adoption is universal: two-thirds of merchants deploy machine learning for personal recommendations and inventory forecasting, compressing stock-out rates and elevating customer lifetime value. Taken together, these competitive levers reinforce the dynamism and scale of the global B2C e-commerce market.
B2C E-Commerce Industry Leaders
Amazon.com, Inc.
Alibaba Group Holding Limited
eBay Inc.
Walmart Inc.
Flipkart Private Limited
- *Disclaimer: Major Players sorted in no particular order

Recent Industry Developments
- May 2025: Shopify expanded its partnership with Google, integrating AI-powered product recommendations to boost merchant conversion.
- April 2025: Amazon launched “Amazon Global Store” on JD.com, offering 400,000 SKUs to Chinese consumers and enhancing cross-border reach.
- March 2025: Walmart completed its exit from the Chinese market, reallocating resources toward North American omnichannel expansion.
- February 2025: Nuvei partnered with Temu to add localized payment methods such as Konbini and Blik, improving checkout flexibility.


Global B2C E-Commerce Market Report Scope
Business-to-Consumer (B2C) refers to the process of selling products and services directly between a business and consumers who are the end-users of its products or services.
The b2c e-commerce market is segmented by applications (beauty & personal care, consumer electronics, fashion and apparel, food & beverage, furniture & home, other applications), by Geography (North America [United States, Canada], Europe [United Kingdom, Germany, France, Rest of Europe], Asia-Pacific [China, Japan, India, South Korea, Rest of Asia-Pacific], Latin America [Brazil, Mexico, Argentina, Rest of Latin America], Middle East and Africa [United Arab Emirates, Saudi Arabia, South Africa, Rest of Middle East and Africa]). The market sizes and forecasts are provided in terms of value (USD) for all the above segments.
| B2C Retailers |
| Classified |
| Cards |
| Digital Wallet |
| Cash on Delivery |
| Other Payment Method |
| Mobile/Smartphone |
| Desktop |
| Beauty and Personal Care |
| Consumer Electronics |
| Fashion and Apparel |
| Food and Beverage |
| Furniture and Home |
| Other (Toys, DIY, Media, etc.) |
| North America | United States |
| Canada | |
| Mexico | |
| Europe | Germany |
| United Kingdom | |
| France | |
| Spain | |
| Rest of Europe | |
| Asia-Pacific | China |
| India | |
| Japan | |
| South Korea | |
| Rest of Asia-Pacific | |
| South America | Brazil |
| Argentina | |
| Rest of South America | |
| Middle East | Saudi Arabia |
| United Arab Emirates | |
| Rest of Middle East | |
| Africa | Nigeria |
| South Africa | |
| Rest of Africa |
| By Type | B2C Retailers | |
| Classified | ||
| By Payment Method | Cards | |
| Digital Wallet | ||
| Cash on Delivery | ||
| Other Payment Method | ||
| By Device | Mobile/Smartphone | |
| Desktop | ||
| By Application | Beauty and Personal Care | |
| Consumer Electronics | ||
| Fashion and Apparel | ||
| Food and Beverage | ||
| Furniture and Home | ||
| Other (Toys, DIY, Media, etc.) | ||
| By Geography | North America | United States |
| Canada | ||
| Mexico | ||
| Europe | Germany | |
| United Kingdom | ||
| France | ||
| Spain | ||
| Rest of Europe | ||
| Asia-Pacific | China | |
| India | ||
| Japan | ||
| South Korea | ||
| Rest of Asia-Pacific | ||
| South America | Brazil | |
| Argentina | ||
| Rest of South America | ||
| Middle East | Saudi Arabia | |
| United Arab Emirates | ||
| Rest of Middle East | ||
| Africa | Nigeria | |
| South Africa | ||
| Rest of Africa | ||


Key Questions Answered in the Report
What is the projected value of the B2C e-commerce market by 2031?
The market is forecast to reach USD 19.37 trillion by 2031, growing at a 16.63% CAGR.
Which payment method is growing fastest in online retail?
Digital wallets, already at 48.62% share, are advancing at a 19.52% CAGR as biometric security and super-app ecosystems gain traction.
Why are classified marketplaces expanding more quickly than traditional retailers?
They operate asset-light models with lower listing fees, attracting SMEs and consumers looking for targeted product discovery, resulting in a 21.12% CAGR.
How are new EU regulations affecting e-commerce platforms?
The GDPR and Digital Services Act increase compliance costs and mandate greater transparency, shaving an estimated 1.8 percentage points off the sector’s CAGR.
Which region will contribute most to future e-commerce growth?
Asia-Pacific, with a 22.08% CAGR, driven by mobile-first consumers in tier-2 Chinese and Indian cities and expanding digital-payment adoption.
How is BNPL influencing consumer behavior in North America?
BNPL services have overtaken credit cards among Gen Z for online purchases, lifting average basket sizes by about 6.4% during peak seasons.
Page last updated on:


