India D2C E-commerce Market Size and Share
Market Overview
| Study Period | 2020 - 2031 |
|---|---|
| Forecast Data Period | 2026 - 2031 |
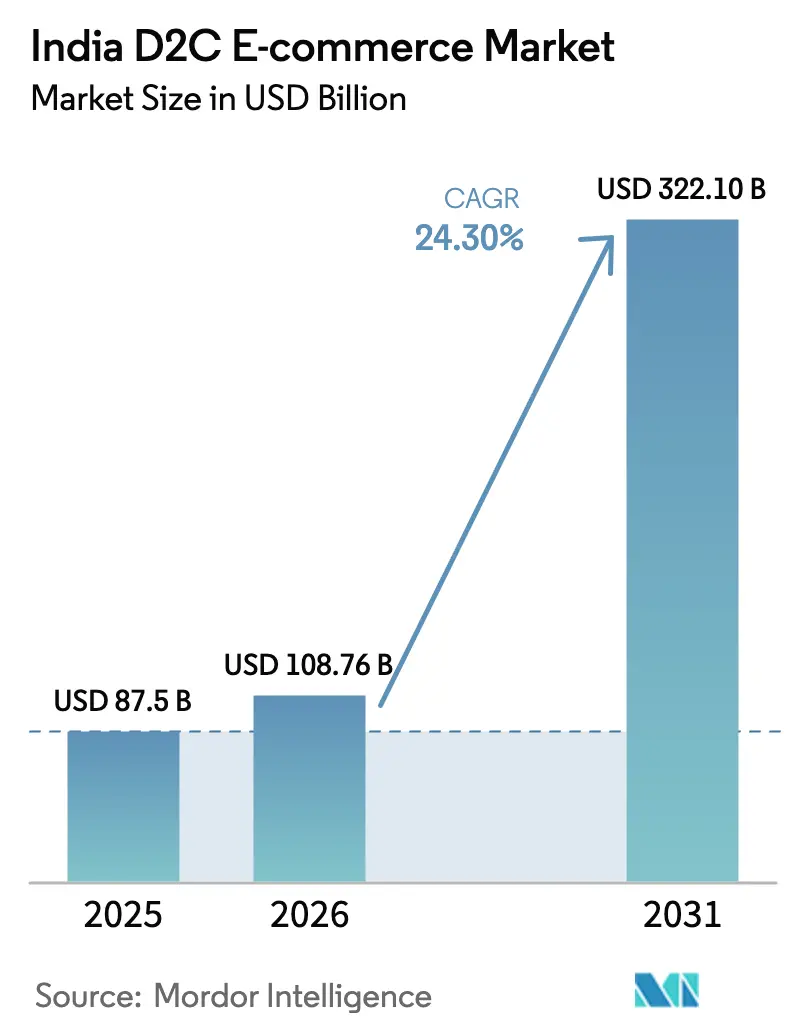
| Base Year Market Size (2025) | USD 87.5 Billion |
| Market Size (2026) | USD 108.76 Billion |
| Market Size (2031) | USD 322.1 Billion |
| Growth Rate (2026 - 2031) | 24.30% CAGR |
| Market Concentration | Low |
Major Players *Disclaimer: Major Players sorted in no particular order Image © Mordor Intelligence. Reuse requires attribution under CC BY 4.0. | |
India D2C E-commerce Market Analysis by Mordor Intelligence
The India D2C E-commerce market size was valued at USD 87.5 billion in 2025 and estimated to grow from USD 108.76 billion in 2026 to reach USD 322.1 billion by 2031, at a CAGR of 24.30% during the forecast period (2026-2031). Intensifying smartphone adoption in tier-2 and tier-3 cities, the nationwide rollout of the Open Network for Digital Commerce (ONDC), and GST-enabled logistics efficiencies are accelerating direct-to-consumer adoption and reducing structural frictions for brands. Delhi NCR retains leadership thanks to high disposable incomes and same-day delivery coverage for 60% of pin codes, yet Hyderabad’s cost advantages and supportive start-up ecosystem position it as the fastest-growing city node. Working-capital stress, driven by 25-30% cash-on-delivery (COD) return rates, has catalyzed revenue-based financing models that extend 15-30% of monthly sales as quick liquidity, sustaining scale-up ambitions for capital-efficient brands. Inflation in digital marketing cost-per-click (CPC) and stricter data-privacy norms compel brands to diversify toward social and community commerce channels, with live-commerce conversion rates six to eight times higher than display advertising
Key Report Takeaways
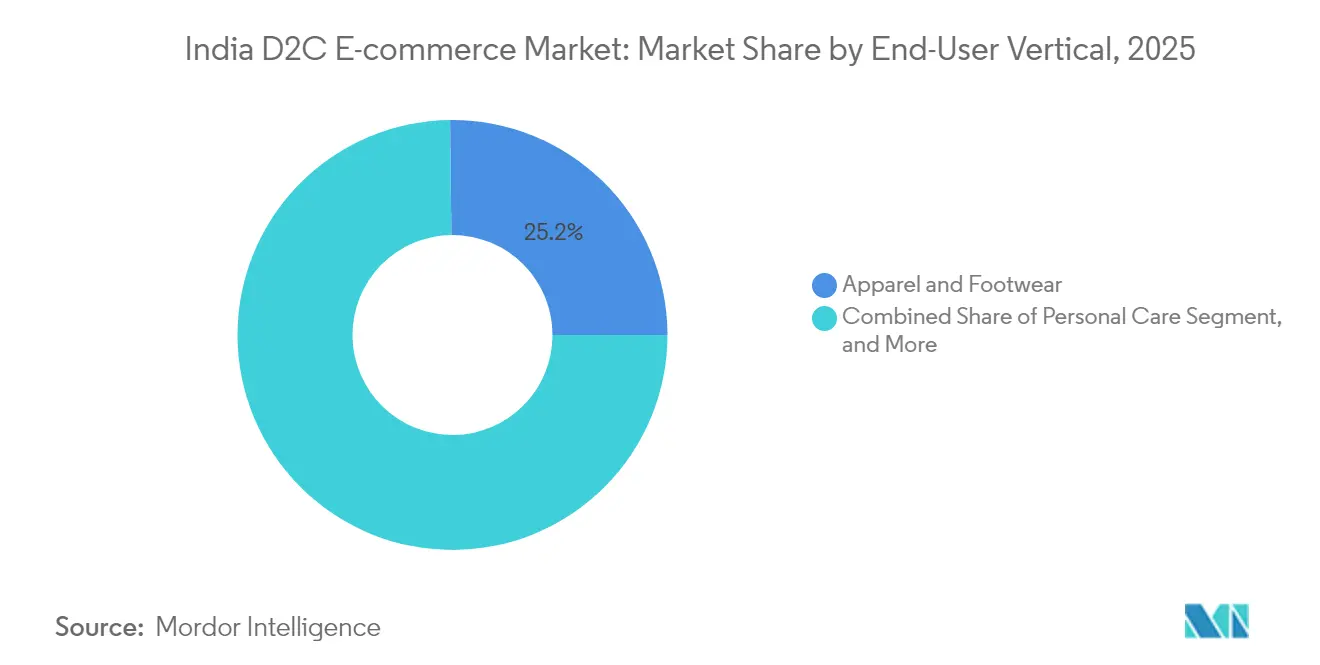
- By end-user vertical, Apparel and Footwear led with 25.18% of India D2C E-commerce market share in 2025, while Personal Care is projected to advance at a 24.92% CAGR to 2031.
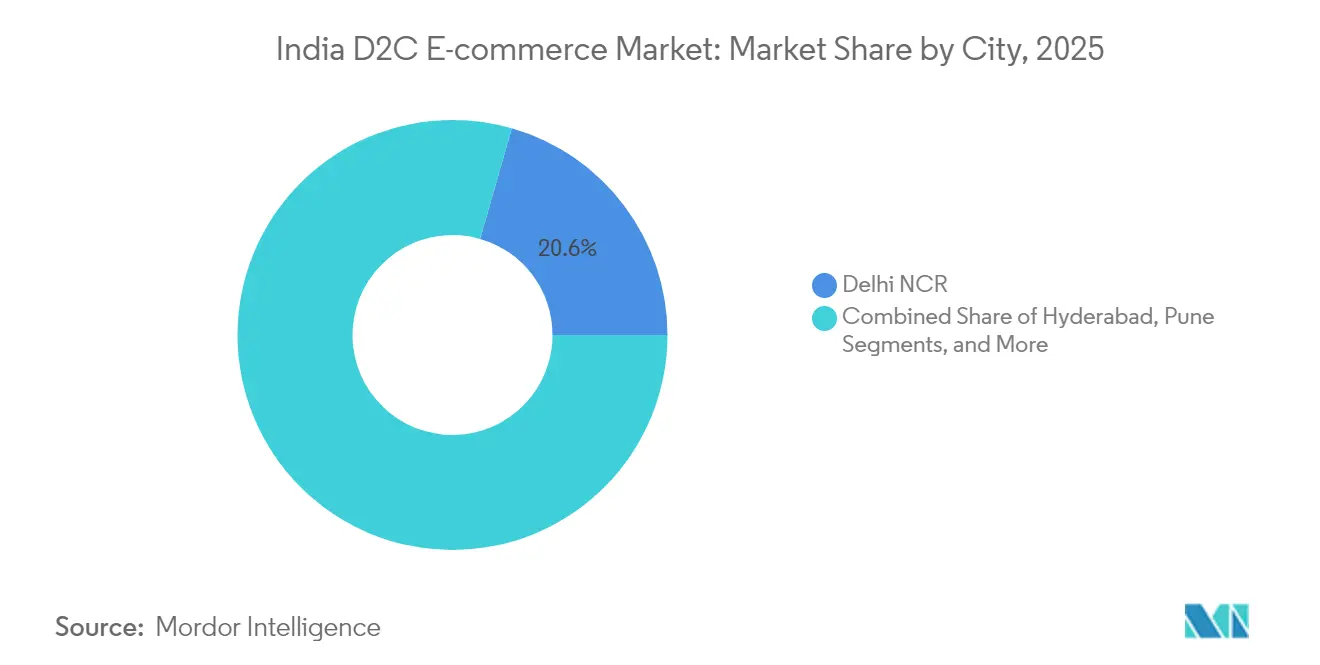
- By city cluster, Delhi NCR held 20.55% share of the India D2C E-commerce market size in 2025, whereas Hyderabad is forecast to expand at a 25.10% CAGR through 2031.
Note: Market size and forecast figures in this report are generated using Mordor Intelligence’s proprietary estimation framework, updated with the latest available data and insights as of 2026.
India D2C E-commerce Market Trends and Insights
Drivers Impact Analysis*
| Driver | (~) % Impact on CAGR Forecast | Geographic Relevance | Impact Timeline |
|---|---|---|---|
| Accelerating VC/PE Funding Into D2C Brands | +4.2% | National, with concentration in Bengaluru, Mumbai, Delhi NCR | Medium term (2-4 years) |
| GST-Enabled Nationwide Logistics Efficiencies | +3.8% | National, with early gains in tier-2/3 cities | Long term (≥ 4 years) |
| Rise of ONDC and Open-API Commerce Infrastructure | +2.5% | National, pilot markets in Bengaluru, Delhi, Bhopal | Short term (≤ 2 years) |
| Tier-2/3 Smartphone Penetration Boosting Online First-Purchases | +2.8% | Tier-2/3 cities across all states | Medium term (2-4 years) |
| Social-Commerce-Led Community Group Buying Momentum | +1.8% | National, stronger in vernacular-speaking regions | Short term (≤ 2 years) |
| Gen-Z Preference for Sustainable, Native Made-in-India Labels | +1.5% | Urban centers, expanding to tier-2 cities | Long term (≥ 4 years) |
| Source: Mordor Intelligence | |||
Accelerating VC/PE funding into D2C brands
Selective capital deployment is favoring enterprises with positive contribution margins, sustained 15-20% monthly revenue growth, and proven retention economics, even though overall funding slipped to USD 757 million in 2024.[1]D2C Funding Declines to USD 757M in 2024 from USD 930M in 2023, VCCEdge, vccedge.com Large rounds now emphasize supply-chain automation, headless commerce platforms, and AI-driven personalization, positioning funded companies such as boAt to target IPOs in 2025 at USD 300-500 million valuations. Revenue-based lenders, led by Recur Club, allocated INR 150 crore (USD 18 million) during 2024 to alleviate COD-related working-capital gaps. Consolidation is accelerating, enabling well-capitalized players to absorb niche labels and widen stock-keeping units (SKUs) without commensurate marketing-spend escalation. Capital discipline thereby converts funding scarcity into a market-share opportunity for operators with efficient cost structures.
GST-enabled nationwide logistics efficiencies
Unified GST has lowered interstate transit dwell time, trimmed logistics costs by 20-25%, and enabled 2-3-day delivery to 19,000+ pin codes through third-party carriers.[2]GST Impact on Logistics Efficiency, Ministry of Finance, finmin.nic.in Centralized fulfillment now suffices for categories like apparel, reducing inventory duplication across hubs and cutting administrative overhead by up to 18%. Small D2C entrants can scale nationally without recreating regional warehousing, while established brands re-optimize network footprints to free working capital. Harmonized e-invoicing also simplifies returns reconciliation, a critical element given COD reversal volumes. Over the long term, lower distribution frictions are expected to widen the India D2C E-commerce market by pulling underserved pin codes into viable service radii.
Rise of ONDC and open-API commerce infrastructure
ONDC enables an interoperable buyer-seller discovery layer with commission ceilings near 3%, compared with 15-25% typical of incumbent marketplaces. More than 700,000 vendors have already joined, while plug-and-play seller apps from players such as Fynd integrate logistics, payments, and customer support. Early adopters report 15-20% lower acquisition costs and faster basket-build rates. The protocol levels discovery for niche labels and catalyzes participation from local manufacturers that lacked the technology stack to sell nationally. As interoperability matures, platform dependency risks recede, rebalancing the negotiating power toward brand owners and expanding consumer choice within the India D2C E-commerce market.
Tier-2/3 smartphone penetration boosting online first-purchases
Smartphone reach in tier-2/3 zones hit 78% in 2024, creating 150 million new digital consumers, 65% of whom complete a first online purchase within six months of device ownership. Orders from small towns now exceed 50% of GMV on platforms such as Meesho, validating vernacular content and price-conscious assortments. COD remains preferred by 70% of these shoppers, necessitating robust returns management and credit-risk analytics. Brands tailoring regional aesthetics, localized sizing, and value packs witness elevated repeat rates. Improved 4G coverage and Unified Payments Interface (UPI) adoption underpin digital wallet usage, gradually shifting COD volumes into prepaid modes that enhance cash-flow cycles.
Restraints Impact Analysis*
| Restraint | (~) % Impact on CAGR Forecast | Geographic Relevance | Impact Timeline |
|---|---|---|---|
| Escalating Digital Marketing CPA Inflation | -2.8% | National, more severe in competitive categories like beauty and fashion | Short term (≤ 2 years) |
| Fragmented Cold-Chain for Grocery and Perishables | -1.5% | Tier-2/3 cities, rural areas with limited infrastructure | Medium term (2-4 years) |
| Low Repeat-Purchase Rates Beyond Top 5 Metros | -1.2% | Tier-2/3 cities, smaller urban centers | Medium term (2-4 years) |
| High Working-Capital Cycle Due to Cash-on-Delivery Returns | -0.8% | National, with higher impact in price-sensitive segments | Short term (≤ 2 years) |
| Source: Mordor Intelligence | |||
Escalating digital-marketing CPA inflation
Google Ads CPC rose between 30% and 100% across categories in 2024, while Facebook CPM climbed 25–40%, lifting acquisition costs to INR 800–1,200 per new customer. Apple’s privacy policy shifts further erode attribution precision, swelling unoptimized spend. Brands with lower average-order values, such as personal care, must extend payback periods or optimize retention loops to preserve contribution margin. Heavier competition in auction-based media favors capital-rich players, compressing visibility for emerging labels. In response, operators allocate larger budgets to owned media, referral incentives, and loyalty tiers, emphasizing lifetime-value realization over top-of-funnel volume.
Fragmented cold-chain for grocery and perishables
Only 4% of fresh produce currently traverses temperature-controlled transit, against 25% benchmarks in developed economies. In tier-2/3 geographies, 15–20% of cold-storage nodes experience power downtime, elevating spoilage and brand-reputation risk. Capital expenditure of INR 15–20 million per regional cold hub is prohibitive for smaller D2C entrants seeking geographic expansion. Last-mile wastage in temperature-sensitive categories averages 8–12% versus 2–3% for ambient products, undermining margin potential. Until integrated cold-chain networks scale, grocery and gourmet D2C offerings will skew toward shelf-stable SKUs or concentrate service in metropolitan zones.
*Our forecasts treat driver/restraint impacts as directional, not additive. The impact forecasts reflect baseline growth, mix effects, and variable interactions.
Segment Analysis
By End-User Vertical: Personal Care Accelerates Past Fashion
Apparel and Footwear accounted for 25.18% of India D2C E-commerce market share in 2025, reflecting early-mover depth in catalog breadth and influencer partnerships. However, Personal Care is poised to compound at a 24.92% CAGR to 2031 as premium beauty GMV expands toward USD 3 billion on the back of AR try-ons, AI diagnostics, and 12–24 micro-collections each year. Skincare alone advances at a 14.6% trajectory, with clean-label formulations and dermat-backed claims converting skeptical first-time buyers. High lifetime value, often exceeding INR 2,000, makes Paid Social breakevens feasible despite rising CPC.
Adjacent segments mirror divergent headwinds and tailwinds. Grocery growth is tethered to cold-chain deficiencies yet feels uplift from quick-commerce models that rotate inventory within 20 minutes, a dynamic elevating demand for revenue-based financing to fund rolling stock. Home Décor benefits from the remote-work paradigm, with furniture subscriptions reducing upfront purchase inertia. Healthcare-adjacent D2C blends prescription fulfillment and teleconsults, driving adherence-based revenue stability. Jewelry leverages virtual try-on engines to bridge tactile gaps inherent in online gold and gems trading, while BIS certification complexity in electronics raises entry barriers that safeguard incumbents.


By City: Hyderabad Outpaces Delhi NCR Growth
Delhi NCR captured 20.55% of India D2C E-commerce market size in 2025, underpinned by INR 8.5 lakh average household income and 85% digital shopping penetration. Same-day coverage on six of ten pin codes undergirds premium-segment fulfilment, but heightened advertising competition inflates CAC up to 50% above other metros. Hyderabad, by contrast, enjoys 25.10% annual growth, aided by lower warehouse rents, proximity to the South’s manufacturing belt, and strategic governmental incentives. Bengaluru’s tech ecosystem maintains leadership in AI-driven personalization, though real-estate burdens compress margin for inventory-heavy segments.
Second-tier urban clusters, Pune, Chandigarh, Coimbatore, and Indore, benefit from tier-2 smartphone momentum and ONDC’s low-cost rails. COD remains dominant at 70%, necessitating advanced returns forecasting and fraud-mitigation algorithms. Brands customizing regional catalogues and vernacular support observe elevated repeat ratios. The geographic spread underscores the imperative for elastic fulfillment models capable of scaling nationwide without inflating fixed cost bases, reinforcing the long-run appeal of the India D2C E-commerce market.
Geography Analysis
Delhi NCR’s same-day promise covers 60% of addresses and underpins luxury consumption patterns, translating to ticket sizes 22% higher than the national average. Nonetheless, retention economics rely on precision segmentation that nudges one-month reorder windows rather than acquisition revolutions. Mumbai’s affluent catchment fuels discretionary outlays in jewelry and high-end Personal Care, where authenticity badges and limited editions justify gross margins north of 60%. Bengaluru, housing India’s densest tech talent pool, exhibits the highest penetration of AI-powered shopping journeys, though SKU proliferation strains warehousing footprints.
Hyderabad’s composite of industrial policy, maturing IT workforce, and lower overheads delivers the fastest compounded growth, making it a launch pad for South-bound expansion. Chennai and Kolkata, while smaller in overall GMV, illustrate cultural resonance with regional language merchandising and festival-linked micro-collections. Significantly, tier-2/3 conurbations, collectively termed “Other Cities”, represent the next big frontier: 150 million newly banked mobile users, 70% COD reliance, and elevated time spent on short-video platforms create fertile terrain for live commerce and community buying. ONDC’s zero-gatekeeper model further unlocks logistics reach for indigenous labels, compressing go-to-market durations.
Competitive Landscape
More than 15,000 active brands define a fractured landscape; yet liquidity tightening is accelerating roll-ups and opportunistic mergers. Category concentration diverges: Personal Care remains atomized with sub-1% shares for most operators, whereas electronics and jewelry trend toward oligopolistic clusters due to certification hurdles and capital intensity. Three strategic playbooks characterize the field. Venture-backed scale-chasers burn marketing outlays to seize mind-share, but face scrutiny on contribution margin sustainability. Bootstrapped craftspeople lean into authenticity, sustaining profitability through micro-cultures and organic word-of-mouth. Hybrid models tap revenue-based debt to smoothing inventory cycles while avoiding equity dilution.
Technology sophistication constitutes the principal moat. Leaders deploy machine-learning engines for bundle recommendations, automated returns grading, and dynamic pricing calibrated to competitor feeds. Mid-tail players still juggle spreadsheets, manifesting stock-outs and shipping delays that erode Net Promoter Scores (NPS). Geographic whitespace at the tier-2/3 frontier invites regional newcomers adept in vernacular interfaces. ONDC’s leveling effect heightens pressure on legacy marketplaces, enabling smaller labels to reach nationwide demand without onerous listing fees. In sum, advantage migrates toward operators uniting capital discipline, tech agility, and compliance infrastructure.
India D2C E-commerce Industry Leaders
Wakefit Innovations Private Limited
Honasa Consumer Limited (Mamaearth)
Imagine Marketing Limited (boAt Lifestyle)
Delightful Gourmet Private Limited (Licious)
InnoVision Jewellery India Private Limited (Melorra)
- *Disclaimer: Major Players sorted in no particular order


Recent Industry Developments
- January 2025: boAt Lifestyle filed draft papers for an IPO targeting a USD 300–500 million valuation, signaling public-market appetite for D2C electronics brands.
- December 2024: Licious secured USD 25 million in Series G financing, lifting aggregate funding above USD 200 million, and announced plans for 500 offline stores to diversify beyond online meat delivery.
- November 2024: Nykaa posted Q3 FY25 PAT growth of 51% year over year to INR 26 crore, driven by beauty-segment upgrades and a 10-minute delivery pilot in Mumbai.
- October 2024: ONDC reported onboarding 700,000+ vendors, while Fynd’s seller app introduced a 3% commission structure.


India D2C E-commerce Market Report Scope
The market study includes the evolving customer journey across various online D2C models, key drivers influencing growth, challenges, and major technologies that will drive innovation in the Indian D2C e-commerce market. The market tracks the revenues accrued by companies selling directly to the customers through their own website or app without the intervention of any other third party.
The Indian D2C e-commerce market is segmented by end-user vertical. By end-user vertical, the market is segmented by apparel and footwear, grocery and gourmet, personal care, home décor and household supplies, healthcare, and jewelry. The market sizes and forecasts are provided in terms of value (USD) for all the above segments.
| Apparel and Footwear |
| Grocery and Gourmet |
| Personal Care |
| Home Décor and Household Supplies |
| Healthcare |
| Jewelry |
| Delhi NCR |
| Mumbai Metropolitan Region |
| Bengaluru |
| Hyderabad |
| Chennai |
| Kolkata |
| Pune |
| Other Cities |
| By End-User Vertical | Apparel and Footwear |
| Grocery and Gourmet | |
| Personal Care | |
| Home Décor and Household Supplies | |
| Healthcare | |
| Jewelry | |
| By City | Delhi NCR |
| Mumbai Metropolitan Region | |
| Bengaluru | |
| Hyderabad | |
| Chennai | |
| Kolkata | |
| Pune | |
| Other Cities |


Key Questions Answered in the Report
What is the forecast value of India’s D2C e-commerce by 2031?
It is projected to reach USD 322.1 billion, reflecting a 24.30% CAGR over 2026-2031.
Which segment is growing fastest within direct-to-consumer online retail?
Personal Care leads with a projected 24.92% CAGR, buoyed by premium beauty demand and AR-based shopping tools.
Why is Hyderabad emerging as a D2C hot spot?
Lower operating costs, supportive start-up policies, and proximity to South India markets drive a city-level CAGR of 25.10% through 2031.
How does ONDC benefit smaller brands?
The open network caps commissions near 3% and offers plug-and-play logistics and payments, cutting acquisition costs by up to 20%.
What challenges are limiting grocery D2C expansion?
Fragmented cold-chain logistics and high last-mile wastage rates (8–12%) restrict scale outside metro areas.
Page last updated on:


