Market Overview
| Study Period | 2020 - 2031 |
|---|---|
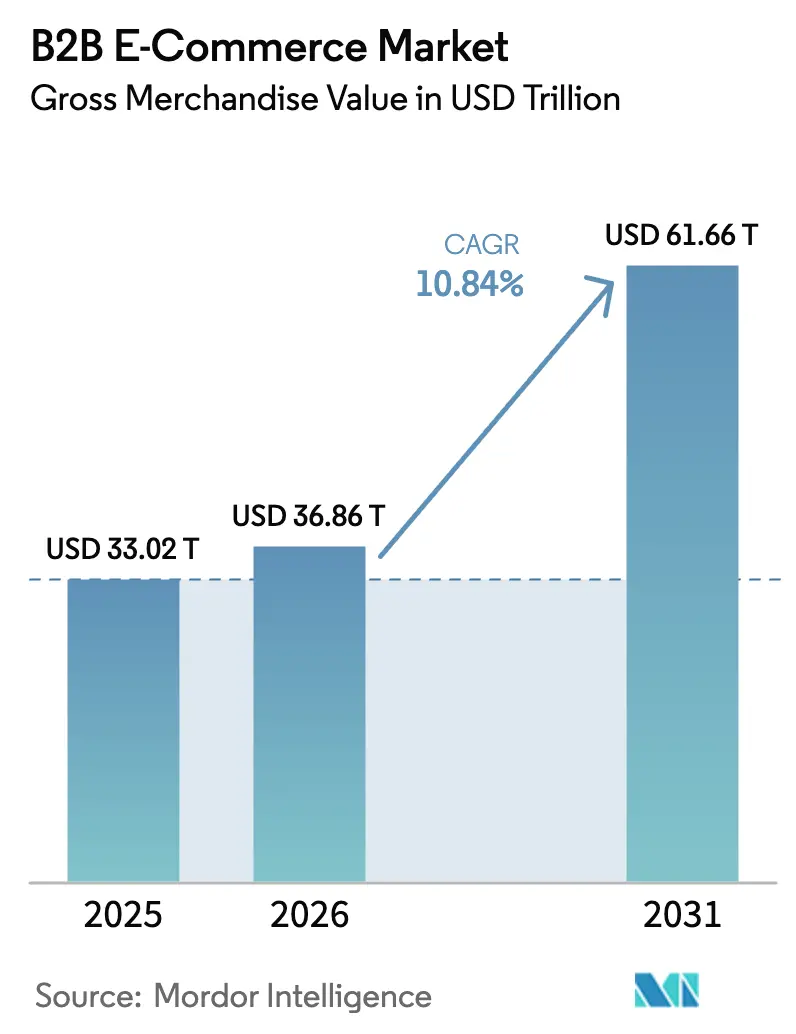
| Market Size (2026) | USD 36.86 Trillion |
| Market Size (2031) | USD 61.66 Trillion |
| Growth Rate (2026 - 2031) | 10.84% CAGR |
| Fastest Growing Market | North America |
| Largest Market | Asia |
| Market Concentration | Medium |
Major Players *Disclaimer: Major Players sorted in no particular order Image © Mordor Intelligence. Reuse requires attribution under CC BY 4.0. | |
B2B E-Commerce Market Analysis by Mordor Intelligence
The B2B e-commerce market size in terms of gross merchandise value is expected to increase from USD 33.02 trillion in 2025 to USD 36.86 trillion in 2026 and reach USD 61.66 trillion by 2031, growing at a CAGR of 10.84% over 2026-2031. Demand is pivoting toward API-first integrations that expose real-time inventory and pricing data, while generative AI compresses quoting and contracting cycles for distributors. Marketplaces continue to outpace direct sales because buyers value supplier diversity and transparent pricing. In 2025, cross-border volumes represented 44.32% of transactions, but domestic flows are scaling faster as nearshoring and regional fulfillment shrink lead times. Alternative payment rails, including virtual cards and buy-now-pay-later, are eroding the dominance of bank transfers by embedding dynamic spending controls inside procurement workflows.
Key Report Takeaways
- By channel, marketplace purchasing accounted for 65.12% of the B2B e-commerce market share in 2025 and is projected to expand at a 13.87% CAGR through 2031.
- By transaction model, cross-border trade accounted for 44.32% of 2025 volume while domestic flows are set to grow at a 12.23% CAGR through 2031.
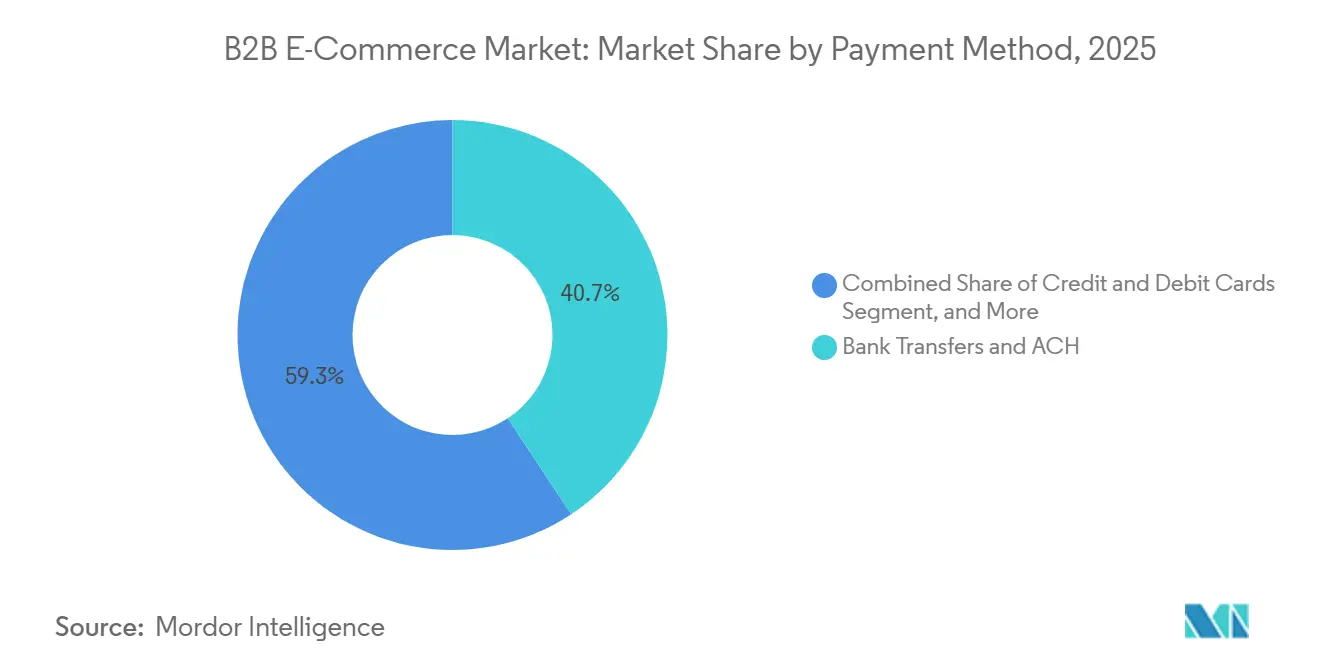
- By payment method, bank transfers and ACH commanded a 40.68% share in 2025, whereas alternative instruments are forecast to register a 14.12% CAGR to 2031.
- By industry vertical, manufacturing captured 24.67% of 2025 revenue, and healthcare and life sciences are poised to advance at an 11.68% CAGR through 2031.
- By geography, Asia-Pacific accounted for 69.23% of 2025 revenue, and North America is projected to grow at a 12.09% CAGR through 2031.
Note: Market size and forecast figures in this report are generated using Mordor Intelligence’s proprietary estimation framework, updated with the latest available data and insights as of January 2026.
Global B2B E-Commerce Market Trends and Insights
Drivers Impact Analysis*
| Driver | (~) % Impact on CAGR Forecast | Geographic Relevance | Impact Timeline |
|---|---|---|---|
| AI-powered procurement platforms | +2.1% | Global, early uptake in North America and Europe | Medium term (2-4 years) |
| Manufacturing SMEs in Asia digitizing cross-border sourcing | +1.8% | Asia-Pacific core, spillover to Middle East and Africa | Short term (≤ 2 years) |
| Virtual cards and BNPL penetration easing high-value checkout | +1.5% | Europe and North America | Medium term (2-4 years) |
| API-first integration replacing EDI | +1.9% | Global, led by North America and Europe | Long term (≥ 4 years) |
| Sustainability-driven supplier selection | +1.3% | Europe, North America, select Asia-Pacific markets | Long term (≥ 4 years) |
| Generative-AI quote automation | +1.6% | Global, concentrated in manufacturing hubs | Medium term (2-4 years) |
| Source: Mordor Intelligence | |||
AI-Powered Procurement Platforms Accelerate Self-Service Buying
Machine-learning engines embedded in procurement suites now predict demand, recommend suppliers, and auto-approve low-risk purchases. SAP Ariba rolled out a generative AI assistant in 2025 that studies historical spend to surface renegotiation opportunities, trimming cycle times by 30%.[1]SAP SE, “Ariba Procurement Solutions Overview,” SAP, sap.com Coupa automated invoice matching the same year, cutting accounts-payable workloads nearly in half. Zip channeled new capital into an AI intake module that routes requisitions to pre-approved vendors, while IBM’s natural-language requisition engine converts unstructured requests into RFQs in hours. These capabilities are most pronounced in tail-spend categories where speed outweighs negotiation depth, reinforcing the shift toward buyer autonomy.
Manufacturing SMEs in Asia Digitize Cross-Border Sourcing via Marketplaces
Policy incentives across Asia-Pacific are funneling small manufacturers onto digital platforms. Singapore’s SME Go Digital program subsidizes 70% of onboarding costs, fueling a 52% surge in cross-border listings.[2]Infocomm Media Development Authority, “SME Go Digital,” imda.gov.sg India’s Open Network for Digital Commerce linked 200,000 suppliers to overseas buyers by 2025 through a unified API layer.[3]Open Network for Digital Commerce, “ONDC Platform Details,” ondc.org China’s pilot zones grant tax rebates and simplified export paperwork, lifting B2B volumes by 38%. Vietnam’s trade ministry partnered with Alibaba to train 50,000 exporters on catalog management. These efforts narrow information gaps and let small firms compete on lead time and specifications rather than brand heft.
Virtual Cards and BNPL Simplify High-Value Checkout
Virtual cards assign single-use numbers, reducing fraud and automating reconciliation. J.P. Morgan processed more than USD 50 billion in virtual-card volume in 2025. Visa added a B2B BNPL option underwriting up to USD 500,000 per order, with instant approval on most applications. Brex blends immediate supplier settlement with 30-day buyer terms, easing cash-flow constraints. Bank of America’s multi-currency virtual card locks exchange rates at order placement, eliminating FX volatility. These tools divert payments away from ACH, accelerating settlement and strengthening working-capital control.
API-First Integration Unlocks Real-Time Visibility
RESTful and GraphQL APIs now sync inventory, pricing, and order data across trading partners in seconds. Oracle Commerce Cloud lets buyers query availability and negotiate rates dynamically, shrinking quote-to-order latency from days to minutes. Shopify’s webhook framework pushes warehouse scans directly into buyer ERPs, eliminating stockouts. Crstl translates legacy EDI traffic into JSON, modernizing data exchange. IBM added a real-time pricing engine that adjusts contract rates to commodity spot indices. The shift is most valuable in categories with volatile input costs where intraday price alignment protects margins for buyers and sellers alike.
Restraints Impact Analysis*
| Restraint | (~) % Impact on CAGR Forecast | Geographic Relevance | Impact Timeline |
|---|---|---|---|
| Escalating marketplace compliance costs for hazardous goods sellers | -1.2% | Global, acute in North America and Europe | Short term (≤ 2 years) |
| Rising cross-border data residency restrictions | -1.4% | Europe, China, India, spillover to ASEAN | Medium term (2-4 years) |
| Surge in B2B payment fraud and chargeback risk | -0.9% | Global, concentrated in cross-border trade | Short term (≤ 2 years) |
| Limited SKU data standardization | -1.1% | Global, fragmented in Asia-Pacific and South America | Long term (≥ 4 years) |
| Source: Mordor Intelligence | |||
Escalating Marketplace Compliance Costs for Hazardous Goods Sellers
Regulations covering hazardous chemicals now impose registration fees, audit requirements, and civil penalties that smaller distributors struggle to absorb. IATA’s Dangerous Goods Rules expose U.S. violators to fines up to USD 500,000 per shipment. OSHA mandates updated safety data sheets within 90 days of new hazard findings, costing mid-sized firms USD 50,000-100,000 annually.[4]Occupational Safety and Health Administration, “Hazard Communication Standard,” osha.gov Europe’s REACH regime charges as much as EUR 34,000 (USD 37,400) per substance, forcing catalog rationalization. Marketplaces pass legal risk through higher fees, evidenced by Amazon Business lifting hazmat seller rates 25% in 2025. The upshot is consolidation toward distributors with dedicated regulatory teams.
Rising Cross-Border Data Residency Restrictions
Data-localization laws mandate in-country hosting and security reviews, fragmenting global infrastructure and inflating costs. China’s Personal Information Protection Law requires mainland storage and protracted transfer approvals. India’s forthcoming Digital Personal Data Protection Act will impose similar constraints. The EU’s draft Data Act proposes limiting industrial data flows to jurisdictions with adequate safeguards. Platforms are building parallel clouds, hiring regional compliance experts, and duplicating DevOps pipelines, which OECD estimates raise operating expenses 15%-20%. These obligations slow innovation and erode economies of scale for global marketplaces.
*Our forecasts treat driver/restraint impacts as directional, not additive. The impact forecasts reflect baseline growth, mix effects, and variable interactions.
Segment Analysis
By Channel: Marketplace Sales Extend Lead Through Supplier Aggregation
Marketplace purchasing retained 65.12% B2B e-commerce market share in 2025 as multi-vendor comparison and transparent pricing eclipsed single-supplier contracts. Vertical-specialist platforms like Thomasnet audit manufacturing capability on-site, attracting aerospace buyers that demand ITAR compliance. Alibaba’s 1688.com introduced natural-language supplier matching in 2025, shortening sourcing cycles by one-third. Amazon Business expanded to 185 countries, embedding localized payments and automated customs filing that cut average delivery time to 5 days. Direct channels still serve high-spec segments such as pharmaceuticals, where buyers need customized formulations and long-term service agreements, but hybrid models are emerging. W.W. Grainger’s Zoro combines marketplace listings with direct fulfillment, delivering volume discounts and dedicated account managers to corporate accounts.
Marketplaces widen their lead by incorporating embedded finance and logistics. DHgate protects first-time cross-border buyers by holding funds in escrow until inspection, mitigating quality risk. Walmart Business layered third-party integrations onto its proprietary portal, permitting buyers to tap 100,000 external SKUs while retaining consolidated invoicing. As these features mature, the B2B e-commerce market continues to favor platforms that centralize catalog discovery, compliance, payments, and fulfillment.


By Transaction Model: Domestic Flows Accelerate on Nearshoring
Domestic procurement volumes are expanding at a 12.23% CAGR as firms relocate production closer to end markets. Same-day fulfillment networks powered by Shopify inventory pooling deliver within 24 hours to buyers located within 200 miles, a speed that cross-border logistics cannot match. North American manufacturers raise local sourcing plans thanks to clean-energy tax credits, while Mexico records a 52% jump in U.S.-oriented transactions as nearshoring reshapes automotive supply chains. Cross-border trade continues to dominate categories with geographic production clusters, such as rare-earth minerals and advanced semiconductors. The EU-Mercosur accord that removed duties on 91% of goods sparked a 28% uptick in Europe-South America flows, indicating tariffs remain a lever for cross-border growth. Nonetheless, customs paperwork and VAT reconciliation add 5%-8% to landed cost for low-value shipments, blunting price advantages versus local sourcing.
Digital customs and trade-finance tools attempt to offset friction. Amazon and Alibaba integrate tariff classification and origin certificates into checkout, while MercadoLibre’s Envios Flex focuses on intraregional shipping to bypass lengthy ocean freight. The result is a nuanced landscape where firms split procurement between local plants for time-sensitive orders and offshore suppliers for cost-sensitive commodities.
By Payment Method: Alternative Instruments Capture Momentum
Bank transfers and ACH still processed 40.68% of the 2025 transaction value, but their share is eroding. J.P. Morgan’s virtual cards inject single-use numbers and carrying-balance controls directly into ERP workflows, accelerating reconciliation. Visa’s BNPL product underwrites six-figure invoices in real time, providing suppliers with same-day cash while buyers spread out obligations. Brex couples immediate settlement with 30-day buyer terms, appealing to high-growth SaaS enterprises that require flexible credit. Bank of America’s CashPro virtual card fixes FX rates at order placement, securing predictable margins for importers. These advantages explain the 14.12% CAGR projected for alternative payments through 2031, a trend set to redistribute fee economics from banks toward card networks and fintechs.
Industries with low margins, like commodity wholesale, still lean on bank transfers to avoid processing charges. Yet healthcare, government, and higher-education sectors are shifting to virtual cards because built-in audit trails streamline compliance reporting. As payment gateway APIs proliferate, the B2B e-commerce market embeds financing and settlement deeper into the checkout experience, making payment choice a differentiator in supplier selection.

By Industry Vertical: Healthcare Leads Growth Curve
Manufacturing accounted for the largest slice of 2025 revenue at 24.67% as factories digitized raw-material and MRO procurement for efficiency gains. The healthcare and life-sciences segment is forecast to rise at an 11.68% CAGR amid serialization mandates under the U.S. Drug Supply Chain Security Act.[5]U.S. Food and Drug Administration, “Drug Supply Chain Security Act,” fda.gov McKesson, Cardinal Health, and AmerisourceBergen collectively committed more than USD 2 billion to blockchain track-and-trace infrastructure, enhancing authenticity verification throughout distribution. Automotive parts are shifting online as repair shops access instant stock information through platforms like AutoZone’s repair-shop portal, reducing vehicle downtime by 18 hours. Construction procurement benefits from Procore’s marketplace, which ties material orders to project schedules, minimizing on-site delays. Energy-sector digitization accelerates as Xometry introduces a clean-energy tooling category that supports rapid prototyping for solar and battery components.
Regulated verticals attract specialist marketplaces that pair compliance know-how with digital tools. Pharmaceutical distributors integrate cold-chain monitoring, while hazardous-chemical portals bundle SDS documentation and transport labeling. These tailored features drive higher adoption rates than one-size-fits-all platforms in complex industries.
Geography Analysis
Asia-Pacific produced 69.23% of global B2B e-commerce revenue in 2025, underpinned by China’s USD 2.1 trillion export engine where B2B transactions formed 78% of sales. India’s market advanced 34% after ONDC unified payments, logistics, and customs APIs for SMEs. Singapore processed more than 20 million electronic declarations through TradeNet, compressing clearance from two days to six hours. Southeast Asian growth is reinforced by mobile-first platforms that integrate local wallets and regional courier networks. Japan and South Korea lag due to entrenched keiretsu and chaebol chains that still prefer negotiated contracts and faxed purchase orders.
North America is the fastest-growing region, tracking a 12.09% CAGR to 2031 as enterprises adopt cloud-native platforms embedded within ERP suites. Amazon Business signed 41% more enterprise accounts in 2025 after extending multi-channel fulfillment, and the Inflation Reduction Act credits spurred a 27% jump in domestic orders for clean-energy components. Canada’s Digital Adoption Program subsidized subscription costs, driving a 19% rise in online procurement among mid-sized manufacturers. Nearshoring lifted Mexico-U.S. trade by over half as companies migrated electronics and auto assembly closer to buyers.
Europe sustains moderate expansion shaped by privacy and sustainability policies. Germany’s Mercateo layers carbon-footprint calculators on product pages to help buyers satisfy Corporate Sustainability Reporting Directive rules. Post-Brexit customs frictions in the United Kingdom abated once platforms automated VAT and origin documentation. The Middle East and Africa are building digital trade corridors; Dubai’s blockchain-based TradeConnect reduced import processing times by 60%, while South Africa’s Masterpass QR allowed 15,000 merchants to accept mobile B2B payments. South America sees concentration in Brazil, Argentina, and Chile, where MercadoLibre processed USD 8 billion in 2025, leveraging same-day delivery in urban centers.


Competitive Landscape
The B2B e-commerce market is moderately fragmented. In Asia-Pacific, Alibaba’s 1688.com and Made-in-China.com exceed a 50% combined share, but no platform tops 15% in North America or Europe. Competitive focus centers on value-added services rather than price. Amazon Business anchors loyalty by letting sellers borrow its logistics infrastructure, attracting over 6 million business customers worldwide. Shopify’s webhook-driven architecture synchronizes inventory with ERP systems, embedding the storefront into buyer workflows.
Vertical specialists exploit regulatory complexity to defend niches. Xometry offers ISO 13485 and AS9100 suppliers for aerospace and medical device buyers, while Thomasnet certifies industrial vendors through on-site audits to meet defense-grade requirements. Hazardous-chemical marketplaces emphasize compliance management, and healthcare portals bundle serialization and cold-chain tracking. Generative-AI tools lower client-acquisition costs by automating quote generation and contract drafting. SAP Ariba’s spend-analysis assistant delivered an average 8% savings for early adopters by flagging renegotiation opportunities.
Strategic investments flow into fulfillment and embedded finance. MercadoLibre’s Envios Flex slashed shipping costs 30% in South America, while Visa’s BNPL pilot processed USD 2 billion in its first half-year, signaling rising competition between card networks and banks. Smaller players build niche authority through open APIs that plug into SAP, Oracle, or Microsoft Dynamics, reducing switching friction for enterprise users.
B2B E-Commerce Industry Leaders
Alibaba Group Holding Ltd.
Amazon.com Inc. (Amazon Business)
IndiaMART InterMESH Ltd.
eBay Inc.
Global Sources Ltd.
- *Disclaimer: Major Players sorted in no particular order

Recent Industry Developments
- January 2026: Amazon Business expanded multi-channel fulfillment to 15 more countries, cut industrial-consumer delivery windows to 48 hours, and added 50,000 enterprise accounts.
- December 2025: Alibaba’s 1688.com launched an AI supplier-verification engine that audited 2 million profiles, trimming due diligence time by 40%.
- November 2025: Shopify enabled webhook-based inventory sync for its B2B suite, with 10,000 enterprises adopting within 60 days.
- October 2025: MercadoLibre rolled out Envios Flex across Argentina, Chile, and Colombia, reducing shipping costs 30% and boosting intra-South American trade 22%.


Research Methodology Framework and Report Scope
Market Definitions and Key Coverage
Our study defines the global B2B e-commerce market as the gross merchandise value of goods and services exchanged online from one registered business entity to another, covering direct webstores, electronic data interchange portals, and third-party marketplaces. Transactions initiated online but settled offline stay inside scope.
Scope exclusion: consumer-to-business flows, last-mile logistics, and standalone payment processor fees are outside this valuation.
Segmentation Overview
- By Channel
- Direct Sales
- Marketplace Sales
- By Transaction Model
- Domestic
- Cross-Border
- By Payment Method
- Bank Transfers and ACH
- Credit and Debit Cards
- Other Payment Methods
- By Industry Vertical
- Manufacturing
- Retail and Wholesale
- Healthcare and Life Sciences
- Automotive
- Construction and Building Materials
- Other Industry Verticals
- By Geography
- North America
- United States
- Canada
- Mexico
- Europe
- Germany
- United Kingdom
- France
- Italy
- Spain
- Rest of Europe
- Asia-Pacific
- China
- Japan
- South Korea
- India
- Southeast Asia (Singapore, Indonesia, Thailand, Vietnam, Philippines)
- Rest of Asia-Pacific
- South America
- Brazil
- Argentina
- Chile
- Rest of South America
- Middle East
- United Arab Emirates
- Saudi Arabia
- Turkey
- Rest of Middle East
- Africa
- South Africa
- Nigeria
- Kenya
- Rest of Africa
- North America
Detailed Research Methodology and Data Validation
Primary Research
Mordor analysts interviewed procurement heads at manufacturers, wholesalers, and marketplace operators across North America, Asia, and Europe, then surveyed fintechs and SaaS enablers. These conversations validated average selling prices, cross-border shares, and adoption drivers that secondary data alone cannot capture.
Desk Research
We began with open statistics from UNCTAD, the International Trade Administration, Eurostat, the U.S. Census Bureau's Quarterly E-commerce Survey, and China's Ministry of Commerce, which frame baseline transaction volumes. Trade journals, public 10-Ks, investor decks, and association white papers refined digital share estimates. Paid assets such as D&B Hoovers and Dow Jones Factiva supplied seller revenue splits and news on platform launches. Together, they provide historical series that anchor our model. The sources named are illustrative, not exhaustive.
Market-Sizing & Forecasting
A top-down reconstruction starts from national e-commerce and wholesale datasets, adjusted for B2B-only shares and blended ASP trends, then cross-checked through selective bottom-up seller roll-ups in six major industries. Key inputs include enterprise internet penetration, EDI replacement rates, procurement digitization budgets, average basket size, and marketplace share. A multivariate regression projects values to 2030, while scenario analysis guards against macro shocks; gaps in granular data are bridged with conservative interpolation endorsed by experts.
Data Validation & Update Cycle
Outputs face anomaly checks, peer reviews, and senior sign-off. Reports refresh annually, with mid-cycle updates when events such as regulatory shifts, major platform launches, or sharp currency moves materially alter baselines.
Why Mordor's B2B E-Commerce Baseline Commands Reliability
Published estimates often diverge because firms select different transaction scopes, currencies, and refresh cadences.
Key gap drivers include whether marketplace GMV is counted in full, how wholesale transfer pricing is normalized, and if cross-border flows are converted at spot or PPP rates. Some studies extrapolate one region globally or blend B2C with B2B, inflating totals.
Benchmark comparison
| Market Size | Anonymized source | Primary gap driver |
|---|---|---|
| USD 32.8 T (2025) | Mordor Intelligence | |
| USD 18.7 T (2023) | Global Consultancy A | Excludes marketplace GMV, relies on single-country sample |
| USD 32.1 T (2025) | Global Consultancy B | Merges domestic and cross-border totals without currency harmonization |
These contrasts show that Mordor Intelligence's deliberate scope choices, annual refresh, and dual-path validation deliver a balanced, transparent baseline decision makers can trust.


Key Questions Answered in the Report
How large will global B2B e-commerce purchasing become by 2031?
Forecasts indicate the B2B e-commerce market size will reach USD 61.66 trillion by 2031, expanding at a 10.84% CAGR.
Which sales channel is growing fastest for corporate buyers?
Marketplace purchasing is projected to grow at a 13.87% CAGR as buyers favor supplier diversity and transparent pricing.
Why are domestic transactions rising faster than cross-border trade?
Nearshoring, regional fulfillment networks, and tariff incentives shrink lead times and drive a 12.23% CAGR for domestic flows.
Which payment tools are displacing bank transfers?
Virtual cards, buy-now-pay-later, and embedded-finance options are forecast to expand at a 14.12% CAGR through 2031.
What makes healthcare the top growth vertical?
Serialization mandates and blockchain track-and-trace requirements push healthcare and life sciences toward an 11.68% CAGR.
How do data-localization laws affect global platforms?
Residency mandates force region-specific infrastructure, lifting operating costs 15%-20% and complicating cross-border scaling.
Page last updated on:


