B2B Payments Market Size and Share
Market Overview
| Study Period | 2020 - 2031 |
|---|---|
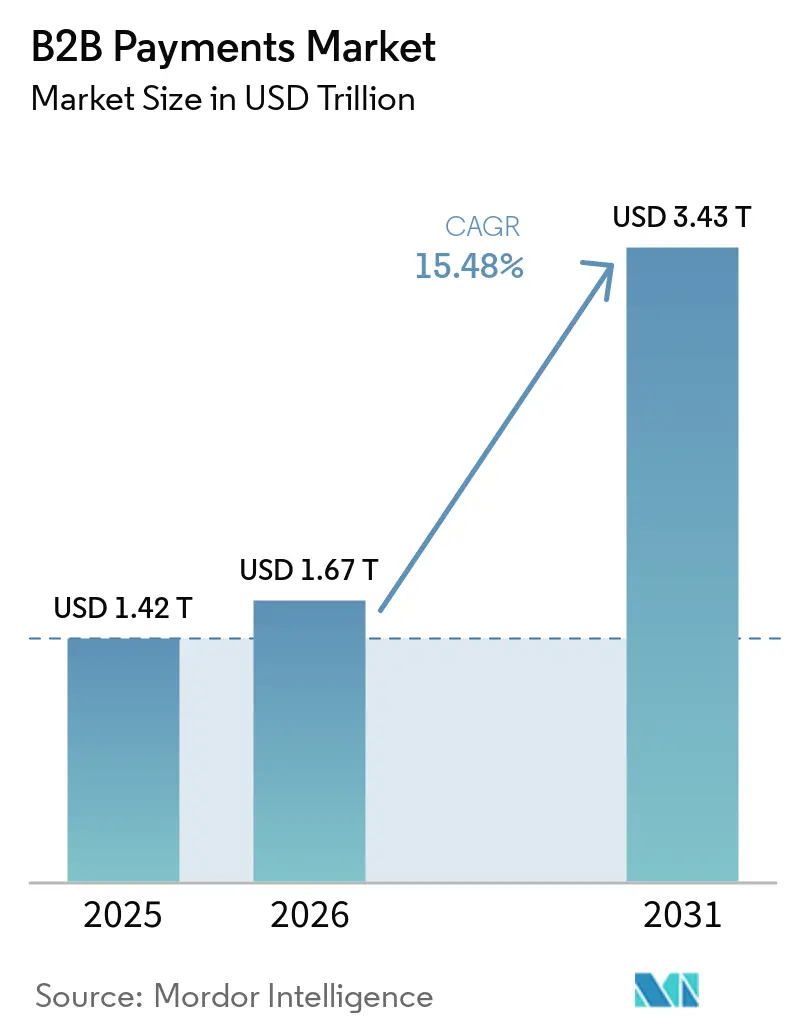
| Market Size (2026) | USD 1.67 Trillion |
| Market Size (2031) | USD 3.43 Trillion |
| Growth Rate (2026 - 2031) | 15.48% CAGR |
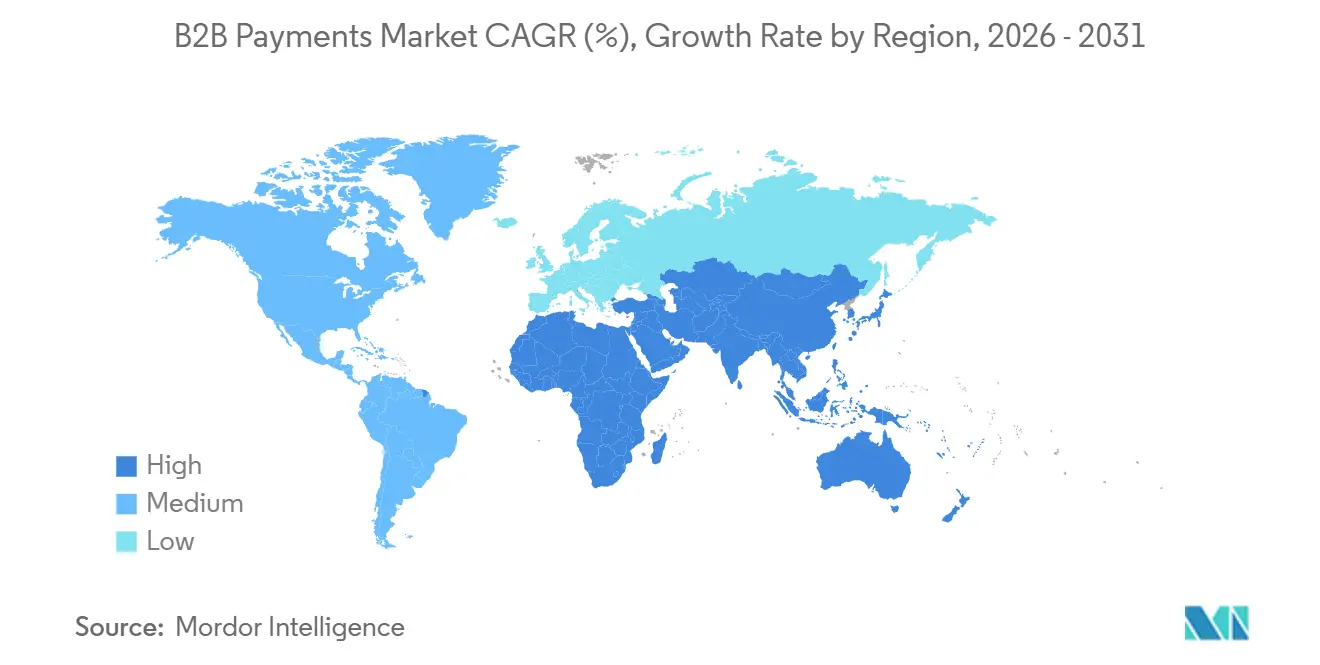
| Fastest Growing Market | Asia Pacific |
| Largest Market | North America |
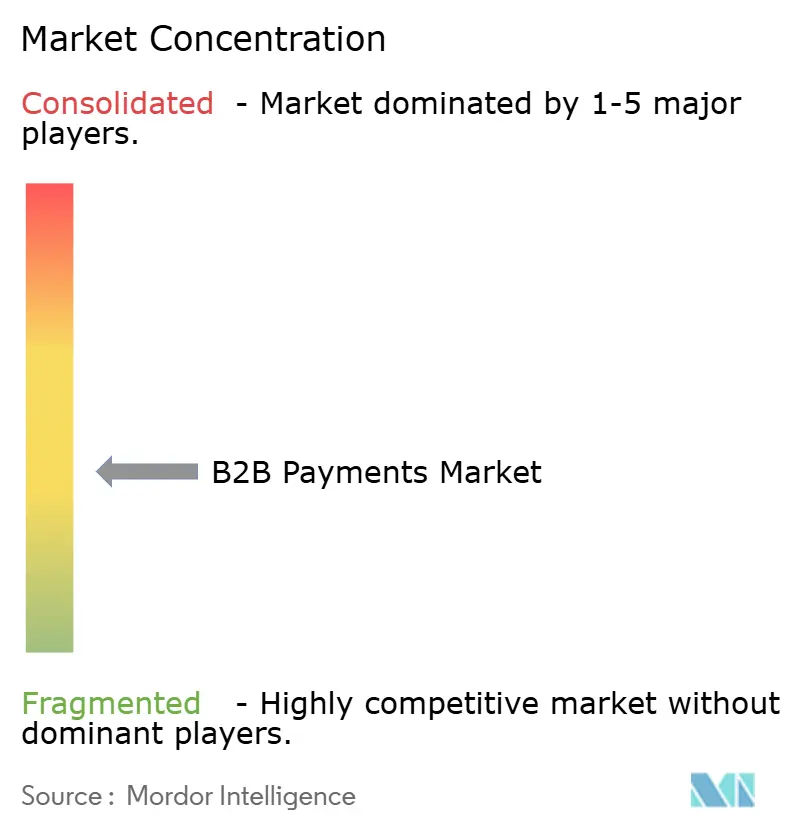
| Market Concentration | Medium |
Major Players *Disclaimer: Major Players sorted in no particular order Image © Mordor Intelligence. Reuse requires attribution under CC BY 4.0. | |
B2B Payments Market Analysis by Mordor Intelligence
The B2B payments market size is expected to grow from USD 1.42 trillion in 2025 to USD 1.67 trillion in 2026 and is forecast to reach USD 3.43 trillion by 2031 at a 15.48% CAGR over 2026-2031. Rapid substitution of paper invoices and batch wires with real-time rails is compressing settlement cycles and unlocking early-payment discounts. Corporate treasurers increasingly treat payment choice as a working-capital lever, steering spend to virtual cards that extend payables, earn rebates, and provide line-item data. Regulatory mandates for structured e-invoices in Europe and real-time tax reporting worldwide are forcing enterprises to overhaul legacy accounts-payable workflows. Competition is intensifying as card networks, banks, and fintech platforms converge on embedded-finance models that monetize payment initiation rather than transaction processing.
Key Report Takeaways
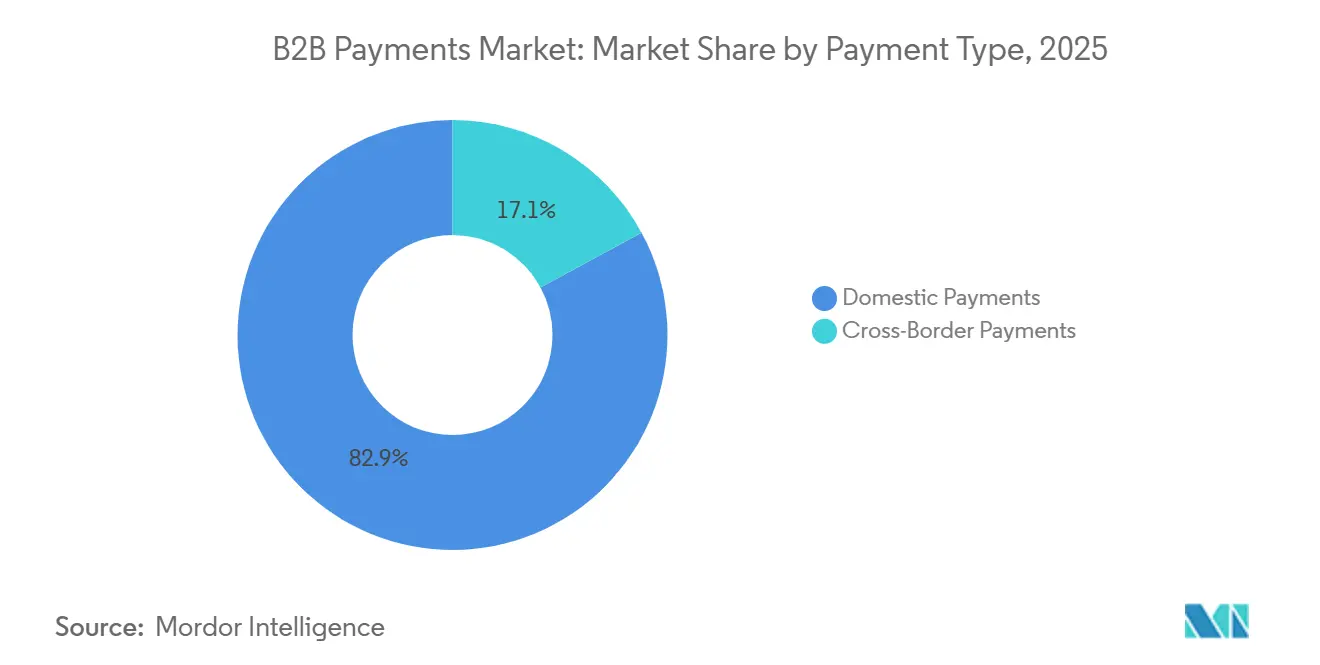
- By payment type, domestic payments led with 82.89% of the B2B payments market share in 2025; cross-border flows are expanding at a 16.52% CAGR through 2031.
- By payment mode, traditional payment modes accounted for 64.78% of the B2B payments market size in 2025, while digital rails are advancing at a 17.31% CAGR to 2031.
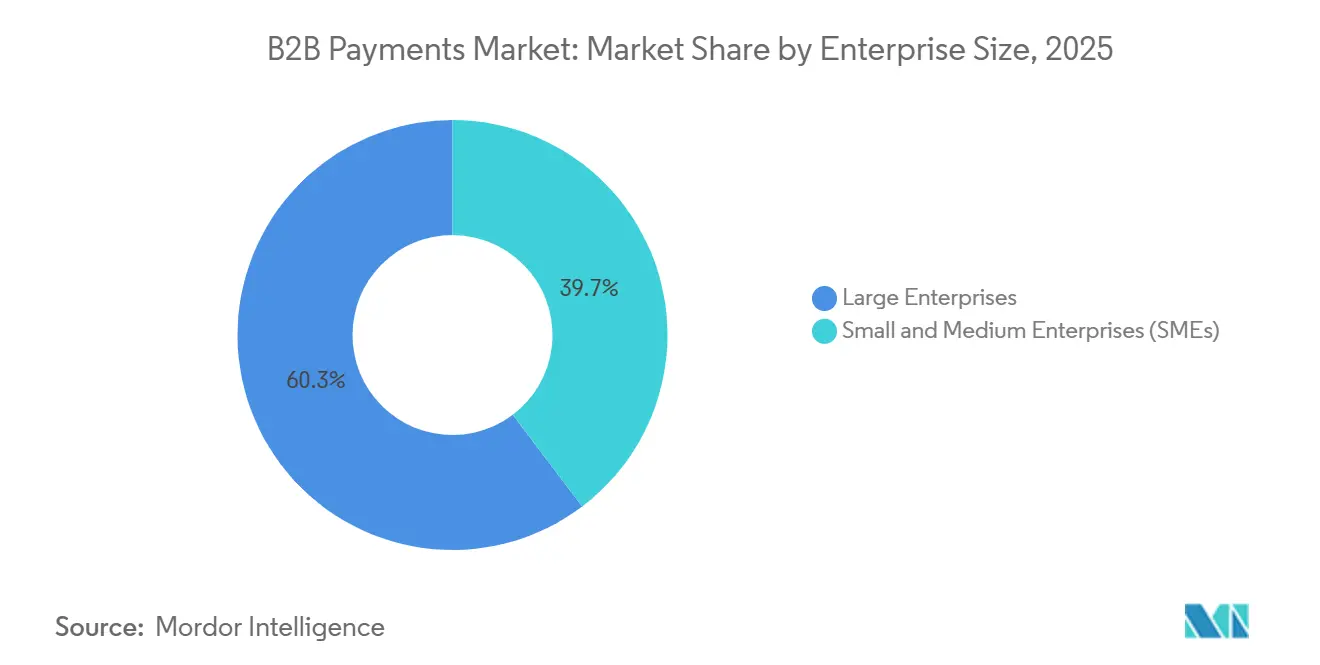
- By enterprise size, large enterprises held 60.31% of the revenue share in 2025, whereas small and medium enterprises are projected to grow at a 16.23% CAGR, narrowing the technology gap.
- By end-user vertical, banking, financial services, and insurance generated 25.18% of market demand in 2025 thanks to high-value interbank transfers and stringent audit requirements. healthcare, professional services, and education are the fastest-expanding verticals at an 18.02% CAGR to 2031.
- By geography, North America captured 34.27% of market value in 2025, yet Asia-Pacific is forecast to post the fastest regional CAGR at 17.42% to 2031.
Note: Market size and forecast figures in this report are generated using Mordor Intelligence’s proprietary estimation framework, updated with the latest available data and insights as of January 2026.
Global B2B Payments Market Trends and Insights
Drivers Impact Analysis*
| Driver | (~) % Impact on CAGR Forecast | Geographic Relevance | Impact Timeline |
|---|---|---|---|
| Acceleration of Real-Time Payment Infrastructure Adoption | +3.2% | Global, with concentrated gains in Asia-Pacific, Europe, and North America | Medium term (2-4 years) |
| Surge in B2B Marketplace Platforms Demanding Embedded Payment Capabilities | +2.8% | Global, led by North America and Europe | Short term (≤ 2 years) |
| Regulatory Push Toward Digital Invoicing and e-VAT in Europe | +2.4% | Europe core, spillover to South America and Middle East | Medium term (2-4 years) |
| Working-Capital Optimization Initiatives Driving Corporate and Virtual Card Uptake | +2.1% | North America and Europe, emerging in Asia-Pacific | Short term (≤ 2 years) |
| Tokenized Deposits and Regulated Stablecoins Enabling 24/7 Treasury Settlement | +1.6% | North America and Asia-Pacific pilots | Long term (≥ 4 years) |
| GenAI-Powered Autonomous Payables and Receivables Agents Lowering Back-Office Costs | +1.4% | Global, early adoption by large enterprises | Medium term (2-4 years) |
| Source: Mordor Intelligence | |||
Acceleration Of Real-Time Payment Infrastructure Adoption
Central banks deployed instant-settlement rails at record speed between 2023 and 2025, resetting expectations around payment finality. The United States Federal Reserve’s FedNow Service exceeded 900 participating institutions by late 2025.[1]Federal Reserve, “FedNow Service,” frbservices.org Europe’s SEPA Instant scheme handled 14.5 billion transactions in 2024, up 54% year on year. India’s Unified Payments Interface processed 13.4 billion monthly transactions by December 2025. These rails compress working-capital cycles, enabling suppliers to receive funds within seconds and buyers to capture early-payment discounts. Payment providers embedding real-time rails into accounts-payable software are positioning as strategic treasury partners rather than commoditized processors.
Surge In B2B Marketplace Platforms Demanding Embedded Payment Capabilities
Vertical software platforms now treat payment facilitation as a core revenue stream. Stripe disclosed that software vendors using its embedded-finance stack processed USD 1 trillion in volume during 2025, with B2B marketplaces the fastest-growing cohort.[2]Stripe, “Stripe Investor Relations,” stripe.com Freight exchanges, construction portals, and wholesale distribution networks offer escrow, split disbursements, and dynamic discounting directly in workflow, shrinking Days Sales Outstanding for sellers and reducing manual reconciliation for buyers. Embedded finance lowers customer-acquisition costs for payment providers since merchants onboard through the platform relationship. The trend dovetails with composable commerce, where enterprises assemble best-of-breed services via APIs rather than deploying monolithic ERP suites.
Regulatory Push Toward Digital Invoicing And E-VAT In Europe
The European Commission’s VAT in the Digital Age package mandates structured e-invoices and real-time VAT reporting from 2028, compelling more than 10 million businesses to replace PDF invoices with machine-readable messages.[3]European Central Bank, “SEPA Instant Credit Transfer Scheme,” ecb.europa.eu Compliance demands deep integration among invoicing software, payment gateways, and tax portals, catalyzing demand for cloud platforms that bundle these capabilities. SAP plans to embed continuous transaction controls natively in S/4HANA, framing the upgrade as compliance-as-a-service. Similar mandates are live in Latin America and the Middle East, accelerating the retirement of paper invoices and creating a regulatory tailwind for the B2B payments market.
Working-Capital Optimization Initiatives Driving Corporate And Virtual Card Uptake
Treasury teams increasingly prioritize payment instruments that extend Days Payable Outstanding while preserving supplier goodwill. Visa reported 25% year-over-year growth in B2B virtual-card volume in its fiscal-2025 results.[4]Visa Inc., “Fiscal 2025 Earnings Report,” investor.visa.com Virtual cards generate single-use numbers, deliver detailed remittance data, and allow buyers to defer cash outflows by 30-45 days while earning rebate income. Acceptance friction is easing as card-acceptance-as-a-service providers fund suppliers at lower cost than factoring. Integration with spend-management suites such as Coupa and SAP Concur gives finance leaders real-time visibility into committed spend, strengthening cash-flow forecasting and foreign-exchange hedging.
Restraints Impact Analysis*
| Restraint | (~) % Impact on CAGR Forecast | Geographic Relevance | Impact Timeline |
|---|---|---|---|
| Fragmented Global Compliance (FX, AML, KYC) Slows Cross-Border Flows | -1.8% | Global, most acute in emerging-market corridors | Medium term (2-4 years) |
| Persistent Payment Fraud And Business Email Compromise Undermines Digital Trust | -1.5% | Global, higher incidence where cybersecurity maturity is low | Short term (≤ 2 years) |
| ERP Integration Complexity For Mid-Market Enterprises | -1.1% | Global mid-market | Medium term (2-4 years) |
| Interoperability Gaps Between Tokenized Money Rails And Legacy Systems | -0.9% | North America and Asia-Pacific pilots | Long term (≥ 4 years) |
| Source: Mordor Intelligence | |||
Fragmented Global Compliance Slows Cross-Border Flows
Inconsistent anti-money-laundering and know-your-customer rules oblige payment providers to maintain parallel onboarding flows, adding 24-72 hours to processing times and inflating costs. The World Bank calculated average cross-border transfer fees at 6.35% for a USD 200 remittance in 2024, with compliance overhead a major driver. Lack of a global digital-identity framework forces enterprises to resubmit documents when entering new markets. Correspondent-banking chains add further opacity, encouraging fintech challengers to build local clearing-system networks that bypass intermediaries.
Persistent Payment Fraud And Business Email Compromise Undermines Digital Trust
Business email compromise losses totaled USD 2.9 billion in 2023 and continued to climb as attackers deployed generative-AI tools to craft convincing invoice-modification requests. The Association for Financial Professionals reported that 65% of organizations encountered attempted or actual payment fraud in 2024. Instant-settlement rails provide minimal recourse once funds move, compelling platforms to invest in behavioral analytics and multi-factor authentication. False positives disrupt legitimate transactions, so balancing security and user experience remains a critical challenge for the B2B payments market.
*Our forecasts treat driver/restraint impacts as directional, not additive. The impact forecasts reflect baseline growth, mix effects, and variable interactions.
Segment Analysis
By Payment Type: Cross-Border Flows Outpace Domestic Growth
Domestic transactions dominated the B2B payments market in 2025 with an 82.89% share, reflecting mature local rails and lower regulatory friction. Cross-border flows, though smaller, are expanding at a 16.52% CAGR as multinational supply chains and B2B marketplaces proliferate. Emerging payment corridors linking India and the United Arab Emirates or Singapore and Thailand have piloted instant settlement using central-bank digital-currency prototypes, cutting settlement from days to seconds. Providers that bundle multi-currency accounts, hedging tools, and local-clearing connectivity stand to capture rising cross-border demand.
Linkages between domestic and international instant networks may narrow pricing differentials over time, pressuring legacy correspondent-banking models. As cross-border rails mature, treasury teams will expect the same data richness and straight-through reconciliation they enjoy domestically. Fintechs offering unified application-programming-interfaces for global coverage are positioning as preferred partners for platform-based commerce, reinforcing structurally higher growth for this segment of the B2B payments market.


By Payment Mode: Digital Rails Chip Away At Traditional Dominance
Traditional modes such as wires and checks still accounted for 64.78% of the B2B payments market size in 2025, underpinned by perceived bank-level security and entrenched enterprise workflows. Digital rails, encompassing real-time APIs, card networks, and blockchain-based options, are growing at a 17.31% CAGR. Cloud platforms like Bill.com processed USD 280 billion in fiscal-2025 volume, with digital penetration above 70% of client payments.
ISO 20022 messaging standards are enabling richer data fields that automate reconciliation across both legacy and next-generation systems. As software vendors embed payment orchestration, enterprises gain real-time visibility and can automate approval flows, reducing manual touchpoints and fraud exposure. The expanding feature set encourages migration away from batch files, supporting sustained share gains for digital channels within the B2B payments market.
By Enterprise Size: SMEs Close The Capability Gap
Large enterprises controlled 60.31% of transaction value in 2025, leveraging bespoke integrations and favorable interchange agreements. Small and medium enterprises, however, are projected to post a 16.23% CAGR through 2031 as low-cost, cloud-native platforms democratize advanced payment capabilities. Open-banking rules in Europe oblige banks to expose APIs, letting SMEs share data with fintech providers for automated reconciliation and liquidity forecasts.
Platforms like Stripe, PayPal, and Block have bundled invoicing, payment acceptance, and working-capital credit, aggregating SME volumes to negotiate enterprise-level pricing. As adoption widens, the B2B payments market share gap between large corporates and SMEs is set to narrow, accelerating overall digital-payment penetration.
By End-User Vertical: BFSI Leadership Faces Multi-Sector Momentum
Banking, financial services, and insurance generated 25.18% of market demand in 2025 thanks to high-value interbank transfers and stringent audit requirements. Healthcare, professional services, and education are the fastest-expanding verticals at an 18.02% CAGR, reflecting epidemic-induced digitization and cloud enterprise-resource-planning rollouts. Hospitals replace paper checks with virtual cards for medical-supply procurement, while universities adopt e-wallet disbursements for international tuition payments.
Manufacturing prioritizes supply-chain finance tools that allow suppliers to obtain early payment at a discount, and energy companies require milestone-based disbursements for capital projects. Specialized providers that tailor workflows to vertical nuances, such as lien-waiver management in construction, are carving defensible niches within the broader B2B payments market.
Geography Analysis
North America held 34.27% of 2025 transaction value, supported by FedNow, mature card networks, and deep corporate-treasury expertise. Canada’s Real-Time Rail and Mexico’s CoDi platform extend instant-payment capability across the continent. Fintech challengers target cross-border United States-Latin America corridors, where compliance costs lift fees above 6%.
Asia-Pacific is projected to be the fastest-growing region at 17.42% CAGR, fueled by India’s UPI, China’s digital-yuan pilots, and Southeast Asia’s mobile-first ecosystems. Government mandates for interoperable real-time networks create a level playing field for local fintechs and global platforms alike.
Europe benefits from SEPA Instant reachability and impending e-VAT mandates, stimulating adoption across Germany, France, and the Netherlands. The United Kingdom’s Faster Payments remains a benchmark, enabling fintechs such as Revolut to embed treasury tools. The Middle East and South America invest in central-bank digital-currency pilots, while Africa shows mixed progress, with South Africa’s modernization contrasting with mobile-money dominance elsewhere. Collectively, regional policy actions are converging toward instant settlement, reinforcing the long-run expansion of the B2B payments market.

Competitive Landscape
The competitive field is moderately fragmented. Visa and Mastercard extend beyond card rails by acquiring cloud-native processors, while JPMorgan Chase and Bank of America bundle payments with multi-currency liquidity and foreign-exchange services. API-first fintechs such as Stripe, Adyen, and Wise capture share by embedding payment orchestration into software workflows, reducing merchant reliance on direct banking relationships.
Value capture is migrating upstream from transaction processing to control of the software layer where payment decisions originate. Visa’s acquisition of Pismo added issuer-processing capability, and Adyen’s tie-up with SAP embeds payment orchestration inside enterprise-resource-planning screens. Blockchain-native entrants like Paystand target milestone-based construction payouts, signaling white-space opportunity in vertical workflows.
As real-time settlement commoditizes, ecosystem orchestration becomes the key differentiator. Providers that combine compliance tooling, fraud analytics, and working-capital solutions within a unified interface are best placed to gain share in the evolving B2B payments market.
B2B Payments Industry Leaders
Visa Inc.
Mastercard Incorporated
American Express Company
JPMorgan Chase and Co.
Fidelity National Information Services, Inc. (FIS Global)
- *Disclaimer: Major Players sorted in no particular order

Recent Industry Developments
- January 2026: Mastercard agreed to acquire Recorded Future for USD 2.65 billion to strengthen B2B fraud detection.
- December 2025: JPMorgan Chase expanded Onyx Digital Assets to support tokenized collateral transfers for repo transactions.
- November 2025: Stripe launched Stripe Treasury, letting B2B platforms embed multi-currency accounts and automated reconciliation.
- October 2025: Visa completed its USD 1 billion purchase of Pismo, adding real-time issuer processing.


Global B2B Payments Market Report Scope
B2B payments is the transfer of value denominated in currency from buyer to supplier for good or services supplied. B2B payments can be a one time or recurring transaction depending on the contractual agreement made between the buyer and supplier.
The B2B Payments Market Report is Segmented by Payment Type (Domestic Payments, Cross-Border Payments), Payment Mode (Traditional, Digital), Enterprise Size (Small and Medium Enterprises, Large Enterprises), End-User Vertical (BFSI, IT and Telecom, Manufacturing, Energy and Utilities, Government and Public Sector, Other End-User Verticals), and Geography (North America, Europe, Asia-Pacific, South America, Middle East, Africa). The Market Forecasts are Provided in Terms of Value (USD).
| Domestic Payments |
| Cross-Border Payments |
| Traditional |
| Digital |
| Small and Medium Enterprises (SMEs) |
| Large Enterprises |
| Banking, Financial Services and Insurance (BFSI) |
| Information Technology and Telecom |
| Manufacturing |
| Energy and Utilities |
| Government and Public Sector |
| Other End-User Verticals |
| North America | United States |
| Canada | |
| Mexico | |
| Europe | United Kingdom |
| Germany | |
| France | |
| Italy | |
| Rest of Europe | |
| Asia-Pacific | China |
| Japan | |
| India | |
| South Korea | |
| Rest of Asia-Pacific | |
| South America | Brazil |
| Argentina | |
| Rest of South America | |
| Middle East | United Arab Emirates |
| Saudi Arabia | |
| Rest of Middle East | |
| Africa | South Africa |
| Rest of Africa |
| By Payment Type | Domestic Payments | |
| Cross-Border Payments | ||
| By Payment Mode | Traditional | |
| Digital | ||
| By Enterprise Size | Small and Medium Enterprises (SMEs) | |
| Large Enterprises | ||
| By End-User Vertical | Banking, Financial Services and Insurance (BFSI) | |
| Information Technology and Telecom | ||
| Manufacturing | ||
| Energy and Utilities | ||
| Government and Public Sector | ||
| Other End-User Verticals | ||
| By Geography | North America | United States |
| Canada | ||
| Mexico | ||
| Europe | United Kingdom | |
| Germany | ||
| France | ||
| Italy | ||
| Rest of Europe | ||
| Asia-Pacific | China | |
| Japan | ||
| India | ||
| South Korea | ||
| Rest of Asia-Pacific | ||
| South America | Brazil | |
| Argentina | ||
| Rest of South America | ||
| Middle East | United Arab Emirates | |
| Saudi Arabia | ||
| Rest of Middle East | ||
| Africa | South Africa | |
| Rest of Africa | ||


Key Questions Answered in the Report
How fast is the B2B payments market projected to grow through 2031?
It is forecast to expand at a 15.48% CAGR between 2026 and 2031, reaching USD 3.43 trillion by the end of the period.
Which region is expected to post the highest growth?
Asia-Pacific is projected to grow at a 17.42% CAGR due to government-mandated real-time payment networks and rapid supply-chain digitization.
How are SMEs benefiting from new payment technologies?
Cloud-native platforms bundle invoicing, acceptance, and financing, allowing SMEs to access enterprise-grade tools and close the technology gap.
What segments are expanding quickest by payment type and mode?
Cross-border flows lead payment-type growth at a 16.52% CAGR, while digital rails are advancing at a 17.31% CAGR.
Why are virtual cards gaining traction in corporate procurement?
They extend Days Payable Outstanding by 30-45 days, earn rebates of 1-2% of spend, and integrate with spend-management suites for real-time visibility.
What is the biggest operational hurdle for cross-border B2B payments?
Fragmented compliance regimes around AML, KYC, and foreign-exchange controls add cost and delay, making onboarding and transaction screening complex.
Page last updated on:


