Market Overview
| Study Period | 2020 - 2031 |
|---|---|
| Forecast Data Period | 2026 - 2031 |
| Historical Data Period | 2020 - 2024 |
| Market Size (2026) | USD 159.25 Billion |
| Market Size (2031) | USD 332.94 Billion |
| Growth Rate (2026 - 2031) | 15.89% CAGR |
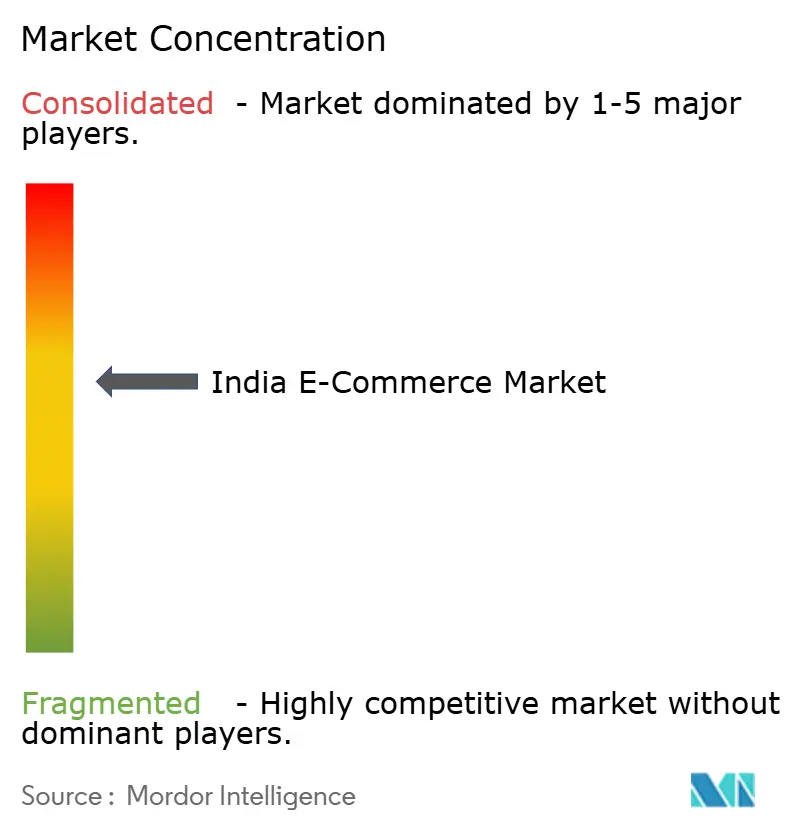
| Market Concentration | Medium |
Major Players *Disclaimer: Major Players sorted in no particular order Image © Mordor Intelligence. Reuse requires attribution under CC BY 4.0. | |

India E-Commerce Market Analysis by Mordor Intelligence
The India e-commerce market size stood at USD 159.25 billion in 2026 and is projected to reach USD 332.94 billion by 2031, reflecting a 15.89% CAGR over the forecast period. Payment-rail ubiquity, quick-commerce density, and vernacular content are lowering acquisition costs, while capital-heavy logistics investments are raising barriers to entry. Unified Payments Interface (UPI) use has pushed digital payments to 85% of online transaction volume, compressing settlement cycles and freeing working capital for long-tail sellers. Quick-commerce operators have opened more than 1,200 dark stores across the top-20 cities, turning grocery from a weekly stock-up into an impulse category. Meanwhile, the Open Network for Digital Commerce (ONDC) is widening distributor reach for 700,000 sellers, although its contribution to total gross merchandise value (GMV) remains nascent.
Key Report Takeaways
- By business model, business-to-consumer transactions captured 86.34% of India e-commerce market share in 2025, while business-to-business is forecast to expand at a 16.87% CAGR through 2031.
- By device type, smartphones delivered 76.42% of India e-commerce market in 2025; other connected devices are expected to grow at an 18.23% CAGR between 2026 and 2031.
- By payment method, UPI and digital wallets commanded 49.68% of India e-commerce market in 2025, whereas Buy Now Pay Later is set to record a 19.02% CAGR to 2031.
- By product category, fashion and apparel led with 31.67% of India e-commerce market in 2025, while food and beverages are projected to rise at a 17.68% CAGR through 2031.
Note: Market size and forecast figures in this report are generated using Mordor Intelligence’s proprietary estimation framework, updated with the latest available data and insights as of January 2026.
India E-Commerce Market Trends and Insights
Drivers Impact Analysis*
| Driver | (~) % Impact on CAGR Forecast | Geographic Relevance | Impact Timeline |
|---|---|---|---|
| Rising UPI and Instant Payment Adoption | +3.2% | National, strongest in Uttar Pradesh, Bihar, Madhya Pradesh, Rajasthan | Medium term (2–4 years) |
| Low-Cost Data Plans Fuel Video Commerce | +2.8% | National, faster in rural and semi-urban markets | Short term (≤ 2 years) |
| Direct-to-Consumer Brand Boom | +2.1% | National, early in Mumbai, Bengaluru, Delhi NCR | Medium term (2–4 years) |
| Quick-Commerce Penetration in Top-20 Cities | +3.5% | Mumbai, Delhi, Bengaluru, Hyderabad, Pune, Chennai | Short term (≤ 2 years) |
| Social-Commerce Influencer Monetization | +1.9% | National, higher traction in Tier II cities | Medium term (2–4 years) |
| Government ONDC Framework | +2.4% | National, pilots in Kerala, Karnataka, Delhi | Long term (≥ 4 years) |
| Source: Mordor Intelligence | |||
Quick-Commerce Penetration in Top-20 Cities Drives Momentum
Quick-commerce platforms have opened more than 1,200 micro-fulfillment sites, enabling 10-minute grocery delivery within 2-3 kilometers of dense catchments. Order frequency has risen to 4-5 purchases per user each month, lifting customer lifetime value above USD 300 over 12 months. Average basket sizes of USD 8-10 remain lower than traditional e-commerce, yet high repeat rates keep churn below 15%. Operating viability depends on 25-30 orders per location per hour, a threshold reached by only 40% of active dark stores in 2025, signaling likely consolidation. Zoning ambiguity around residential dark stores adds execution risk, pushing some operators to relocate to industrial zones that extend delivery times by 10-15 minutes.
Rising UPI and Instant Payment Adoption in Tier II-III Cities
UPI processed 228 billion transactions in 2025, with Tier II-III cities generating 60% of incremental volume.[1]National Payments Corporation of India, “UPI Transaction Statistics 2025,” npci.org.in The architecture’s interoperability lets consumers toggle across marketplaces without re-entering credentials, shifting platform competition to assortment depth and fulfillment speed. Real-time settlement trims merchant working-capital cycles from a week to near-zero, freeing liquidity for inventory replenishment. Feature-phone users upgrading to sub-INR 7,000 (USD 84) smartphones gain embedded payment apps, lowering onboarding frictions. As cash-on-delivery declines, reverse-logistics risk and its 8-12% cost premium shrink, further boosting contribution margins in the India e-commerce market.
Low-Cost Data Plans Fuel Video-Led Buying Journeys
Data costs averaged USD 0.09 per gigabyte in 2025, turning short-form video into the dominant discovery format.[2]Pine Labs Research Team, “The Video Commerce Playbook,” pinelabs.com Embedded reels have doubled session duration to 8-10 minutes and lifted the average basket value by 25-30%. Vernacular video listings convert 40-50% better than static images for apparel and home décor, shrinking return rates driven by fit uncertainty. Live-commerce events gained significant traction in 2024 as brands shifted a substantial portion of their digital budgets from banner ads to influencer streams, citing notably lower acquisition costs. Platforms with adaptive bitrate streaming and content moderation demonstrated superior performance compared to text-centric rivals lacking video infrastructure.
Government ONDC Framework Expands Seller Reach
ONDC had connected 700,000 sellers and handled 14 million transactions by mid-2024, lowering commission leakage from 15-25% to near-zero for compliant merchants.[3]Press Information Bureau, “Open Network for Digital Commerce Progress Report,” pib.gov.in The open protocol separates discovery, ordering, and fulfillment, allowing niche buyer-seller apps to interoperate without gatekeeping by large marketplaces. Transaction share remained below 1% of total GMV in 2025, constrained by limited consumer awareness and sub-optimal user experience. Long-term upside depends on public-procurement mandates and state-enterprise adoption that could mirror UPI’s trajectory once policy nudges align.
Restraints Impact Analysis*
| Restraint | (~) % Impact on CAGR Forecast | Geographic Relevance | Impact Timeline |
|---|---|---|---|
| Inconsistent Interstate Logistics and Reverse-Logistics Costs | -2.1% | National, acute in North-East states, Jammu and Kashmir, Himachal Pradesh | Medium term (2–4 years) |
| Compliance Burden from E-Commerce Rules Draft 2023 | -1.8% | National, heavier for marketplace operators | Short term (≤ 2 years) |
| High Customer Acquisition Cost Outside Metros | -1.5% | Tier II, Tier III and rural | Medium term (2–4 years) |
| Data-Privacy Constraints on Personalization | -1.2% | National, stricter in urban centers | Long term (≥ 4 years) |
| Source: Mordor Intelligence | |||
Inconsistent Interstate Logistics and Reverse-Logistics Costs
Cross-border truck routes face documentation variance across 28 states and 8 union territories, adding 12-18 hours to transit[4]Ministry of Road Transport and Highways, “Interstate Logistics Challenges Report 2024,” morth.nic.in. Reverse-logistics expenses consume 25-30% of order value on sub-USD 15 items, as pickups and quality checks lack forward-route density. Difficult topography in the North-East and Himalayan states necessitates USD 2-3 surcharges or exclusion from service maps, capping penetration at 85-90% of the national population. Non-standard packaging raises breakage claims to 8-10% for electronics, slicing margins by 3-5 percentage points. Only well-capitalized incumbents such as Flipkart and Amazon can absorb USD 500 million outlays for proprietary fleets, widening the moat over smaller rivals.
Compliance Burden from E-Commerce Rules Draft 2023
The draft rules introduce fallback liability on marketplaces for defective goods, forcing seller verification and product audits that have significantly increased operating costs. Restrictions on flash sales dilute the traffic spikes that historically boosted festive-season sales. Mandatory country-of-origin tags required catalog retrofits and grievance teams, adding substantial annual payroll expenses for platforms managing high daily order volumes. Inventory-led models such as JioMart face less friction, creating a structural advantage over open marketplaces. Ambiguity around related-party transactions triggered contract rewrites to avoid penalties under competition law.
*Our forecasts treat driver/restraint impacts as directional, not additive. The impact forecasts reflect baseline growth, mix effects, and variable interactions.
Segment Analysis
By Business Model: B2B Platforms Narrow the Gap
The business-to-business slice of the India e-commerce market size is expected to clock a 16.87% CAGR from 2026 to 2031, surpassing consumer momentum. IndiaMART reported significant growth in FY 2024, connecting millions of buyers with a vast network of suppliers across fragmented industrial categories. Faster invoice reconciliation and tax-compliant audit trails are shrinking working-capital cycles from 45-60 days to under 20 days. Government e-Marketplace processed USD 25 billion in procurement during FY 2024, validating institutional appetite for digital sourcing.
B2C transactions still dominate, holding 86.34% of India's e-commerce market share in 2025 on the back of electronics, fashion, and grocery demand. Dense last-mile networks enable 1-2 day deliveries in metros, a standard industrial supplier is beginning to emulate by co-locating spares inside consumer warehouses after peak retail hours. Hybrid fulfillment centers raise asset utilization above 80% and could narrow the growth-rate differential as Amazon India and Flipkart pilot shared nodes.


By Device Type (B2C): Connected Screens Multiply Touchpoints
Smartphones generated 76.42% of the market share in 2025, underscoring India’s mobile-first adoption pattern. The India e-commerce market size attributed to smart TVs, voice assistants, and wearables is forecast to expand at an 18.23% CAGR through 2031, powered by ambient interfaces that enable hands-free reorders. Amazon’s Alexa added voice shopping in 2024, generating 5-7% of repeat orders for low-consideration categories.
Desktop’s share has stabilized near 20%, catering to high-ticket electronics and furniture where larger screens aid specification checks. Progressive web apps now deliver 80-85% of native-app conversion without app-store drop-off, easing reach to low-storage devices and trimming acquisition outlays by 20-30%.
By Payment Method (B2C): Alternative Credit Widens Cart Values
UPI and wallets accounted for nearly half of GMV in 2025, favored for zero merchant-discount rates and instant settlement. Buy Now Pay Later volumes are projected to post a 19.02% CAGR, unlocking credit for salaried millennials lacking bureau scores. LazyPay and Simpl approve 60-70% of applicants by tapping employment and utility datasets. The Reserve Bank of India’s 2024 digital-lending rules mandate transparent fee disclosure, nudging providers to invest in consent infrastructure that may slow topline but boost trust.
Card payments retain 30-35% share for USD 50-plus baskets driven by rewards and buyer protection. Net banking and cash-on-delivery continue their slide, though the latter still represents up to 25% of orders in pin codes with sub-50% internet penetration.
By Product Category (B2C): Food and Beverages Anchor Frequency
Fashion and apparel led the India e-commerce market share with 31.67% in 2025 as Myntra and Ajio deepened premium brand curation. Food and beverages are poised to clock a 17.68% CAGR, with dark-store density reaching one node per 50,000 urban residents. Quick-commerce baskets attach personal-care and household SKUs to 40-50% of grocery orders, lifting margin mixes.
Consumer electronics maintained a 20-22% slice, propelled by 24-30 month smartphone replacement cycles and connected-home add-ons. Beauty, aided by influencer discovery, posted 26% revenue growth for Nykaa in Q2 FY 2025, with private labels topping 15% of sales. Furniture remains burdened by 15-18% return rates that augmented-reality investments aim to halve.


Geography Analysis
India’s online penetration remains significantly lower compared to leading markets like China and the United States, indicating substantial growth potential. Major cities continue to dominate online retail activity, but smaller cities and towns are increasingly contributing due to rising internet and smartphone penetration. The introduction of vernacular interfaces in multiple languages has notably enhanced user engagement compared to English-only platforms.
Rural connectivity under BharatNet has extended fiber to numerous gram panchayats, creating potential for a significant increase in new shoppers by the end of the decade, once logistics and trust challenges are addressed. Cross-border exports have grown substantially in recent years, driven by handicrafts and ayurvedic goods, supported by customs subsidies under the E-commerce Export Hub scheme. Per-capita online spending remains relatively low, indicating demand sensitivity where a majority of orders are for low-value items.
Data-localization mandates in the Digital Personal Data Protection Act align India with global standards, enabling multinationals to streamline tech stacks and reduce operating overhead. Municipal ambiguities on dark-store zoning in Bengaluru and Mumbai may influence quick-commerce cluster density over the medium term.
Competitive Landscape
The three largest platforms demonstrated significant market control in 2025, indicating moderate concentration. Horizontal marketplaces maintained their scale through in-house logistics and private labels, while vertical specialists relied on exclusive partnerships and subscription bundles to minimize customer churn. ONDC emerged as a structural disruptor but captured only a small share of the market in 2025.
Capital flows highlighted increasing barriers to entry: Swiggy raised substantial funding through a 2025 IPO to expand its dark store network, Zepto secured significant investment to penetrate Tier II markets, and Flipkart obtained funding from Walmart to enhance Shopsy’s social-commerce initiatives. Lenskart’s patent-backed virtual try-on technology effectively reduced eyewear returns. Marketing budgets are increasingly shifting toward creators, as influencer campaigns deliver notably lower acquisition costs compared to programmatic ads. This trend has prompted platforms to introduce automated payout tools and engagement audits.
India E-Commerce Industry Leaders
Amazon.com, Inc.
eBay, Inc.
Flipkart Internet Pvt. Ltd.
Alibaba Group (AliExpress)
Nykaa E-Retail Pvt. Ltd.
- *Disclaimer: Major Players sorted in no particular order

Recent Industry Developments
- November 2025: Swiggy raised USD 1.34 billion in its National Stock Exchange debut to fund 1,000 additional Instamart dark stores and expand its dining-out vertical.
- October 2025: Zepto unveiled a roadmap for 500 dark stores by mid-2026 across Tier II hubs such as Jaipur, Lucknow, and Chandigarh.
- August 2025: Amazon India committed USD 500 million to extend two-hour grocery delivery to 15 cities.
- June 2025: Flipkart introduced Flipkart Minutes, promising 10-minute delivery in Bengaluru and Mumbai via 50 dark stores.


India E-Commerce Market Report Scope
E-commerce is the buying and selling of goods and services over the Internet through online shopping. However, this term is often used to describe all the seller's efforts in selling products directly to consumers. It begins when potential customers learn about a product, buy it, use it, and ideally maintain lasting customer loyalty.
The Indian e-commerce market is segmented into B2C E-commerce (beauty and personal care, consumer electronics, fashion and apparel, food and beverage, furniture, and home) and B2B E-commerce. The report's scope includes market size and forecasting for B2B and B2C segments, with the B2C channel being further split by application. The market sizes and forecasts are provided in terms of value (USD) for all the above segments.
By Business Model
| B2C |
| B2B |
By Device Type (B2C)
| Smartphone / Mobile |
| Desktop and Laptop |
| Other Device Types |
By Payment Method (B2C)
| Credit and Debit Cards |
| Digital Wallets and UPI |
| BNPL |
| Other Payment Methods |
By Product Category (B2C)
| Beauty and Personal Care |
| Consumer Electronics |
| Fashion and Apparel |
| Food and Beverages |
| Furniture and Home |
| Toys, DIY and Media |
| Other Product Categories |
| By Business Model | B2C |
| B2B | |
| By Device Type (B2C) | Smartphone / Mobile |
| Desktop and Laptop | |
| Other Device Types | |
| By Payment Method (B2C) | Credit and Debit Cards |
| Digital Wallets and UPI | |
| BNPL | |
| Other Payment Methods | |
| By Product Category (B2C) | Beauty and Personal Care |
| Consumer Electronics | |
| Fashion and Apparel | |
| Food and Beverages | |
| Furniture and Home | |
| Toys, DIY and Media | |
| Other Product Categories |


Key Questions Answered in the Report
How big is the India e-commerce market in 2026?
The market reached USD 159.25 billion in 2026.
What is the forecast growth rate through 2031?
Aggregate GMV is projected to register a 15.89% CAGR, reaching USD 332.94 billion by 2031.
Which segment is expanding fastest?
Food and beverages, propelled by quick-commerce, is expected to grow at a 17.68% CAGR.
How much share do smartphones generate?
Smartphones accounted for 76.42% of GMV in 2025, the largest share among devices.
What role does UPI play in online spending?
UPI and digital wallets processed 49.68% of payment volume in 2025, delivering instant, zero-fee settlement that supports small-ticket orders.
Are B2B platforms catching up with B2C?
Yes, B2B e-commerce is forecast to expand at a 16.87% CAGR, outpacing the consumer segment as procurement digitizes.
Page last updated on:


