Market Overview
| Study Period | 2020 - 2031 |
|---|---|
| Forecast Data Period | 2026 - 2031 |
| Historical Data Period | 2020 - 2024 |
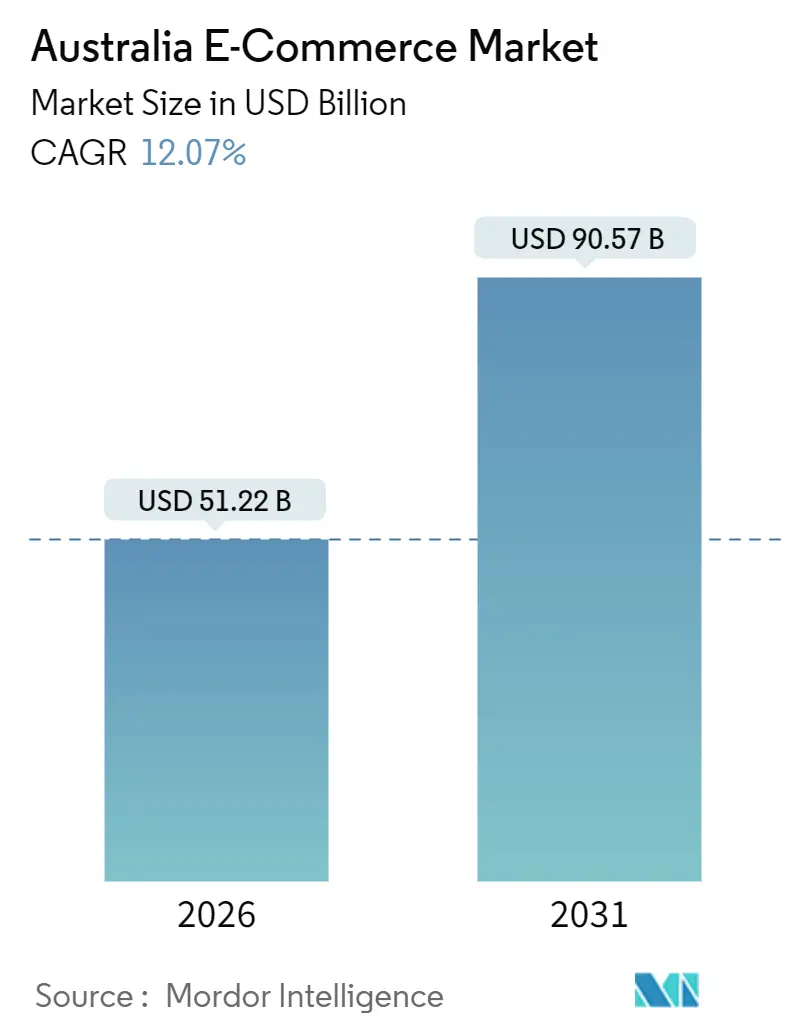
| Market Size (2026) | USD 51.22 Billion |
| Market Size (2031) | USD 90.57 Billion |
| Growth Rate (2026 - 2031) | 12.07% CAGR |
| Market Concentration | Medium |
Major Players *Disclaimer: Major Players sorted in no particular order Image © Mordor Intelligence. Reuse requires attribution under CC BY 4.0. | |
Australia E-Commerce Market Analysis by Mordor Intelligence
The Australia e-commerce market size is valued at USD 51.22 billion in 2026 and is projected to reach USD 90.57 billion by 2031, expanding at a 12.07% CAGR. Rapid fulfillment automation, strong buy now pay later (BNPL) uptake and sustained mobile commerce growth underpin this acceleration. Retailers are shrinking delivery windows to less than 2 hours, BNPL providers such as Afterpay are lifting average order values among Gen Z shoppers and smartphone-led browsing continues to dominate traffic. Meanwhile, dark-store networks, click-and-collect programs and retail media monetization enhance margins, even as rising rural shipping surcharges and impending fee caps pressure profitability. Strategic opportunities center on fulfillment speed, payment optionality and cross-border demand for Australian wellness brands, while regulatory and logistics frictions temper outlook in regional markets.
Key Report Takeaways
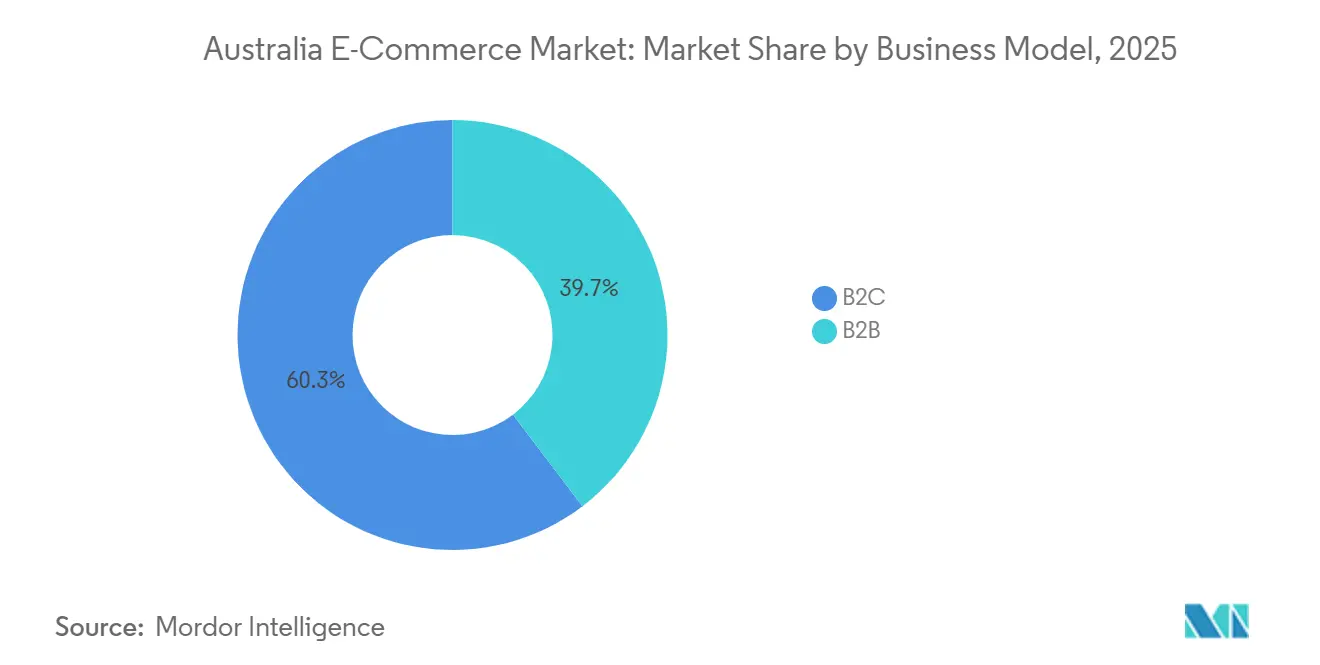
- By business model, the B2C channel held 60.34% of the Australia e-commerce market share in 2025, whereas the B2B segment is forecast to advance at a 13.12% CAGR through 2031.
- By device type, smartphones captured 63.47% revenue share in 2025, yet smart TVs and voice assistants are poised to grow at a 14.23% CAGR to 2031.
- By payment method, credit and debit cards represented 44.61% of the Australia e-commerce market size in 2025, while BNPL is expanding at a 13.47% CAGR to 2031.
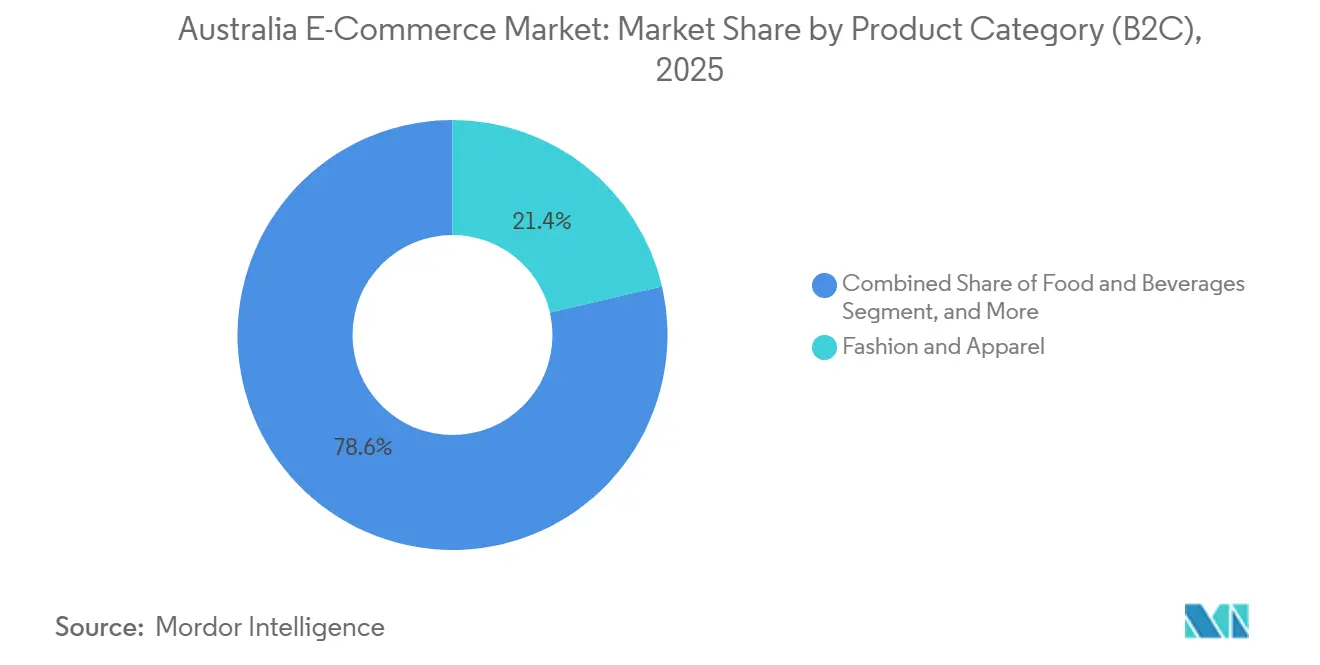
- By product category, fashion and apparel commanded 21.38% of the Australia e-commerce market size in 2025 and food and beverages is projected to rise at a 12.83% CAGR through 2031.
Note: Market size and forecast figures in this report are generated using Mordor Intelligence’s proprietary estimation framework, updated with the latest available data and insights as of January 2026.
Australia E-Commerce Market Trends and Insights
Drivers Impact Analysis*
| Driver | (~) % Impact on CAGR Forecast | Geographic Relevance | Impact Timeline |
|---|---|---|---|
| Afterpay-Led BNPL Uptake Accelerating Gen Z Average Order Values | +2.1% | National, especially Sydney, Melbourne and Brisbane metros | Medium term (2-4 years) |
| Dark-Store Grocery Expansion Enabling Sub-2-Hour Metro Delivery | +1.8% | Sydney, Melbourne, Brisbane and Perth metro cores | Short term (≤ 2 years) |
| Click-and-Collect Mandates Reducing Last-Mile Costs for Omnichannel Retailers | +1.5% | National, with early gains in suburban and regional centers | Medium term (2-4 years) |
| Increasing Cross-Border Demand for Australian Wellness Brands via Chinese CBEC Gateways | +1.3% | Export-focused firms in Victoria and New South Wales | Long term (≥ 4 years) |
| 5G Roll-Out Lifting Mobile Checkout Conversions | +1.2% | National, urban coverage leading | Short term (≤ 2 years) |
| Retail Media Network Monetization Improving Marketplace Unit Economics | +1.0% | National, led by Woolworths, Coles and Amazon | Medium term (2-4 years) |
| Source: Mordor Intelligence | |||
Afterpay-Led BNPL Uptake Accelerating Gen-Z Average Order Values
BNPL penetration surpassed 3.5 million active Afterpay users by early 2025, and Gen Z shoppers now place orders 30% larger than traditional credit-card purchasers in fashion and electronics.[1]Australian Financial Review, “Afterpay Hits 3.5M Australian Users as BNPL Growth Continues,” afr.com Checkout friction has fallen because installment options replace revolving credit, lowering cart abandonment that once stripped 15-20% of potential revenue. Zip’s rollout in Coles and Woolworths self-checkout lanes during 2024 pushed BNPL beyond discretionary items into essential grocery baskets. Although the Australian Securities and Investments Commission proposed mandatory credit checks in 2025, reduced default risk is expected to balance slower account growth.[2]Australian Securities and Investments Commission, “ASIC Proposes Credit Checks for BNPL Providers,” asic.gov.au The persistent preference for liquidity among younger cohorts positions BNPL to keep absorbing share from cards throughout the forecast period.
Dark-Store Grocery Expansion Enabling Less-than-Two-Hour Metro Delivery
Woolworths runs 15 automated customer fulfillment centers processing more than 30,000 online grocery orders daily, compressing delivery to under 2 hours in Sydney and Melbourne. Coles mirrored the strategy with its Ocado-powered Melbourne site, where robotic grids pick 6,500 units per hour.[3]Australian Financial Review, “Coles Ocado Automated Warehouse Opens in Melbourne,” afr.com This capacity encourages shoppers to trade larger baskets for immediacy in dense urban corridors where traffic deters store visits. ALDI’s DoorDash partnership, rolled out nationally by September 2025, layered 1,800 SKUs onto same-day networks, escalating the quick-commerce race. Because each dark store costs upward of AUD 90 million (USD 60 million), only capital-rich chains can scale, forcing smaller rivals into margin-dilutive third-party aggregators.
Click-and-Collect Mandates Reducing Last-Mile Costs for Omnichannel Retailers
Click-and-collect contributed around 40% of national e-commerce sales in 2024 as retailers waived delivery fees to nudge customers toward pickup. Bunnings extended its Direct-to-Boot service to more than 300 outlets, allowing same-day curbside retrieval for bulky orders. Woolworths and Coles integrated dedicated bays that cut wait times below 5 minutes, heightening repeat use. Retailers note that 30–35% of pickup customers add in-store items, offsetting free-pickup margin loss. Australia Post’s 20% rural surcharges in 2025 further tilted regional economics toward pickup, though sparse store networks still limit viability in remote zones.[4]Australia Post, “2025 Parcel Delivery Pricing Update,” auspost.com.au
Increasing Cross-Border Demand for Australian Wellness Brands via Chinese CBEC Gateways
Australian labels such as Swisse, Blackmores and A2 Milk generated significant revenue through Tmall Global and JD Worldwide in 2024-2025 as Chinese consumers sought trusted origin products. Tmall’s Australia pavilion carried more than 2,000 SKUs, dominated by vitamins, infant formula and skincare. JD Worldwide’s bonded warehouses cut delivery to 3-5 days, lifting conversions. China’s 2024 positive list raised per-transaction ceilings to CNY 5,000 (USD 700), enabling higher-value checkouts without full import duty. Tariff removal under the Australia-China Free Trade Agreement further boosts price competitiveness.
Restraints Impact Analysis*
| Restraint | (~) % Impact on CAGR Forecast | Geographic Relevance | Impact Timeline |
|---|---|---|---|
| Australia Post Rural Capacity Constraints Inflating Shipping Surcharges | -1.4% | Western Australia, Northern Territory, Queensland outback | Short term (≤ 2 years) |
| ACCC Draft Cap on Marketplace Service Fees Squeezing Margins | -1.1% | National | Medium term (2-4 years) |
| Packaging and Plastics Bill 2025 Raising Fulfillment Costs | -0.9% | National, higher impact on high-volume, low-margin goods | Long term (≥ 4 years) |
| Growing Online Return Rates Eroding Fashion and Apparel Profitability | -0.8% | National, concentrated in fashion verticals | Medium term (2-4 years) |
| Source: Mordor Intelligence | |||
Australia Post Rural Capacity Constraints Inflating Shipping Surcharges
Australia Post imposed surcharges exceeding 20% on remote deliveries during 2025, citing low-density route costs. Regional merchants face a stark choice between diluting margins or passing fees that push cart abandonment above 40% for orders under AUD 100 (USD 67). Competing carriers focus on metro corridors, leaving a service vacuum in rural Australia. Regulatory asymmetry compounds the issue, as Australia Post retains a letters monopoly yet has no parcel-price ceiling, a gap highlighted in the ACCC’s 2024 postal inquiry.[5]Australian Competition and Consumer Commission, “ACCC Inquiry into Australia Post Services 2024,” accc.gov.au Sparse click-and-collect locations limit alternative fulfillment, depressing online adoption outside major centers.
ACCC Draft Cap on Marketplace Service Fees Squeezing the Margins
The ACCC’s digital platform services inquiry proposed capping referral and fulfillment fees at 15% in 2024, a move that would trim marketplace margins by 3-5 percentage points. Amazon Australia currently charges sellers 8-15% on referrals plus 5-8% for FBA services. eBay’s final-value and promoted-listing fees can hit 14%, also in policy crosshairs. Fee cuts could draw more sellers, heightening competition and depressing unit economics while fixed compliance costs under the Australian Consumer Law remain unchanged. Operators must balance lower take-rates with investments in trust and safety or risk eroding customer experience.
*Our forecasts treat driver/restraint impacts as directional, not additive. The impact forecasts reflect baseline growth, mix effects, and variable interactions.
Segment Analysis
By Business Model: B2B Digitization Accelerates
B2C transactions accounted for 60.34% of the Australia e-commerce market in 2025, yet B2B sales are forecast to expand at a 13.12% CAGR through 2031. High purchase frequency, lower basket values and entrenched consumer platforms sustain B2C dominance, while small and medium enterprises shift procurement online to reduce manual ordering. Amazon Business attracted more than 10,000 Australian vendors by 2025, offering multi-user accounts and tax-exempt purchasing options. BigCommerce reported rising demand for integrated approval workflows that replicate enterprise resource planning features. The convergence of shared fulfillment nodes and unified inventory systems lets retailers amortize fixed costs across both channels, widening competitive moats.
Longer sales cycles, credit terms and larger average order values differentiate B2B economics, but digital catalogs now incorporate bulk pricing and punch-out integration, narrowing usability gaps with consumer experiences. Woolworths leverages its grocery supply chain to serve hospitality operators, an adjacency that cuts last-mile duplication. Marketplaces able to reconcile B2C velocity with B2B basket size are positioned to capture a sizable slice of incremental gross merchandise value. Accordingly, the Australia e-commerce market should witness deeper vendor-managed inventory partnerships and curated vertical portals over the forecast horizon.


By Device Type (B2C): Mobile Commerce Dominance
Smartphones contributed 63.47% of B2C revenue in 2025 as retailers embraced app-first strategies and seamless biometric payments. Desktops still drive considered purchases such as large appliances because screen real estate eases comparison. Temple and Webster noted that 55% of furniture sales remained desktop-based in 2025. Meanwhile, non-traditional access points are growing quickly: smart TVs and voice assistants are projected to rise at 14.23% CAGR to 2031, aided by Amazon Alexa re-order functionality and early streaming-commerce pilots. The Iconic’s shoppable video tests lifted conversion by 20% among Gen Z users.
Fragmented entry points complicate attribution and inventory planning, yet they also diversify traffic away from Google and Meta paid channels. Retailers embedding one-click payments and persistent login tokens on every screen lower friction across the shopper journey. As 5G coverage expands, latency drops and augmented-reality overlays enhance conversion on smaller displays. Overall, multi-device orchestration will play a central role in sustaining engagement and average order values within the Australia e-commerce market.
By Payment Method (B2C): BNPL Disruption Accelerates
Cards retained 44.61% share of online payments in 2025, underpinned by established infrastructure and reward programs. Yet BNPL is scaling at 13.47% CAGR, driven by zero-interest installments and gamified repayment apps. Afterpay and Zip together cover both discretionary and grocery segments, illustrating a maturation from early fashion focus. Digital wallets such as Apple Pay and Google Pay shrink checkout time on mobile, especially after network tokenization reduced friction.
BNPL merchant fees exceed card interchange but merchants tolerate the premium because basket uplift offsets margin dilution. Regulators plan to impose credit checks that could slow customer acquisition yet reduce write-offs. Cards will remain relevant for high-ticket travel and electronics purchases, while bank transfers and cash-on-delivery persist in niche cross-border contexts. Overall, checkout diversification cushions the Australia e-commerce market from single-point failure risks and underpins conversion resilience.
By Product Category (B2C): Food and Beverages Transformation
Fashion and apparel held 21.38% of 2025 gross merchandise value, anchored by The Iconic’s 2 million active customers and Shein’s USD 819 million Australian turnover. Still, food and beverages is tracking a 12.83% CAGR as dark stores and same-day fulfillment bridge the gap between online ordering and mealtime. Coles and Woolworths invested a combined AUD 200 million (USD 134 million) in automation between 2024 and 2025, enabling chilled-chain reliability within 2 hours. ALDI’s DoorDash rollout intensified grocery competition with 1,800 SKUs accessible nationally.
Electronics enjoy high average selling prices and low return rates, while beauty thrives on subscription replenishment and influencer engagement. Furniture depends on AR visualization, and DIY leverages click-and-collect to avoid bulky-item delivery charges. Fashion faces elevated return rates exceeding 30%, pressing retailers to develop virtual sizing or offset costs through membership fees. Category dynamics therefore remain heterogeneous, with infrastructure and customer-experience innovations dictating growth pockets inside the Australia e-commerce market.

Geography Analysis
Australia’s e-commerce sales concentrate heavily in New South Wales and Victoria, together representing about two-thirds of national gross merchandise value in 2025. Sydney and Melbourne benefit from dense populations, higher disposable income and the nation’s most advanced logistics nodes. Queensland accelerated during 2025 after Coles and Woolworths extended dark-store coverage to Brisbane and Gold Coast, shrinking grocery delivery to under 2 hours. Western Australia and South Australia lag because longer trunk routes inflate shipping surcharges and restrain next-day delivery promises.
Tasmania and Northern Territory remain underserved due to low density and high inbound freight costs, though local operators are piloting micro-fulfillment to boost service levels. The Australian Capital Territory exhibits outsized per-capita online spend given public-sector salaries and early tech adoption. Export-oriented merchants base warehouse operations near Melbourne and Sydney airports to expedite cross-border shipments through bonded zones into China. Regulatory alignment under the Australia–China FTA further incentivizes exporters in these states.
5G coverage reached 85% of Australians by mid-2025, but rural areas trail metro regions by 12-18 months, widening the digital divide in mobile checkout speed. Click-and-collect penetration is highest in suburban belts where store carparks facilitate curbside handoff. Metro centers lean toward home delivery due to dense apartment living and limited parking. Consequently, regional strategy requires hybrid fulfillment combining postal, pickup and third-party aggregators, while metro strategy emphasizes automation and rapid delivery to defend share in the Australia e-commerce market.
Competitive Landscape
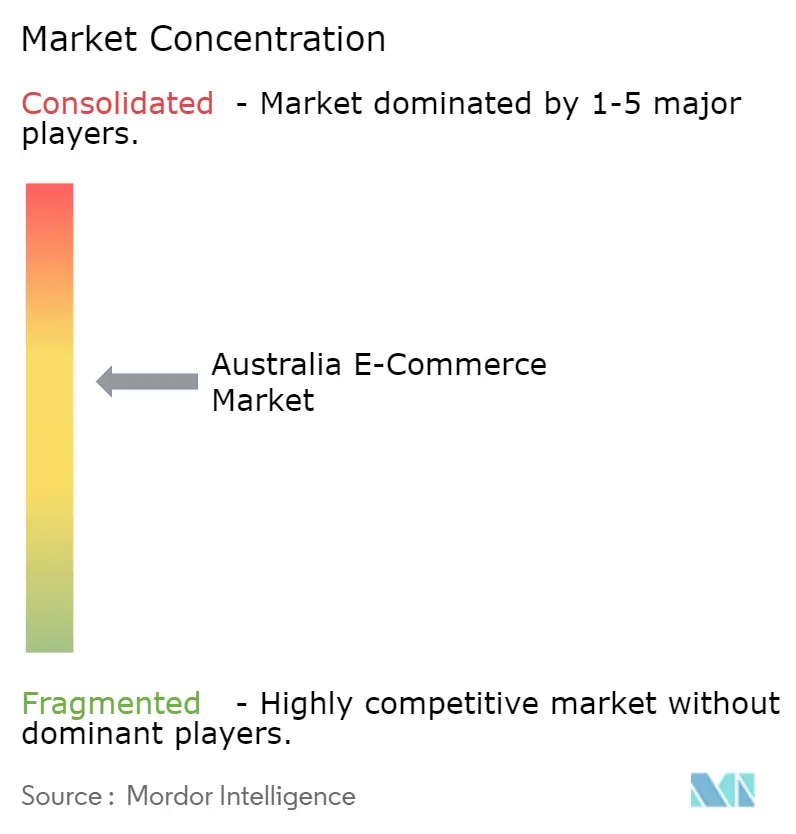
Competition is moderate, with Amazon, Woolworths, Coles and eBay jointly controlling roughly half of 2025 gross merchandise value, yet no single platform dominates every category. Amazon generated USD 5.2 billion in Australian revenue during 2024, leveraging Prime and an expanded Sydney-Melbourne warehouse footprint to push same-day delivery. Woolworths operates 15 automated centers, while Coles’ Ocado facility enhances grocery speed parity. Shein posted USD 819 million sales in 2024, forcing incumbents to adjust inventory velocity and price points. Temu entered in 2024, surpassing USD 1.7 billion within a year and introducing ultra-low prices and gamified shopping mechanics.
Market share defense centers on fulfillment speed, payment flexibility and high-margin retail media. Woolworths’ CartAds, Coles 360 and Amazon Ads convert first-party data into 70%-plus-margin ad revenue, cushioning rising fulfillment costs. Afterpay’s 3.5 million Australian users deepen conversion advantages, while Zip’s grocery partnerships widen BNPL coverage. Smaller players such as Booktopia and Kogan have faced profitability headwinds, underscoring the need for capital scale and diversified margin levers. Voice commerce, B2B procurement portals and regional click-and-collect networks represent untapped niches that could shift competitive positioning in the Australia e-commerce market.
Australia E-Commerce Industry Leaders
eBay Australia Pty Ltd
Amazon Commercial Services Pty Limited
Kogan.com Ltd
Woolworths Group Ltd
Coles Group Ltd
- *Disclaimer: Major Players sorted in no particular order

Recent Industry Developments
- October 2025: The Iconic launched a tiered loyalty program alongside legal action against Shein.
- September 2025: ALDI Australia completed its national DoorDash grocery delivery rollout, adding 1,800 SKUs with sub-2-hour windows.
- June 2025: Woolworths Group closed MyDeal, absorbing AUD 90 million to AUD 100 million (USD 60 million to USD 67 million) in costs.
- August 2024: Booktopia Group was acquired by digiDirect after entering voluntary administration with AUD 60 million (USD 40 million) debt.


Research Methodology Framework and Report Scope
Market Definitions and Key Coverage
Our study defines Australia's e-commerce market as every business-to-consumer and business-to-business transaction settled online for physical goods delivered within Australia, regardless of device or payment instrument. Mordor Intelligence quantifies value in USD at checkout, net of returns, and includes cross-border purchases landed in the country.
Scope exclusion: We deliberately omit online travel, ride-hailing, streaming subscriptions, and other purely digital services.
Segmentation Overview
- By Business Model
- B2C
- B2B
- By Device Type (B2C)
- Smartphone / Mobile
- Desktop and Laptop
- Other Device Types
- By Payment Method (B2C)
- Credit and Debit Cards
- Digital Wallets
- Buy Now Pay Later (BNPL)
- Other Payment Methodss
- By Product Category (B2C)
- Beauty and Personal Care
- Consumer Electronics
- Fashion and Apparel
- Food and Beverages
- Furniture and Home
- Toys, DIY and Media
- Other Product Categories
Detailed Research Methodology and Data Validation
Primary Research
Our analysts interviewed marketplace sellers, parcel integrators, payment processors, and digital-first brands across New South Wales, Victoria, and Queensland. Discussions clarified average order values, BNPL penetration shifts, and fulfillment bottlenecks, letting us fine-tune growth drivers that raw statistics often mask.
Desk Research
We began by gathering macro and channel-level indicators from publicly available tier-1 sources such as the Australian Bureau of Statistics, Reserve Bank retail payment series, Australia Post eCommerce Industry reports, OECD broadband data, and trade association briefs from the National Retail Association and Australian Retailers Association. Company filings, investor decks, and press releases were scanned through D&B Hoovers and Dow Jones Factiva, giving us platform GMV trends and warehouse expansion plans that signal demand inflections. Import-export records on Volza helped size cross-border flows, while Questel patent counts informed technology adoption curves. These references illustrate our secondary foundation; many additional sources were also reviewed for context and cross-checks.
Market-Sizing & Forecasting
A top-down model starts with ABS retail turnover, applies the verified online penetration ratio, and then layers category-specific uplift factors such as smartphone shopping share, cross-border propensity, and BNPL uptake. Results are corroborated with selective bottom-up checks, sampled GMV of leading platforms, logistics parcel counts, and average selling price × volume snapshots, before volume-value reconciliations adjust the final total. Key variables in the forecast include household disposable income, mobile broadband speed, parcel-to-population ratio, and warehouse automation capacity. Multivariate regression, benchmarked against primary-research consensus, projects the 2025-2030 trajectory. Data gaps, for example, unreported private-label volumes, are bridged using benchmark proxies from comparable product clusters.
Data Validation & Update Cycle
Each draft model passes variance screening against historical series, peer signals, and prior editions; anomalies trigger re-contact with sources. A second-level analyst signs off only after assumptions align. Mordor refreshes the dataset annually and issues interim updates whenever policy, currency, or supply-chain events materially alter baselines.
Why Mordor's Australia E-commerce Baseline Is Widely Trusted
Published estimates diverge because firms slice the market differently, convert currencies on varied dates, or extrapolate from untested platform surveys. We address these pitfalls upfront.
Key gap drivers often stem from whether services like online travel are bundled, the choice of AUD-to-USD conversion timing, the freshness of parcel data, and the cadence at which models are rolled forward. By reporting only physical-goods checkout value, updating inputs every twelve months, and validating exchange rates at quarter-end, Mordor Intelligence delivers a midpoint that decision-makers find dependable.
Benchmark comparison
| Market Size | Anonymized source | Primary gap driver |
|---|---|---|
| USD 43.61 B (2025) | Mordor Intelligence | - |
| USD 57.11 B (2024) | Global Consultancy A | Includes travel bookings and digital media; uses calendar-year average FX, inflating value |
| USD 30.51 B (2024) | Regional Consultancy B | Excludes B2B flows and cross-border imports; relies on merchant survey sample not scaled nationally |
In short, our disciplined scope selection, mixed top-down and bottom-up build, and tight refresh rhythm create a transparent, reproducible baseline that sits comfortably between conservative and aggressive views, giving clients a stable footing for growth planning.


Key Questions Answered in the Report
What is the current value of the Australia e-commerce market?
The market is valued at USD 51.22 billion in 2026.
How fast is online grocery growing in Australia?
Food and beverages sales are forecast to expand at a 12.83% CAGR through 2031 thanks to dark-store and same-day delivery infrastructure.
Which payment method is gaining the most share among Australian online shoppers?
Buy now pay later is expanding at a 13.47% CAGR and is widely adopted by Gen Z consumers.
Why are rural shipping costs rising for Australian online retailers?
Australia Post added surcharges above 20% on remote deliveries during 2025 to cover low-density route expenses.
Which companies dominate Australian retail media networks?
Woolworths' CartAds, Coles 360 and Amazon Ads Australia are leading platforms selling sponsored placements to brands.
How concentrated is the competitive landscape?
The top five companies hold about half of gross merchandise value, reflecting moderate concentration.
Page last updated on:


