
Alcoholic Beverages Market Analysis by Mordor Intelligence
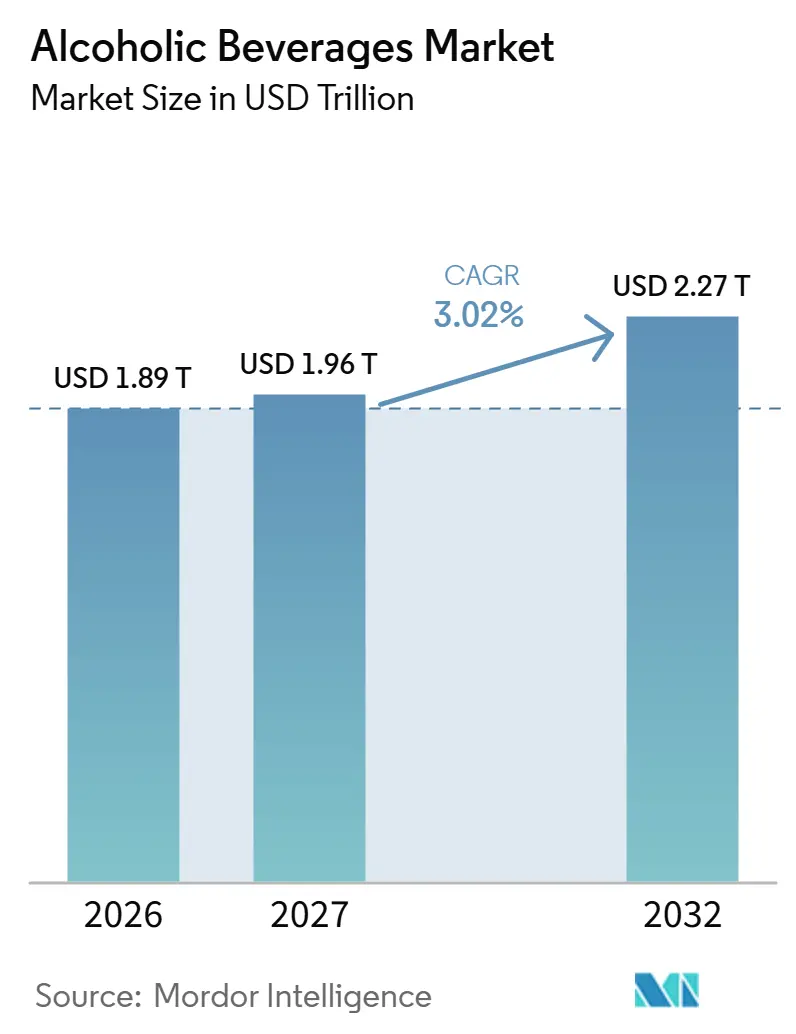
The alcoholic beverages market size is expected to grow from USD 1.89 trillion in 2026 to USD 1.96 trillion in 2027 and is forecast to reach USD 2.27 trillion by 2032 at 3.02% CAGR over 2027-2032.
Tourism expands hospitality selling opportunities, while alcohol duties limit the revenue suppliers retain from each sale. Strait of Hormuz shipping was disrupted from March 2, 2026, following Iran's closure declaration during the US-Israeli war on Iran. War-related shortage fears in India raise the risk of higher costs if brewers source glass bottles and aluminum cans from other countries. Capacity additions and new hospitality serve formats offer distinct expansion routes, whose returns must cover supply costs. Hospitality demand can yield less profit per sale when Indian suppliers switch packaging sources or UK and Canadian suppliers absorb higher duties.
Key Report Takeaways
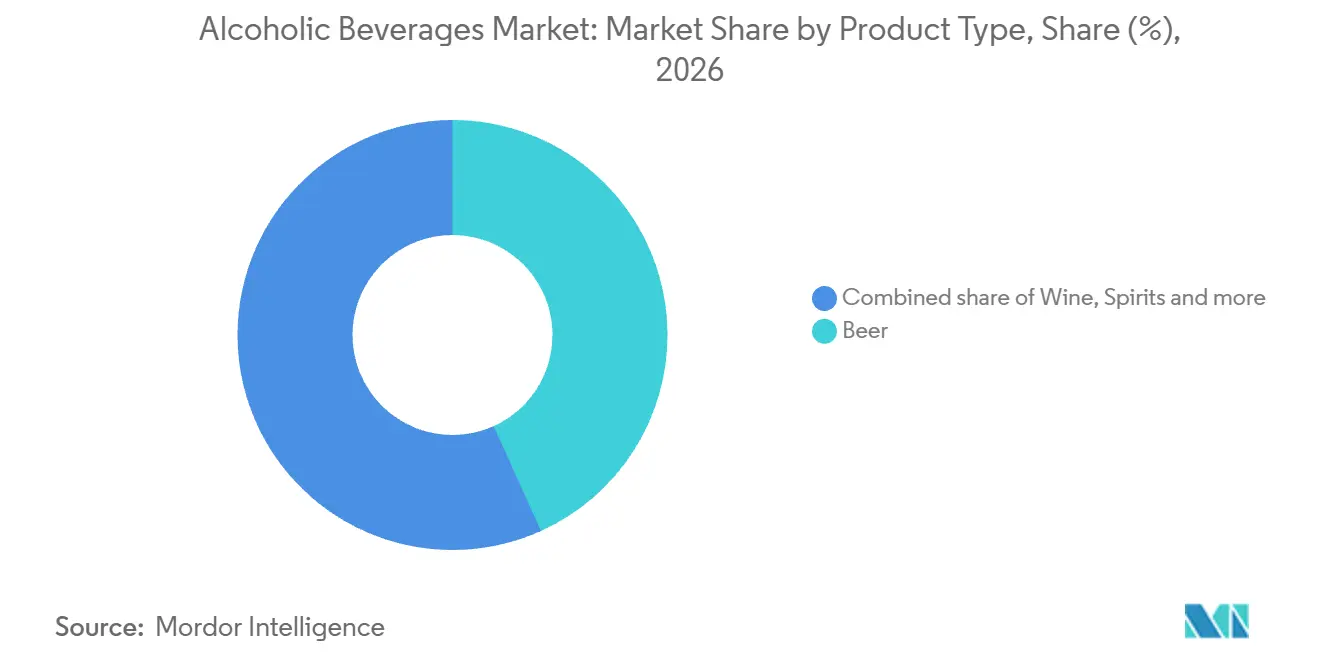
- By product type, beer led with a 43.25% alcoholic beverages market share in 2026, while spirits are forecast to grow fastest at 3.2% CAGR over 2027-2032.
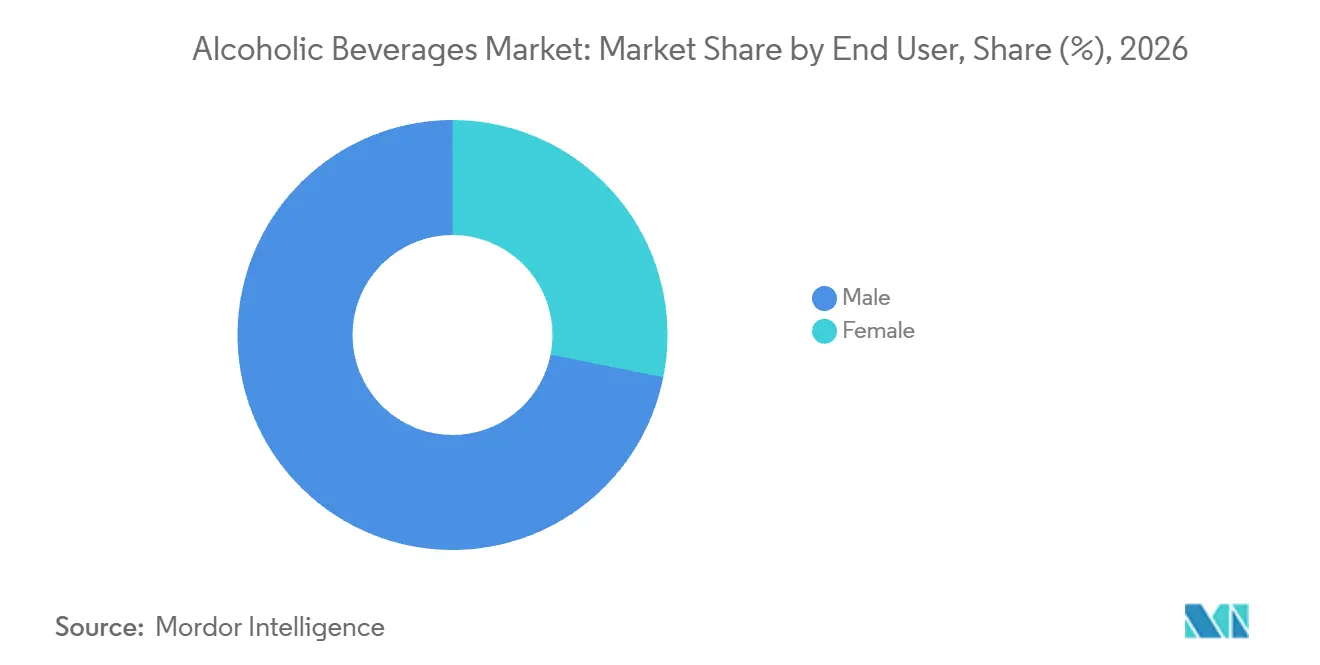
- Across end users, male consumers accounted for 71.85% of revenue in 2026, while female consumers are forecast to grow fastest at 3.5% CAGR over 2027-2032.
- For packaging type, bottles held a 73.98% share of the alcoholic beverages market size in 2026, while cans are forecast to grow fastest at 3.75% CAGR over 2027-2032.
- In distribution, on-trade led with 50.01% of revenue in 2026, while off-trade is forecast to grow fastest at 3.24% CAGR over 2027-2032.
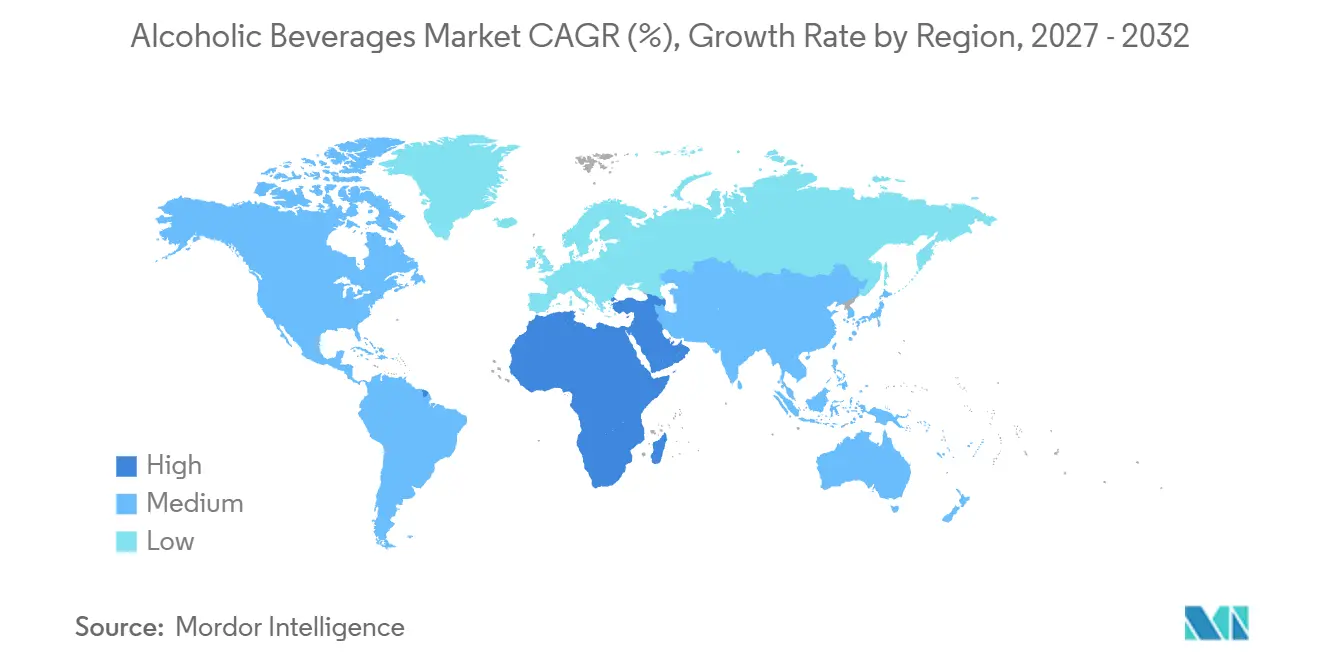
- Geographically, Asia-Pacific led with 29.36% of revenue in 2026, while the Middle East and Africa region is forecast to grow fastest at 4.5% CAGR over 2027-2032.
Note: Market numbers in this report are based on Mordor Intelligence's proprietary estimation framework, which combines nine months of actuals with Q4 projections for base year 2026.
Market Trends and Insights
Drivers Impact Analysis of Alcoholic Beverages Market*
| Driver | (~) % Impact on CAGR Forecast | Geographic Relevance | Impact Timeline |
|---|---|---|---|
| Growing Tourism and Hospitality Impact Positive Growth | +3.5% | Europe, Africa and Brazil | Short term (≤ 2 years) |
| Source: Mordor Intelligence | |||
Growing Tourism and Hospitality Impact Positive Growth
Growing international travel gives licensed hospitality venues a demand source that does not depend solely on local consumers. UN Tourism estimated 1.52 billion international tourist arrivals, representing overnight visitors, worldwide in 2025, up 4% from 2024. Its preliminary estimate put global international tourism receipts at USD 1.9 trillion in 2025, up 5% from 2024. For licensed venues, visitors can create drink-serving occasions beyond resident demand, giving tourism growth a route into beverage purchases. Europe received an estimated 793 million international arrivals in 2025, up 4% from 2024, the largest visitor base of any region. Africa's estimated 81 million arrivals rose 8% and Brazil's international arrivals grew 37% in 2025, so hospitality venues there face faster-growing visitor flows than in Europe.
Restraints Impact Analysis of Alcoholic Beverages Market*
| Restraint | (~) % Impact on CAGR Forecast | Geographic Relevance | Impact Timeline |
|---|---|---|---|
| Stringent Government Regulations | -0.5% | United Kingdom and Canada | Short term (≤ 2 years) |
| Source: Mordor Intelligence | |||
Stringent Government Regulations
Alcohol duties constrain the revenue producers and retailers can retain from a given consumer payment, complicating the conversion of demand into profitable sales. HMRC increased UK alcohol duty rates by 3.66% in line with retail-price inflation from February 1, 2026.[1] Canada's 2026 legislation, which received Royal Assent on June 18, set a 1.02 annual excise-duty adjustment factor for beer, spirits and wine, deemed effective April 1, 2026. If suppliers absorb these tax increases, less revenue is available to cover production and selling costs. Passing them through instead raises the price a buyer must accept, potentially weakening the return from hospitality demand. Suppliers in the United Kingdom and Canada therefore face lower margins if they absorb the increase or a risk of lower hospitality sales volumes if they pass it on.
*Our forecasts treat driver/restraint impacts as directional, not additive. The impact forecasts reflect baseline growth, mix effects, and variable interactions.
Alcoholic Beverages Market Segment Analysis
By Product Type:
Beer Scale and Spirits Demand Shape InvestmentBeer accounted for a 43.25% share of the alcoholic beverages market size in 2026. The largest segment includes Anheuser-Busch InBev SA/NV, which ranked first among listed brewing groups with 484.19 million hectoliters of beer output in 2025, down 2.5% from 2024. The existing output base gives ingredient and packaging suppliers a sizable brewing customer. Because that output was lower than in 2024, suppliers to this brewer need to defend existing throughput before counting on new volume.
Spirits represent the fastest-growing segment, with a forecast 3.2% CAGR over 2027-2032. In Q1 FY2026-27, Pernod Ricard SA reported very strong double-digit organic growth in imported spirits and strong double-digit organic growth in Seagram's Royal Stag and Blenders Pride whiskies in India.[2] The India result also benefited from favorable channel stocking as the business prepared for a potential IPO, a decision that remained subject to board approval. Several growing brands give the producer more than one route into Indian demand, so a commercial plan can be built around portfolio breadth. Investment is therefore better tied to repeat consumer demand than to a quarter that included a channel-stocking benefit.


By End User:
Beverage Preferences Sharpen Consumer PositioningMale consumers were the largest segment, accounting for 71.85% of market revenue in 2026. In 2025, 56.5% of EU men aged 16 or over consumed alcohol at least monthly, compared with 35.9% of women. In Gallup's July 2026 survey, 56% of US male respondents who drank alcohol said beer was the beverage they most often drank.[3] Beer-led positioning gives suppliers a product-specific route to the US male drinkers who named it as their most-drunk beverage.
Female consumers are the fastest-growing segment, with a forecast 3.5% CAGR over 2027-2032. In Gallup's July 2026 survey, 45% of US women who drink alcohol preferred wine and 37% preferred liquor. The 2 sizable preference groups give wine and spirits suppliers distinct routes into this audience, with potential demand for more than one type of alcoholic drink. Together, wine and liquor were the favorite beverages of 82% of US women who drink alcohol, so wine and spirits portfolios address most of this audience.
By Packaging Type:
Bottles Anchor Accounts as Cans Extend AdoptionBottles represented a 73.98% alcoholic beverages market share in 2026. In the fiscal year ended February 28, 2026, glass bottles accounted for 54% of Constellation Brands Inc.'s beer volume sold in the United States. For the largest segment, established bottling accounts provide an identifiable customer base for glass suppliers, with demand linked to the brewer's reported package mix. Constellation's 43% can share alongside its 54% bottle share makes the existing glass business part of a split package mix, giving glass suppliers a substantial account without requiring format conversion.
Cans are the fastest-growing segment, with a forecast 3.75% CAGR over 2027-2032. Aluminum cans accounted for 63.4% of US beer volume in 2025. Cans also represented 38% of Carlsberg AS's combined beer-and-soft-drinks production packaging mix in 2025, compared with 36% in 2024. The US measure establishes a large beer-use base, while the company comparison shows a producer shifting more of its combined output into cans. Established beer volumes offer recurring supply work, while customer-level format changes give can makers a separate route to incremental business.
By Distribution Channel:
Venue Scale and Online Collection Shape SalesOn-trade was the largest segment, accounting for 50.01% of market revenue in 2026. J D Wetherspoon PLC operated 792 pubs across its UK and Ireland operations at the end of fiscal 2026 on July 26, 2026, 2 fewer than at fiscal 2025 year-end. Venue-based scale makes the operator a concentrated point of access for suppliers, shifting the selling task toward winning an established account's drinking occasions. With 87 fewer pubs than in fiscal 2019, the estate gives suppliers a smaller venue base, increasing the importance of sales within existing pubs.
Off-trade is the fastest-growing segment, with a forecast 3.24% CAGR over 2027-2032. Endeavour Group Limited reported 34.8% growth in combined Dan Murphy's and BWS online sales in Australia for fiscal 2026, the 52 weeks ended June 28, 2026, compared with fiscal 2025. Approximately 61% of those brands' online orders were picked up in stores during that period. The pattern gives the store a direct role in digital demand capture, so online sales and physical outlets can complement each other within the same retail transaction.
Geography Analysis
Asia-Pacific Alcoholic Beverages Market
Asia-Pacific accounted for a 29.36% share of the alcoholic beverages market size in 2026, making it the largest region. Heineken NV reported 56.4 million hectoliters of total Asia-Pacific volume in fiscal 2025, including licensed volume, up 4.4% organically from fiscal 2024. Licensed volume rose 27.2%, compared with 0.5% growth in beer volume. The company reported strong performance and share gains in Vietnam, India, Myanmar and Laos, partly offset by a decline in Cambodia. This mix of licensed expansion and uneven country performance favors investment in locally successful brewing operations and brand partnerships, giving regional growth more than one operating route.
Middle East and Africa Alcoholic Beverages Market
Middle East and Africa is the fastest-growing region, with a forecast 4.5% CAGR over 2027-2032. Heineken NV's Ethiopia beer volume grew organically in the high teens in Q1 2026, while its Africa and Middle East segment reported higher net revenue in H1 2026 than in H1 2025. Physical beer-volume expansion creates a different commercial requirement from revenue gains alone, because additional drinks must be brewed and moved through local routes to customers. In Q1 2026, Heineken's Ethiopian net revenue grew organically in the forties against high-teens organic beer-volume growth, so price and mix lifted revenue beyond the added volume.
In North America, US craft-beer data for 2025 showed slightly stronger performance for brewery-site sales relative to distribution. In Europe, Portugal's 2025 national beer statistics showed a hospitality-led sales mix, with licensed on-trade venues ahead of wholesale and retail. South America offered a different demand opening in Brazil, where OIV estimated record wine consumption of 4.4 million hectoliters in 2025. Brazil's estimated wine consumption was 41.9% above the low 2024 level and 19.9% above its five-year average, giving suppliers a stronger national demand base in 2025.
Regional Editions
All regions
Regulatory Framework and Outlook
The comparison covers selected jurisdictions from the perspective of a large producer of packaged alcoholic drinks supplying domestic and imported products. Current access requirements include label approval, alcohol-strength disclosure and registration of covered manufacturing or distribution activities. Separate plans for labels, registration and packaging let the supplier address each duty where it affects product entry or customer supply.
Regulatory Table of Alcoholic Beverages Market
| Decision factor | United States | Germany | China | Brazil | South Africa |
|---|---|---|---|---|---|
| Primary authority | Alcohol and Tobacco Tax and Trade Bureau (TTB) | State food-control authorities for labeling | State Administration for Market Regulation (SAMR) for labels; Chinese customs administration for import inspection | Ministry of Agriculture and Livestock for registration | National Liquor Authority (NLA) for macro manufacturing and distribution |
| Key instruments or direction | Label-approval procedures and health-warning rules for covered beverages | EU alcohol-content labeling above 1.2% alcohol by volume (ABV); EU packaging regulation and German implementation act effective August 12, 2026 | Chinese-language and warning labels on bottled imports; GB 7718-2025 transition from March 16, 2027 | Registration of covered plant-origin beverages; Complementary Law 214 Selective Tax framework from January 1, 2027 | Macro-tier registration; certificate verification on certificates issued from February 18, 2026 |
| Commercial effect | Apply for label or bottle approval or exemption | Disclose actual alcohol content; prepare for covered distributors' reusable-format needs | Local-language warnings on bottled imports, including an impact warning on bottled beer | Prior registration for covered beverages, subject to expressly provided exceptions | Registration plus verifiable NLA certificates |
| Current policy attractiveness | Medium | Medium | Medium | Low | Medium |
| Future direction of policy attractiveness | Hardening | Hardening | No change | Hardening | No change |
| Source: Mordor Intelligence | |||||
Medium ratings reflect US label-approval or exemption applications, German alcohol-content disclosure above 1.2% ABV, Chinese-language health warnings on bottled imports and South African macro-tier registration with QR-code certificate verification on certificates issued from February 18, 2026. Hardening reflects proposed US per-serving disclosures 5 years after any resulting final rule and, from January 1, 2030, at least 10% reusable offerings by Germany's covered final distributors, with product exclusions. Brazil's Low rating follows from prior registration before covered plant-origin beverages may be produced or sold, subject to express exceptions, with further hardening from its Selective Tax schedule beginning January 1, 2027. For China, the US Alcohol and Tobacco Tax and Trade Bureau expects no substantial alcohol-label changes under GB 7718-2025 from March 16, 2027, while SAMR's scheduled duty relocates existing mandatory information to the smallest sales unit's outer packaging, including anti-counterfeit gift boxes that must be broken to read bottle labels.
Value Chain Stages
The value chain compares input suppliers, producers and distributors, with Heineken NV buying barley, hops, corn and bittersweet apples for cider and working with suppliers on crop yields and quality. Shipping through the Strait of Hormuz nearly halted after Iran declared it closed on March 2, 2026, during the US-Israeli war on Iran. Amid Iran-war shortage fears, the Federation of European Business in India's April 2, 2026 letter said alternative glass bottle and aluminum can sourcing could add 30% to Indian industry packaging costs. Container suppliers earn from packaging sales, while higher sourcing costs would reduce what beverage producers retain unless recovered through drink prices.
Value Chain Analysis Table of Alcoholic Beverages Market
| Primary activity | Key participants | Value capture | Bottleneck | Resilience response |
|---|---|---|---|---|
| Malt processing and supply | Malt suppliers such as Boortmalt | Malt sales | Securing consistent crop quality | Develop crop-quality requirements with growers |
| Container manufacture | Beverage-container manufacturers such as CANPACK | Can and bottle sales | Potential cost of alternative sourcing in India | Compare landed costs and qualify alternative container sources |
| Beverage production | Beer and cider producers such as Heineken NV | Finished-beverage sales | Allocating output across production sites | Balance plant schedules against product demand |
| Distribution and logistics | Integrated distribution operators such as Heineken NV; beverage-alcohol distributors such as Southern Glazer's Wine & Spirits | Beverage sales and distribution-service earnings | Matching delivery methods to local demand | Combine in-house and third-party delivery capacity where appropriate |
| Source: Mordor Intelligence | ||||
CANPACK reported that its beverage-can body volumes rose 3% in 2025 from 2024, so can supply from this maker was expanding before the 2026 disruption. On March 24, 2026, the Brewers Association of India, representing Heineken, Anheuser-Busch InBev and Carlsberg, reported that glass bottle prices had risen around 20% amid gas shortages linked to the Iran war. The increase reached brewers as a higher price for buying bottles, placing the cost pressure at the container procurement stage.
Competitive Landscape
Market Concentration
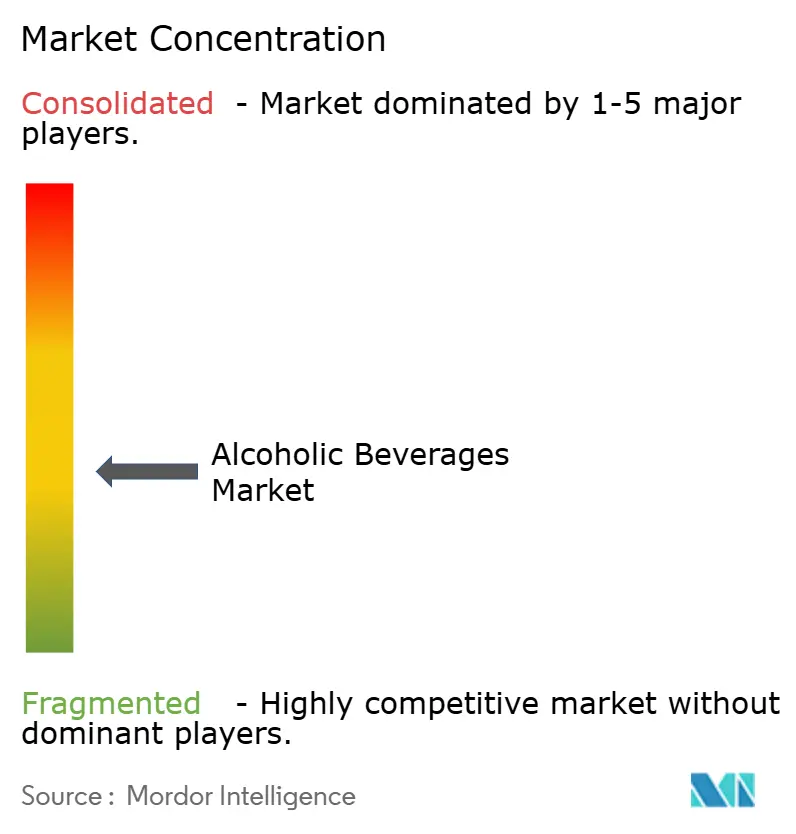
Competition is spread across brewing, spirits and wine groups with distinct product portfolios and geographic reach. Anheuser-Busch InBev SA/NV and Heineken NV compete as major brewers, while Diageo PLC sells a global portfolio spanning premium spirits and beer. Constellation Brands Inc. combines an imported-beer business serving the United States with wine and spirits, while Pernod Ricard SA supplies spirits and champagne. Diageo reported USD 19.64 billion in fiscal 2026 net sales, down 3% from fiscal 2025.
Constellation Brands Inc. spent more than USD 700 million on modular capacity additions at its breweries in fiscal 2026 to support expected future business needs. Its beer segment recorded net sales of USD 8.32 billion, below USD 8.54 billion in fiscal 2025. Heineken NV installed its adjacent non-alcoholic Heineken 0.0 draught offering in more than 10,000 European outlets in 2025. The moves illustrate different uses of investment, adding brewery capability or extending what hospitality accounts can serve. Constellation was funding future brewery needs during a year of lower beer net sales, separating its capacity commitment from immediate sales momentum.
Ownership changes place regulatory capability alongside production and brand investment in the competitive contest. Heineken NV reported in January 2026 that Nicaragua's PROCOMPETENCIA had approved its acquisition of FIFCO's stake in Nicaraguan Brewing Holding SA subject to implementing a local antitrust compliance program. Heineken then completed its acquisition of FIFCO's Central American beverage and retail businesses on January 30, 2026 after receiving all regulatory and corporate approvals, so the Nicaraguan clearance preceded closing. In September 2026, Saothair Capital Partners acquired FIFCO USA through a newly formed affiliate from Heineken subsidiary Distribuidora La Florida, and the business resumed its North American Breweries name.
Alcoholic Beverages Industry Leaders
-
Anheuser-Busch InBev SA/NV
-
Heineken NV
-
Diageo PLC
-
Constellation Brands Inc.
-
Pernod Ricard SA
- *Disclaimer: Major Players sorted in no particular order
Alcoholic Beverages Market Companies Covered in this Report
- Anheuser-Busch InBev SA/NV
- Heineken NV
- Diageo PLC
- Constellation Brands Inc.
- Pernod Ricard SA
- Bacardi Ltd
- Treasury Wine Estates Ltd
- Brown-Forman Corp.
- Kirin Holdings Co. Ltd
- Asahi Group Holdings Ltd
- Molson Coors Beverage Co.
- Carlsberg AS
- Suntory Holdings Ltd
- Campari Group
- GALLO
- Tsingtao Brewery Co. Ltd.
- Remy Cointreau SA
- Boston Beer Company Inc.
- Sapporo Holdings Ltd
- San Miguel Corporation
Key Opportunities for Market Participants
The opportunity comparison focuses on routes connecting alcoholic-beverage suppliers with reachable hospitality, retail and winery customers. A 2025 survey of wineries across 47 countries found that tourism-related activities accounted for around one-quarter of respondents' revenue. That commercial contact gives wine producers a reason to connect visitor experiences with product selling, while other channel opportunities depend on a workable route into eligible accounts.
Market Opportunities Table of Alcoholic Beverages Market
| Opportunity | Why now | Buyer / lead segment | Recommended play | Main barrier | Likely beneficiaries |
|---|---|---|---|---|---|
| Qualifying draught-alcohol supply | Duty relief for qualifying alcohol below 8.5% ABV in containers of at least 20 liters | Hospitality buyers of qualifying draught drinks | Supply eligible containers designed for a qualifying dispensing system | Sales needed to justify the draught-serving setup | Qualifying producers, importers and duty-suspense warehouse operators releasing for consumption |
| Ontario retail product placement | LCBO's exclusive-wholesaler role from April 1, 2026 covers thousands of points of sale | Retail customers served through LCBO or its authorized wholesale routes | Build wholesale access, using listing or Direct Delivery authorization for applicable unlisted domestic beer supplied to LCBO Convenience Outlets | Listing or authorization gate for that LCO beer supply | LCBO and qualifying domestic brewers |
| Wine purchases following winery tastings | Chapel Down launched The Hythe and its Kit's Coty experience at Tenterden on June 15, 2026 | Winery visitors participating in tastings | Link booked tastings to on-site wine purchases | The Hythe room accommodates up to 20 guests | Chapel Down |
| Source: Mordor Intelligence | |||||
The central winery opening is to sell wine through the tasting experience. The Hythe's guest limit makes revenue per session a more useful target than visitor-count growth alone. Connecting the tasting with take-home bottles directs that limited hospitality capacity toward alcoholic-beverage sales.
Recent Industry Developments in Alcoholic Beverages Market
- Sep 2026: Through a newly formed affiliate, Saothair Capital Partners acquired FIFCO USA from Heineken NV subsidiary Distribuidora La Florida. The US beer and contract brewer resumed its North American Breweries name.
- May 2026: Damm acquired Old Speckled Hen, a British premium ale brand previously owned by Greene King, expanding its United Kingdom beer portfolio.
- Jan 2026: Heineken NV completed its acquisition of FIFCO's beverage and retail businesses in Central America after receiving all regulatory and corporate approvals. The transaction included the Imperial beer brand and an established retail network.
Alcoholic Beverages Market Report Scope and Research Methodology
Market Definition and Coverage
The alcoholic beverages market measures annual spending on alcoholic drinks sold globally. It covers on-trade and off-trade sales across Global markets, classified by product, end user, package and geography.
Scope exclusions: Illicit alcohol, home-brewed or homemade beverages, and non-alcoholic drinks are excluded.
Segments Covered in This Report
- By Product Type
- Beer
- Ale Beer
- Lager
- Non/Low-Alcohol Beer
- Others Beer Types
- Wine
- Fortified Wine
- Still Wine
- Sparkling Wine
- Others Wine Types
- Spirits
- Brandy and Cognac
- Liqueur
- Rum
- Tequilla and Mezcel
- Whiskies
- White Spirits
- Other Spirit Types
- Others
- Beer
- By End User
- Male
- Female
- By Packaging Type
- Bottles
- Cans
- Others
- By Distribution Channel
- On-Trade
- Off-Trade
- Specialty/Liquor Stores
- Others Off Trade Channels
- By Geography
- North America
- United States
- Canada
- Mexico
- Rest of North America
- Europe
- Germany
- France
- United Kingdom
- Netherlands
- Italy
- Sweden
- Poland
- Belgium
- Spain
- Rest of Europe
- Asia-Pacific
- China
- India
- Japan
- Australia
- South Korea
- Indonesia
- Thailand
- Singapore
- Rest of Asia-Pacific
- South America
- Brazil
- Argentina
- Chile
- Peru
- Colombia
- Rest of South America
- Middle East and Africa
- United Arab Emirates
- South Africa
- Nigeria
- Saudi Arabia
- Morocco
- Turkey
- Rest of Middle East and Africa
- North America
Data Sources, Market Sizing, and Validation
Desk Research
Public evidence can establish market context and independent checks, such as the World Health Organization's global alcohol report for recorded consumption and policy indicators, its alcohol tax report for country tax and price measures, FAOSTAT food balance sheets for supply and use, Eurostat production statistics for beer, and the International Organisation of Vine and Wine's annual production, consumption and trade series. These sources measure distinct parts of the market, so their units and boundaries guide their use as demand, supply, price and product-mix checks rather than as interchangeable spending totals.
Company annual reports, regulatory filings, investor materials and reputable business press can add reported sales, channel exposure, product mix and acquisition context for major producers and retailers. These named sources are illustrative rather than exhaustive, and additional sources inform collection, validation and clarification.
Primary Interviews and Surveys
Structured interviews and surveys can include beverage producers, brand and category managers, retail and hospitality buyers, distributors, and packaging or finance leaders across APAC, EMEA and the Americas. Their market-level and product-level views can test secondary evidence on consumer selling prices, channel coverage, product mix, regional demand and the treatment of taxes or low-alcohol products. Where published series conflict or leave a gap, analysts can clarify definitions with respondents and triangulate their explanations against filings, official statistics and channel evidence before incorporating an assumption.
Distribution of primary research fieldwork respondents
| Company type | Respondent position | Region |
|---|---|---|
| Top tier: 35% | CXOs: 20% | APAC: 38% |
| Mid tier: 45% | Functional/Unit leaders: 35% | EMEA: 32% |
| Smaller Players: 20% | Managers: 45% | Americas: 30% |
Market-Sizing & Forecasting
The model starts with a top-down estimate of global annual spending on legally sold alcoholic drinks at the final consumer transaction, expressed in USD, then cross-checks selected regions and channels with sampled average selling prices times volumes and supplier or retailer roll-ups. The analyst can relate spending to 4 indicators: recorded alcohol consumption and beverage mix, population and income growth, consumer-price and excise-tax changes, and production or trade trends. These series help distinguish changes in drinking volume from price and product mix. Multivariate regression can project the 2027-2032 value path from these indicators, with scenario adjustments where policy or channel changes break historical relationships, while category, end-user, packaging, channel and regional shares are built from official splits, company disclosures and respondent checks and reconciled to the total. For gaps in regional or segment evidence, analysts can use comparable-country or channel proxies, disclose the working assumption internally, and test it against selective bottom-up checks, while interviews can challenge the variable-level outlook and explain inconsistencies before assumptions are retained.
Data Validation & Update Cycle
Analysts triangulate the spending estimate against independent consumption, production, trade, tax, company-sales and channel signals, checking that each signal measures a compatible year, geography, unit and transaction point. They investigate anomalies and material variance between the top-down view and selective channel or supplier checks, resolve definitional or currency issues, and route changes through source review, model review and senior analyst review before sign-off, with re-contact triggered when a respondent's definition, estimate or explanation conflicts with documentary evidence. The evidence and forecast are refreshed annually, reassessed between cycles after material policy, tax, trade or market events, and reviewed in a fresh pre-delivery pass.
Mordor Intelligence's Alcoholic Beverages Market Size Compared Against Other Published Estimates
The alcoholic beverages market measures annual spending on alcoholic drinks sold globally. For gaps in regional or segment evidence, analysts can use comparable-country or channel proxies, disclose the working assumption internally, and test it against selective bottom-up checks, while interviews can challenge the variable-level outlook and explain inconsistencies before assumptions are retained.
Key Gap Drivers are addressed through a consistent transaction boundary, market-specific demand inputs and cross-checks across the study. Analysts triangulate the spending estimate against independent consumption, production, trade, tax, company-sales and channel signals, checking that each signal measures a compatible year, geography, unit and transaction point.
Benchmark comparison
| Source | Market Size | Gaps in Research Methodology |
|---|---|---|
| Mordor Intelligence | USD 1.96 T (2027) | |
| Global Market Research Publisher A | USD 551.8 B (2025) | At its 2025 base, this estimate is 71.8% below this report's 2027 value of USD 1.96 T, 2 years later. The estimate uses manufacturer factory-gate sales, which excludes value added between producer sale and final consumer spending. |
| Global Market Research Publisher B | USD 1.65 T (2025) | At its 2025 base, this estimate is 15.8% below this report's 2027 value of USD 1.96 T, 2 years later. The estimate uses an earlier base year and its published forecast follows an upward path, contributing to a lower comparison with a later-year value. |
Mordor Intelligence ties the estimate to the study’s defined coverage and demand model. Analysts triangulate the spending estimate against independent consumption, production, trade, tax, company-sales and channel signals, checking that each signal measures a compatible year, geography, unit and transaction point.
Key Questions Answered in the Report
What is the alcoholic beverages market size and growth outlook?
It is expected to reach USD 1.96 trillion in 2027 and USD 2.27 trillion by 2032, at a 3.02% CAGR over 2027-2032.
How does tourism support demand for alcoholic drinks?
Growing travel expands opportunities for licensed hospitality drink sales. UN Tourism estimated 1.52 billion international tourist arrivals, or overnight visitors, worldwide in 2025, up 4% from 2024.
Which alcoholic-drink product type leads sales?
Beer held 43.25% of revenue in 2026. Spirits are forecast to grow fastest at 3.2% CAGR over 2027-2032.
Which companies are major alcoholic-drink producers?
Major producers include Anheuser-Busch InBev SA/NV, Heineken NV, Diageo PLC, Constellation Brands Inc. and Pernod Ricard SA.
What could constrain the outlook for alcoholic-drink sales?
Tax costs can pressure supplier margins or buyer prices. UK alcohol duty rates rose 3.66% from February 1, 2026.
Which region leads alcoholic-drink revenue, and where is growth fastest?
Asia-Pacific led with 29.36% of revenue in 2026. The Middle East and Africa region is forecast to grow fastest at 4.5% CAGR over 2027-2032.