Non-alcoholic Beverages Market Size and Share
Market Overview
| Study Period | 2021 - 2031 |
|---|---|
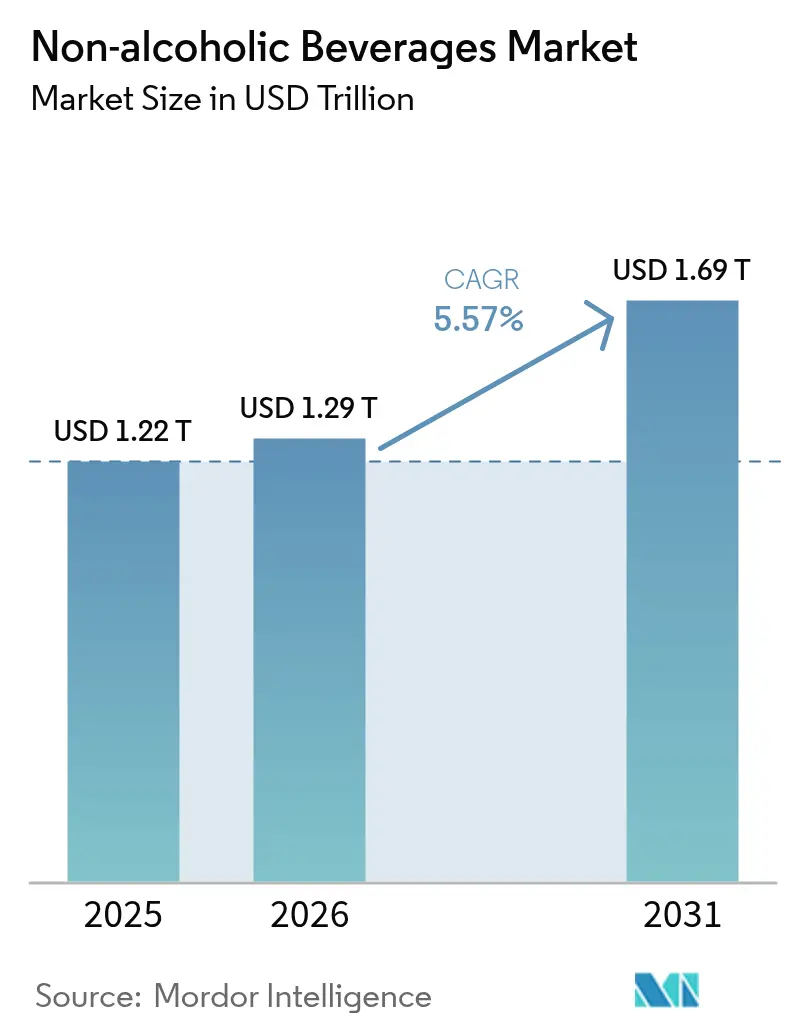
| Market Size (2026) | USD 1.29 Trillion |
| Market Size (2031) | USD 1.69 Trillion |
| Growth Rate (2026 - 2031) | 5.57% CAGR |
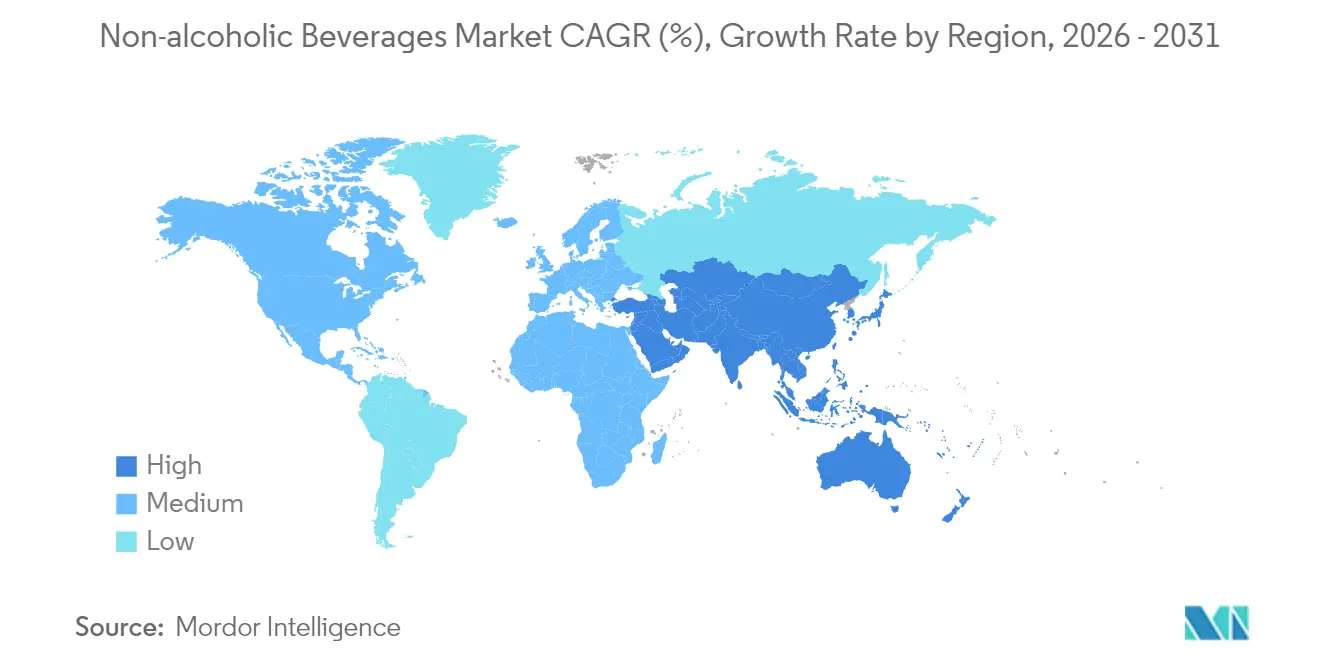
| Fastest Growing Market | Asia Pacific |
| Largest Market | North America |
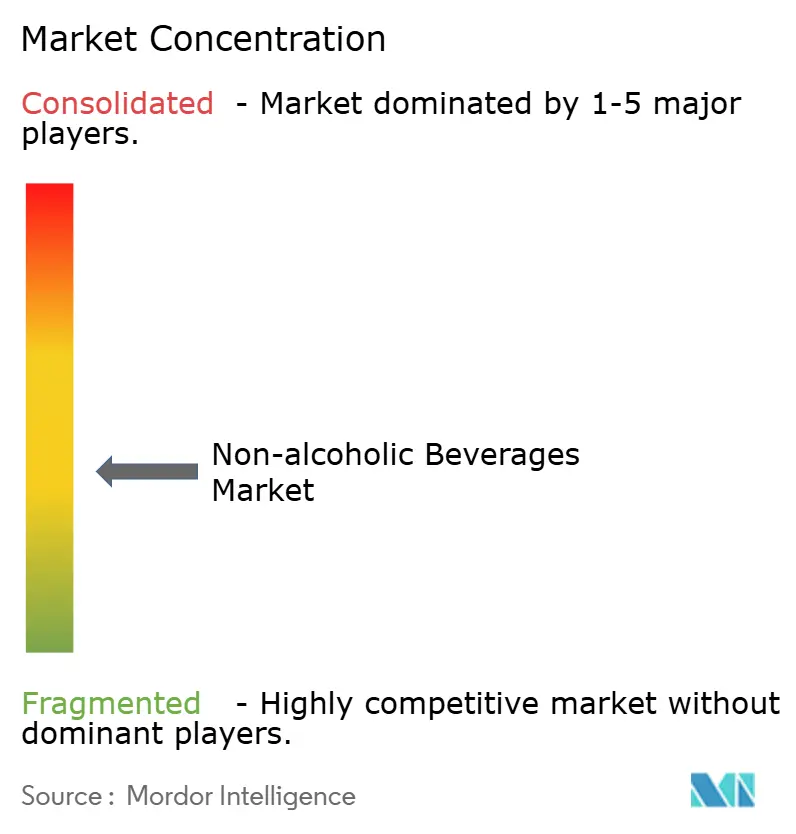
| Market Concentration | Medium |
Major Players
*Disclaimer: Major Players sorted in no particular order Image © Mordor Intelligence. Reuse requires attribution under CC BY 4.0. |
|
Non-alcoholic Beverages Market Analysis by Mordor Intelligence
The non-alcoholic beverages market size is expected to grow from USD 1.22 trillion in 2025 to USD 1.29 trillion in 2026 and is forecast to reach USD 1.69 trillion by 2031 at 5.57% CAGR over 2026-2031. This growth trajectory is driven by a combination of increasing consumer health consciousness, regulatory approvals favoring natural ingredients, and rapid product innovation across nine distinct beverage categories. Energy drinks and plant-based alternatives are emerging as the fastest-growing segments, as consumers increasingly prioritize beverages offering functional health benefits. Simultaneously, traditional carbonated beverages are expanding their market presence through the introduction of premium, smaller-packaged products designed to cater to evolving consumer preferences. Regulatory developments are further accelerating market growth. The competitive landscape remains intense, with established global players striving to maintain their market dominance while contending with agile, innovative disruptors. This dynamic environment is also characterized by ongoing consolidation activities aimed at strengthening market positions. From a geographical perspective, North America continues to hold the largest market share, driven by mature consumer markets and high disposable incomes.
Key Report Takeaways
- By product type, carbonates led with 33.10% revenue share in 2025; plant-based milk is forecast to expand at a 5.95% CAGR through 2031.
- By packaging type, PET and glass bottles held 71.55% of the non-alcoholic beverages market share in 2025; tetra pak is advancing at a 5.74% CAGR through 2031.
- By category, conventional beverages accounted for 82.10% share of the non-alcoholic beverages market size in 2025, while free-from is set to grow at a 6.18% CAGR between 2026-2031.
- By distribution channel, off-trade controlled 66.70% share in 2025; on-trade is projected to recover at a 6.63% CAGR through 2031.
- By geography, North America represented 26.20% of the non-alcoholic beverages market share in 2025, and Asia-Pacific is poised to register a 7.02% CAGR to 2031.
Note: Market size and forecast figures in this report are generated using Mordor Intelligence’s proprietary estimation framework, updated with the latest available data and insights as of 2026.
Global Non-alcoholic Beverages Market Trends and Insights
Drivers Impact Analysis*
| DRIVER | (~) % IMPACT ON CAGR FORECAST | GEOGRAPHIC RELEVANCE | IMPACT TIMELINE |
|---|---|---|---|
| Surge in demand for functional and fortified beverages | +1.2% | Global, with Asia-Pacific leading adoption | Medium term (2-4 years) |
| Product innovation in terms of flavor and ingredients | +0.8% | North America and Europe core markets | Short term (≤ 2 years) |
| Strong influence of social media and celebrity endorsement | +0.6% | Global, youth demographics focus | Short term (≤ 2 years) |
| Growing fitness culture and sports participation rate | +0.9% | North America, Europe, Urban Asia-Pacific | Medium term (2-4 years) |
| Rising health consciousness among consumers boosts demand. | +1.1% | Global, developed markets leading | Long term (≥ 4 years) |
| Expansion of e-commerce platforms enhances product accessibility. | +0.7% | Asia-Pacific core, spill-over to global | Medium term (2-4 years) |
| Source: Mordor Intelligence | |||
Surge in demand for functional and fortified beverages
Functional beverages, which were once considered a niche category, have now transitioned into the mainstream market, driven by growing consumer demand for products that offer health benefits such as enhanced immunity, improved cognitive function, and better gut health. Consumers are increasingly willing to pay premium prices for these value-added offerings. The Asia-Pacific region is leading this shift, with Thailand's implementation of a sugar-tax framework encouraging consumers to opt for low-sugar, nutrient-dense alternatives. In response, brands are innovating by incorporating ingredients like electrolytes, probiotics, and adaptogens into product categories such as waters and teas. Additionally, the recent FDA guidance on plant-based milk labeling has provided clarity on nutrient disclosure requirements, reducing the risks associated with product innovation in this segment. Furthermore, the consumers identify reduced-sugar options as a key factor influencing their purchasing decisions, indicating that this trend is poised for sustained growth rather than being a short-term phenomenon.
Product innovation in terms of flavor and ingredients
The flavor innovation landscape is intensifying. The FDA’s 2024 ban on brominated vegetable oil has necessitated product reformulations, while the anticipated 2025 approval of butterfly-pea and galdieria blues is expected to unlock new opportunities for natural formulations with enhanced visual appeal. European companies are leveraging botanical, spice, and hybrid fruit profiles to establish premium positioning. Emerging flavor combinations (e.g., exotic fruits, herbs, spices) are tailored to meet specific consumer preferences or moods, offering a sense of personalization. In mature markets such as carbonated soft drinks and iced teas, innovation in flavors and ingredients is critical for differentiation. Regular flavor launches and seasonal editions help maintain portfolio relevance and encourage repeat purchases. For instance, in February 2025, Keurig Dr Pepper introduced bold new flavors across its U.S. cold beverages portfolio, including Dr Pepper Blackberry as a permanent addition, combining the brand’s signature 23 flavors with a blackberry twist.
Strong influence of social media and celebrity endorsement
Digital marketing is redefining beverage discovery and purchasing patterns, particularly among younger consumers who increasingly engage with content on social platforms instead of traditional media. Celebrity endorsements have emerged as a key strategy, exemplified by Pernod Ricard's 'Drink More Water' campaign, which achieved a reach of 400 million online and 9 million through on-ground activations across 60 countries, highlighting the scalability of such initiatives. Social media's influence extends beyond brand awareness, driving direct-to-consumer sales and enabling subscription-based models that bypass traditional retail channels. While energy drinks and functional beverages derive significant benefits from lifestyle-driven messaging that aligns consumption with aspirational behaviors, the impact varies across product categories. Regulatory scrutiny is intensifying as governments address the influence of social media on youth consumption habits.
Growing fitness culture and sports participation rate
Sports nutrition is increasingly entering the mainstream beverage market as consumers adopt active lifestyles. Athletes are embracing plant-based proteins, supported by research showing their efficacy comparable to animal proteins. The International Society of Sports Nutrition highlights caffeine and carbohydrates as key ergogenic nutrients in performance beverages, while advising against their use by children. Market growth is driven by traditional sports drinks adding functional ingredients and energy drinks targeting fitness consumers. North America and Europe lead due to higher sports participation and disposable incomes, while urban Asia-Pacific sees rapid adoption influenced by social media's impact on fitness culture. In 2024, the Japan Sports Agency reported that 13.7% of fitness club users were men, while 17.5% were women in Japan [1]Source: Japan Sports Agency, "Opinion survey on sports participation 2024", mext.go.jp. This trend is driving premium pricing strategies, as consumers are willing to pay more for beverages marketed as performance enhancers rather than standard refreshment options. Distribution channels are also evolving, with fitness centers and sports venues becoming critical platforms for brand engagement and loyalty-building, surpassing traditional retail outlets.
Restraints Impact Analysis*
| RESTRAINT | (~) % IMPACT ON CAGR FORECAST | GEOGRAPHIC RELEVANCE | IMPACT TIMELINE |
|---|---|---|---|
| Health concerns over excessive use of sugar and other chemical ingredients | -0.9% | Global, developed markets leading | Long term (≥ 4 years) |
| Growing prominence of healthy and safe options | -0.6% | Global, emerging markets most affected | Medium term (2-4 years) |
| High production costs for premium non-alcoholic beverages | -0.6% | Global, developed markets leading | Long term (≥ 4 years) |
| Limited shelf life of certain non-alcoholic products | -0.4% | Global, emerging markets most affected | Medium term (2-4 years) |
| Source: Mordor Intelligence | |||
Health concerns over excessive use of sugar and other chemical ingredients
As regulatory pressures escalate through taxation and marketing restrictions, businesses face formulation challenges in aligning consumer taste preferences with health-focused product positioning. The WHO's analysis of sugar-sweetened beverage taxation in Saudi Arabia and the UAE highlights the effectiveness of such measures. For instance, a 50% excise tax could reduce childhood overweight prevalence in Saudi Arabia from 38.2% to 34.4% and in the United Arab Emirates from 37.0% to 34.6% by 2030 [2]Source: World Health Organization, “Excise Taxes and Childhood Obesity Ranges,” who.int . Regulatory scrutiny now includes preservatives and additives, with the FDA updating post-market review processes, impacting beverage formulations. Consumer awareness, driven by social media, increases reputational risks for brands linked to controversial ingredients. While these measures mainly affect developed markets, emerging economies are adopting similar policies due to urbanization and rising non-communicable diseases. Companies are reformulating products with natural sweeteners and functional ingredients, though these alternatives often raise costs and alter taste, affecting consumer acceptance.
High production costs for premium non-alcoholic beverages
Cost pressures stemming from premium ingredient sourcing and specialized processing requirements limit market penetration, particularly in price-sensitive segments and emerging economies. Tetra Pak's Factory Sustainable Solutions initiative seeks to optimize operational costs through energy and water efficiency. However, the significant capital investment required for implementation creates an advantage for larger manufacturers. Packaging sustainability regulations, such as the EU's mandate for 10% reusable beverage packaging by 2030, introduce additional operational complexities and costs, necessitating investments in collection and cleaning infrastructure. Rising labor and energy costs further strain manufacturing operations, while geopolitical tensions disrupt supply chains, impacting ingredient availability and pricing. These challenges disproportionately affect functional beverages and organic segments, which rely on specialized ingredients and operate with smaller production volumes, limiting their ability to achieve economies of scale. Regional variations reflect local cost structures, with emerging markets facing added obstacles such as currency fluctuations and infrastructure deficiencies, which drive up logistics costs.
*Our forecasts treat driver/restraint impacts as directional, not additive. The impact forecasts reflect baseline growth, mix effects, and variable interactions.
Segment Analysis
By Product Type: Carbonates Face Plant-Based Disruption
In 2025, carbonated soft drinks commanded a dominant 33.10% share of the non-alcoholic beverage market. Yet, as consumers gravitate towards low-sugar, functional alternatives, this segment grapples with challenges. In response, brands are reformulating and innovating, pivoting towards healthier options. Energy drinks, sharing a consumer base with carbonated beverages, thrive on bold flavors, functional claims, and a premium market stance. Juices, however, are waning in popularity, sidelined by rising sugar concerns and a shift towards whole fruits. Bottled water stands resilient, buoyed by premiumization trends and the emergence of functional variants like alkaline and electrolyte-infused options.
Plant-based milk is on a growth trajectory, projected to expand at a robust CAGR of 5.95% through 2031. This surge is fueled by rising lactose intolerance, heightened sustainability awareness, and improvements in flavor and nutrition. Anticipated by June 2025, the FDA’s draft guidance on plant-based milk alternatives promises regulatory clarity, potentially amplifying market confidence and spurring innovation. Beyond milk, dairy alternatives like oat- and almond-based beverages are gaining traction. Ready-to-drink (RTD) tea and coffee are seizing the spotlight, driven by younger consumers' cravings for convenience and caffeine, marking a departure from traditional hot drinks.


By Packaging Type: Sustainability Drives Tetra Innovation
In 2025, PET and glass bottles together commanded a dominant 71.55% share of the beverage packaging market, driven by strong consumer preference for product visibility, shelf appeal, and recyclability. PET remains popular for its cost-effectiveness and light weight, while glass holds ground in premium and health-positioned beverages due to its inert properties and perception of purity. Aluminum cans continue to register steady growth, especially in the energy drink and carbonated beverage segments, where durability, branding potential, and infinite recyclability align with both manufacturer and consumer priorities. Regulatory shifts, such as Singapore's Beverage Container Return Scheme mandating producer responsibility by 2026, highlight growing policy support for packaging with robust recycling ecosystems.
Tetra pak is emerging as the fastest-growing format, projected to grow at a CAGR of 5.74%, buoyed by its sustainability credentials and ability to facilitate ambient storage. This reduces cold chain dependence, cutting logistics costs and environmental impactckey advantages for both manufacturers and retailers. The brand’s Factory Sustainable Solutions initiative furthers its value proposition by helping beverage producers meet energy and water efficiency goals. Other formats like pouches and specialty containers cater to niche applications where portability or barrier protection is critical; however, their broader market adoption is limited by low consumer familiarity and fragmented recycling infrastructure.
By Category: Free-From Accelerates Health Positioning
In 2025, conventional beverages commanded an 82.10% market share, bolstered by ingrained consumer habits, widespread availability, and competitive pricing. Despite heightened scrutiny over ingredients like added sugars, artificial sweeteners, and preservatives, these products still resonate with a diverse audience. Yet, this dominance faces challenges from escalating health concerns. Regulatory moves, such as the FDA's 2024 prohibition on brominated vegetable oil and the green light for natural color additives, underscore a significant shift towards cleaner formulations and safer ingredients in mainstream beverages.
On the other hand, "free-from" beverages are carving out a notable niche, growing at a CAGR of 6.18%. Health-conscious consumers are gravitating towards these offerings, seeking products devoid of sugar, artificial components, and allergens. A significant driver for this trend is the rising incidence of chronic ailments, notably diabetes. In 2024, the International Diabetes Federation highlighted that around 589 million adults aged 20–79 were grappling with diabetes, largely attributed to excessive sugar intake . This health challenge is fueling the demand for reduced-sugar and sugar-free options, positioning "free-from" beverages as a crucial answer. Younger consumers, in particular, are showing a readiness to invest more in health-centric products.
By Distribution Channel: On-Trade Recovery Signals Normalization
In 2025, the off-trade segment captured a commanding 66.70% share of the beverage distribution market, fueled by its affordability, convenience, and the rapid rise of online retail. Supermarkets and hypermarkets dominate as primary retail outlets, owing to their extensive product range, strategic in-store promotions, and enticing bundling offers. Yet, they're facing mounting competition from convenience stores and e-commerce platforms, which appeal to time-sensitive consumers with curated selections and efficient delivery. Online retail stands out, harnessing subscription models, direct-to-consumer strategies, and comprehensive product content.
On the other hand, the on-trade segment is on the upswing, boasting a projected CAGR of 6.63%, indicative of a robust post-pandemic recovery in foodservice consumption. The revival of bars, restaurants, and entertainment venues underscores a renewed consumer enthusiasm for social dining. This channel is becoming the go-to for launching premium beverages, owing to its heightened engagement potential and superior margins.
Geography Analysis
In 2025, North America accounted for a 26.20% share of the non-alcoholic beverages market. This performance is driven by high per-capita expenditure and the rapid adoption of Free-From, functional, and plant-based product lines. E-commerce penetration has reached double digits, with omnichannel retailers integrating curbside pickup and app-based loyalty programs. This strategy supports premium pricing resilience despite inflationary pressures. A well-established cold-chain infrastructure underpins the growth of RTD coffee and dairy alternatives, while localized canning investments enhance supply chain efficiency by reducing lead times.
Asia-Pacific, projected to grow at a CAGR of 7.02%, is emerging as the primary growth driver for the non-alcoholic beverages market. Increasing urbanization and rising disposable incomes are shifting consumer preferences from boiled water and home-brewed tea to branded RTDs. Government initiatives, such as sugar taxes and nutrition-label mandates, are accelerating the transition to reduced-sugar carbonates and fortified waters. While China and India dominate in terms of volume, Japan and South Korea are developing high-value segments, including amino-acid sports drinks and functional lattes. Thailand’s excise reforms highlight the role of fiscal policies in shaping category dynamics.
Europe combines regulatory leadership with a mature market landscape. The Union of European Beverage Associations is targeting a 10% reduction in sugar content by 2025, prompting brands to adopt alternatives such as stevia and monk-fruit sweeteners. Sustainability initiatives are gaining traction, with Scandinavian supermarkets piloting refill stations that could potentially expand across the continent. South America exhibits varied market dynamics. Inflation-driven price sensitivity sustains demand for carbonated multi-packs, while urban millennials are increasingly exploring energy drinks that offer mood and focus benefits.

Competitive Landscape
The non-alcoholic beverages market is moderately fragmented, due to the large number of companies that manufacture functional beverages. Some major players in the market, such as PepsiCo Inc., The Coca-Cola Company, Danone SA, Red Bull GmbH, and Nestlé SA, offer consumers a wide range of carbonated and functional beverages. Expansions and new agreements/partnership strategies remain the most popular among key global players in the non-alcoholic drinks industry.
Leading corporations such as Coca-Cola, PepsiCo, and Nestlé are capitalizing on their extensive bottling infrastructure, robust marketing capabilities, and diversified product portfolios. To mitigate potential market share erosion, these companies are prioritizing investments in zero-sugar product lines, plant-based innovations, and direct-to-consumer platforms. In the current competitive landscape, reformulation flexibility and sustainability strategies are considered baseline requirements rather than unique differentiators.
At the same time, challenger brands are driving market fragmentation. Plant-based startups, emphasizing clean-label and allergen-free products, are utilizing e-commerce analytics to validate product performance and secure retail shelf space before expanding into physical stores. Energy drink disruptors are leveraging gaming culture to achieve international growth without relying on traditional media advertising. Additionally, the integration of technologies such as QR-code traceability, AI-driven demand forecasting, and digital twins is transforming cost structures and innovation cycles, creating a competitive edge for data-driven organizations.
Non-alcoholic Beverages Industry Leaders
-
PepsiCo, Inc.
-
The Coca-Cola Company
-
Danone S.A.
-
Nestlé S.A.
-
Red Bull GmbH
- *Disclaimer: Major Players sorted in no particular order

Recent Industry Developments
- June 2025: Red Bull launched the Lilac Edition, a seasonal energy drink featuring a blend of pink grapefruit and floral flavors, now available in the United States for a limited period.
- April 2025: Tropicana launched Fresh and Light, a new line of expertly blended fruit juice drinks, offering a refreshing taste with 30% less sugar, naturally.
- February 2025: Keurig Dr Pepper introduced bold new flavors across its U.S. cold beverages portfolio, including Dr Pepper Blackberry as a permanent addition, combining the brand’s signature 23 flavors with a blackberry twist.
- January 2025: Carlsberg Group acquired Britvic plc, representing a strategic consolidation within the non-alcoholic beverages sector.


Global Non-alcoholic Beverages Market Report Scope
The non-alcoholic beverages market is segmented by type, distribution channel, and geography. By type, the market is segmented into carbonated and non-carbonated beverages. The non-carbonated beverages are further segmented into fruit and vegetable juices, functional drinks, ready-to-drink tea and coffee, bottled water, and other non-carbonated beverages. By distribution channel, the market is segmented into supermarkets/hypermarkets, convenience stores, online sales channels, and other channels. By geography, the market is segmented into North America, Europe, Asia-Pacific, South America, and Middle East & Africa. For each segment, the market sizing and forecasts have been done based on value (in USD billion).
| Energy Drinks |
| Sports Drinks |
| Juices |
| Bottled Water |
| Carbonated Soft Drinks |
| RTD Tea and Coffee |
| Dairy Alternative Drinks |
| Dairy Based Beverages |
| Other Product Types |
| PET/Glass Bottles |
| Cans |
| Tetra Pack |
| Others |
| Conventional |
| Free-From |
| On-Trade | |
| Off-Trade | Supermarkets/Hypermarkets |
| Convenience/Grocery Stores | |
| Online Retail Stores | |
| Others Distribution Channel |
| North America | United States |
| Canada | |
| Mexico | |
| Rest of North America | |
| Europe | Germany |
| France | |
| United Kingdom | |
| Spain | |
| Netherlands | |
| Italy | |
| Sweden | |
| Norway | |
| Russia | |
| Rest of Europe | |
| Asia-Pacific | China |
| India | |
| Japan | |
| Australia | |
| South Korea | |
| Vietnam | |
| Indonesia | |
| Rest of Asia-Pacific | |
| South America | Brazil |
| Argentina | |
| Chile | |
| Rest of South America | |
| Middle East and Africa | United Arab Emirates |
| Saudi Arabia | |
| South Africa | |
| Nigeria | |
| Rest of Middle East and Africa |
| By Product Type | Energy Drinks | |
| Sports Drinks | ||
| Juices | ||
| Bottled Water | ||
| Carbonated Soft Drinks | ||
| RTD Tea and Coffee | ||
| Dairy Alternative Drinks | ||
| Dairy Based Beverages | ||
| Other Product Types | ||
| By Packaging Type | PET/Glass Bottles | |
| Cans | ||
| Tetra Pack | ||
| Others | ||
| By Category | Conventional | |
| Free-From | ||
| By Distribution Channel | On-Trade | |
| Off-Trade | Supermarkets/Hypermarkets | |
| Convenience/Grocery Stores | ||
| Online Retail Stores | ||
| Others Distribution Channel | ||
| By Geography | North America | United States |
| Canada | ||
| Mexico | ||
| Rest of North America | ||
| Europe | Germany | |
| France | ||
| United Kingdom | ||
| Spain | ||
| Netherlands | ||
| Italy | ||
| Sweden | ||
| Norway | ||
| Russia | ||
| Rest of Europe | ||
| Asia-Pacific | China | |
| India | ||
| Japan | ||
| Australia | ||
| South Korea | ||
| Vietnam | ||
| Indonesia | ||
| Rest of Asia-Pacific | ||
| South America | Brazil | |
| Argentina | ||
| Chile | ||
| Rest of South America | ||
| Middle East and Africa | United Arab Emirates | |
| Saudi Arabia | ||
| South Africa | ||
| Nigeria | ||
| Rest of Middle East and Africa | ||


Key Questions Answered in the Report
What is the current Non-Alcoholic Beverages market size?
The non-alcoholic Beverages market size stands at USD 1.29 trillion in 2026 and is forecast to reach USD 1.69 trillion by 2031 at a 5.57% CAGR.
Which region will grow fastest through 2031?
Asia-Pacific is expected to record a 7.02% CAGR, the quickest of all regions, driven by urbanization, rising incomes, and regulatory nudges toward healthier drinks.
Which product segment is expanding the most rapidly?
Plant-based milk alternatives are projected to grow at a 5.95% CAGR, outpacing carbonates and juices as taste and nutritional profiles improve.
How are regulations influencing ingredient choices?
Policies such as the FDA’s ban on brominated vegetable oil and approvals for natural blue colorants push manufacturers toward cleaner, plant-derived ingredients.
Page last updated on:


