
Market Overview
| Study Period | 2021 - 2031 |
|---|---|
| Market Size (2026) | USD 0.85 Trillion |
| Market Size (2031) | USD 1.09 Trillion |
| Growth Rate (2026 - 2031) | 5.16% CAGR |
| Fastest Growing Market | Asia Pacific |
| Largest Market | Asia Pacific |
| Market Concentration | High |
Major Players *Disclaimer: Major Players sorted in no particular order Image © Mordor Intelligence. Reuse requires attribution under CC BY 4.0. | |
Beer Market Analysis by Mordor Intelligence
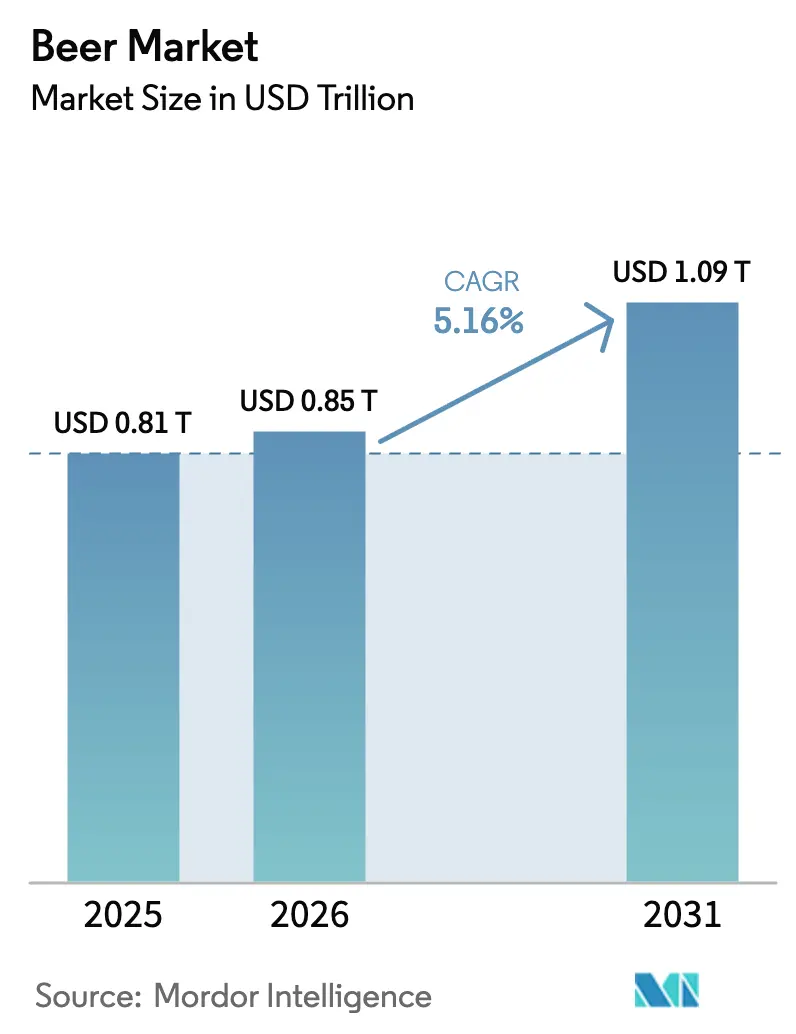
The beer market size was valued at USD 0.81 trillion in 2025 and estimated to grow from USD 0.85 trillion in 2026 to reach USD 1.09 trillion by 2031, reflecting a 5.16% CAGR during the forecast period. Market growth is supported by premiumization, portfolio diversification into no- and low-alcohol variants, and geographic expansion in Asia-Pacific and select African markets. Large multinational brewers strengthen margins through direct-to-retailer channels, advanced automation, and regenerative-agriculture initiatives despite raw-material cost pressures. Non-alcoholic beers, craft styles, and premium lagers continue to attract younger consumers who are moderating alcohol intake but remain willing to pay for perceived quality. Sustainability-focused investments, including renewable energy adoption, returnable glass, and higher-recycled-content aluminum cans, enhance brand positioning among environmentally conscious consumers and institutional investors, further bolstering the global beer industry.
Key Report Takeaways
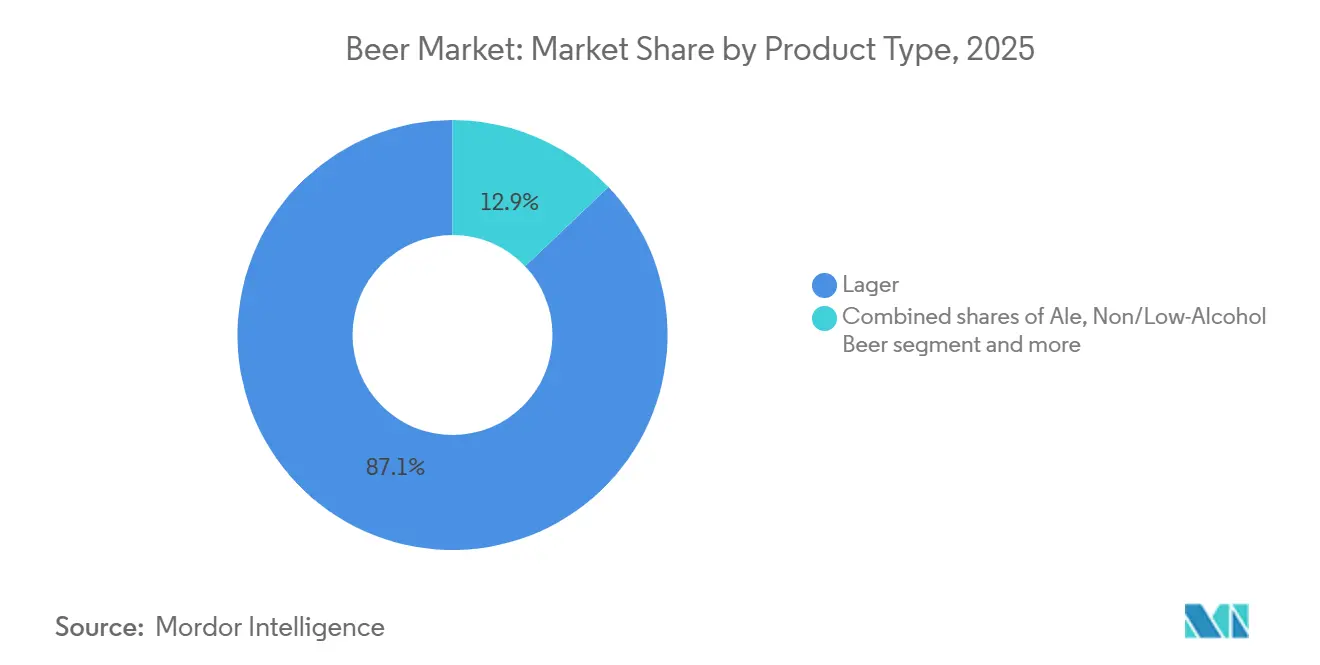
- By product type, lager led with 87.09% of beer market share in 2025; non/low alcohol is projected to expand at a 5.30% CAGR through 2031 in the beer market.
- By category, the standard segment held 79.32% of the beer market in 2025, while premium beer volume is poised for a 5.45% CAGR to 2031.
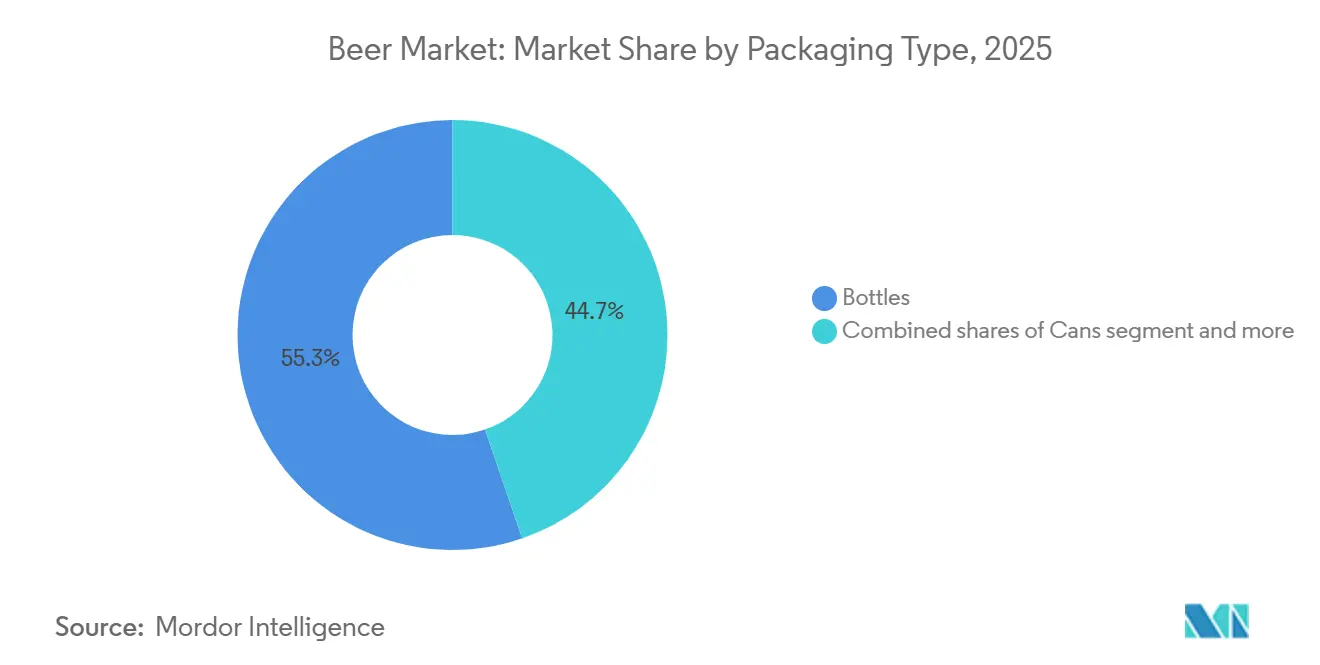
- By packaging type, bottles accounted for 55.26% of the market in 2025; Cans post the fastest 5.60% CAGR on sustainability and convenience.
- By distribution channel, on-trade venues captured 57.45% revenue in 2025; off-trade is growing at a 5.71% CAGR as at-home occasions rise.
- By geography, Asia-Pacific accounts for 30.12% of global revenue in 2025 and remains the fastest-growing region at 5.40% CAGR.
Note: Market size and forecast figures in this report are generated using Mordor Intelligence’s proprietary estimation framework, updated with the latest available data and insights as of January 2026.
Global Beer Market Trends and Insights
Drivers Impact Analysis*
| Driver | (~) % Impact on CAGR Forecast | Geographic Relevance | Impact Timeline |
|---|---|---|---|
| Growing Number of Breweries Leading to High Prevalence of Craft Beer | +0.8% | North America, Europe, Australia | Medium term (2-4 years) |
| Growing Tourism and Hospitality Impact Positive Growth | +0.60% | Europe, Middle East, Asia-Pacific tourism hubs | Short term (≤ 2 years) |
| Product Innovation in Terms of Ingredient and Alcohol Content | +0.90% | Global, with early adoption in North America and Europe | Medium term (2-4 years) |
| Health Conscious Consumer Accelerating Demand For Gluten Free Beer | +0.40% | North America, Europe, Australia | Long term (≥ 4 years) |
| Rising Focus on Sustainable and Ethical Beer Production | +0.70% | Global, with leadership from Europe and North America | Long term (≥ 4 years) |
| Brewing Industry's Technological Evolution | +1.0% | Global, with early adoption in developed markets | Medium term (2-4 years) |
| Source: Mordor Intelligence | |||


Growing Number of Breweries Leading to High Prevalence of Craft Beer
The rapid proliferation of craft breweries continues to reshape market dynamics, intensifying competition for shelf space and encouraging consolidation strategies among established players. In the United States, more than 9,922 craft breweries were operational in 2025[1]Source: Brewers Association, “National Beer Sales & Production Data,” BrewersAssociation.org. Large-scale players increasingly acquire successful regional craft brands and invest in innovation pipelines that replicate local authenticity while benefiting from operational scale. For example, Carlsberg’s GBP 3.3 billion acquisition of Britvic in January 2025 enhanced its exposure to premium mixers and craft-aligned beverage categories. In the Asia-Pacific region, particularly India, the craft beer ecosystem continues to benefit from urbanization and evolving consumer lifestyles. Taproom chains backed by B9 Beverages have gained traction among young professionals in metropolitan areas, driving double-digit revenue growth in fiscal year 2025. This expansion reflects sustained demand for localized, experiential beer consumption and reinforces the role of craft and premium formats in diversifying a beer market traditionally dominated by mass-produced lagers.
Growing Tourism and Hospitality Impact Positive Growth
The tourism and hospitality sectors' recovery is increasing beer market growth, primarily in the on-trade segment. Across Asia, markets such as Hong Kong, Singapore, Thailand, and Vietnam demonstrate strong on-trade alcohol consumption driven by vibrant nightlife, dining cultures, and international tourism flows. Large-scale events, including beer festivals, live entertainment, and cultural celebrations, further amplify beer consumption by increasing foot traffic and broadening distribution touchpoints. These experiential settings support premium pricing and brand discovery, reinforcing beer’s position within leisure-driven consumption occasions. In parallel, beer tourism has emerged as a meaningful growth lever for regional markets, as consumers increasingly seek immersive experiences through craft brewery visits, production facility tours, and industry-led events. For instance, breweries in Belgium attract substantial visitor volumes through guided tours and flagship events such as Belgian Beer Weekend, underscoring the role of beer tourism in elevating market value and supporting long-term industry growth.
Product Innovation in Terms of Ingredient and Alcohol Content
Beer producers continue to expand the market through advanced brewing technologies and ingredient innovation that respond to evolving consumer preferences for moderation, flavor diversity, and sustainability. The adoption of low-alcohol yeast strains, functional botanicals, and precision-fermented hop compounds enables brewers to broaden flavor portfolios while reducing dependence on traditional raw materials. A 2025 study published in Nature Communications identified novel yeast strains capable of producing beers at 2–3% ABV while maintaining full-bodied mouthfeel, enabling brewers to address moderation-focused consumption occasions without sacrificing sensory quality[2]Source: Nature Communications, “Yeast Engineering for Low-Alcohol Beer Production,” Nature.com. These innovations allow manufacturers to deliver complex sensory profiles with lower alcohol content, supporting consumer demand for balanced consumption without compromising taste. In 2024, Carlsberg conducted pilot-scale brewing using precision-fermentation techniques that reduced water usage by approximately 30% and lowered land requirements by 50% compared with conventional hop cultivation. Such process innovations align environmental efficiency with flavor consistency, reinforcing the strategic importance of sustainable brewing input. Collectively, these advancements reinforce product differentiation, sustainability alignment, and long-term growth within the global beer market.
Health Conscious Consumer Accelerating Demand For Gluten Free Beer
The gluten-free beer products are experiencing steady growth, supported by rising consumer health awareness, increasing adherence to specialized diets, and the growing prevalence and diagnosis of celiac disease. Heightened medical screening and public awareness campaigns have contributed to higher reported incidence rates, reinforcing demand for certified gluten-free and gluten-reduced beer alternatives. In response, both multinational and craft breweries are expanding product portfolios to accommodate specific dietary requirements, including gluten-free, low-calorie, and low-carbohydrate beer formulations. These offerings cater to consumers following ketogenic, paleo, and other restricted diets, extending beer consumption occasions beyond traditional segments. Consumer engagement and category visibility are further strengthened through beer festivals and experiential marketing events that prominently feature gluten-free options. Such platforms play a dual role by increasing awareness of gluten sensitivity and celiac disease while educating consumers on product formulation and certification standards. Direct-to-consumer interaction at these events allows brewers to build trust, collect feedback, and accelerate trial among first-time buyers. For example, in May 2025, Lakefront hosted a spring outdoor celebration featuring its certified gluten-free New Grist beers and specialty gluten-free cask brews, complemented by a curated selection of exclusively gluten-free food trucks and vendors.
Restraints Impact Analysis*
| Restraint | (~) % Impact on CAGR Forecast | Geographic Relevance | Impact Timeline |
|---|---|---|---|
| Stringent Government Regulations | -0.60% | Global, with significant impact in Europe and North America | Medium term (2-4 years) |
| Health-Conscious Consumption Trends Limiting Beer Demand | -0.30% | Global, especially Europe and North America where wellness trends are strongest | Long term (≥ 4 years) |
| Raw Material Cost Inflation and Supply Chain Challenges Impact Beer Production | -0.90% | Global, with varying intensity across regions | Medium term (2-4 years) |
| Religious and Cultural Constraints Affecting Beer Market Growth | -0.40% | Middle East, North Africa, parts of Asia | Long term (≥ 4 years) |
| Source: Mordor Intelligence | |||
Stringent Government Regulations
Government regulations continue to exert a significant influence on the beer market through tax reforms, marketing restrictions, and expanded labeling mandates, increasing compliance complexity for brewers and constraining volume growth in highly regulated regions. Changes in excise duty structures directly affect pricing, consumption patterns, and on-trade viability. For example, the United Kingdom transitioned to an alcohol-by-volume (ABV)–linked excise tax system in August 2023, which contributed to a 4% decline in on-trade beer volumes in 2024[3]Source: UK Government, “Alcohol Duty Review,” Gov.uk. Regulatory harmonization efforts at the regional level further elevate operational costs for beer manufacturers. Under a European Union directive issued in December 2023, alcoholic beverages sold within the bloc must display ingredient lists and calorie information by 2026[4]Source: European Commission, “Food Labelling and Nutrition,” Ec.europa.eu. Compliance with these requirements is expected to generate EUR 50–100 million in cumulative costs related to label redesign, inventory write-offs, and supply chain adjustments for producers operating across multiple EU markets. As a result, evolving regulatory frameworks across regions shape brewers’ strategic decisions, influencing pricing, distribution, and investment priorities while moderating overall beer market expansion.
Raw Material Cost Inflation and Supply Chain Challenges
Climate-related supply constraints and input-cost volatility continue to exert pressure on brewer profitability and operational planning. In 2024, drought conditions across key barley-producing regions in France and Germany disrupted harvest yields, driving higher spot prices and forcing brewers to draw down existing inventories to maintain production continuity. Packaging inflation further compounded cost challenges. Rising aluminum prices accelerated efficiency-driven packaging redesigns, prompting brewers to collaborate with suppliers such as Ball Corporation on can-light-weighting programs. Water scarcity has emerged as an additional structural risk, particularly in water-stressed markets. In South Africa, breweries implemented closed-loop water-recycling systems to reduce consumption to approximately 2.5 hectoliters of water per hectoliter of beer produced, aligning operations with World-Class Benchmarking standards. Hence, these environmental and input-cost pressures highlight the growing interdependence between climate resilience, operational efficiency, and margin preservation within the global beer market.
*Our forecasts treat driver/restraint impacts as directional, not additive. The impact forecasts reflect baseline growth, mix effects, and variable interactions.
Segment Analysis
By Product Type: Lager Dominates, Non/Low Alcohol beer Accelerates
Lager beer continues to dominate the global beer market, accounting for 87.09% of total revenue in 2025, underscoring its entrenched mass-market position, particularly across Asia-Pacific and Latin America. The segment’s performance remains supported by extensive distribution networks, strong brand recognition, and cultural relevance in social occasions, live events, and televised sports. Premiumization and craft-led diversification continue to reshape consumer spending patterns. While traditional lagers retain cultural significance, premium craft lagers and hop-forward ales are capturing discretionary expenditure among urban millennials and Gen Z consumers.
In contrast, the non-alcoholic and low-alcohol beer segment represents the fastest-growing product category and is forecast to expand at a CAGR of 5.30%. Growth is driven by younger consumer cohorts who increasingly balance social engagement with health and wellness considerations. The value contribution of non-alcoholic beer is particularly pronounced in developed markets, with Western Europe’s non-alcoholic beer segment supported by public health initiatives and institutional backing for moderate-drinking campaigns.


By Category: Premium Growth Outpaces Standard Volume
Standard beer continues to represent the majority of global beer consumption, accounting for 79.32% of total revenues in 2025. The segment’s dominance is sustained by affordability, wide availability, and entrenched consumer preferences, particularly across high-population markets in Asia and Africa, where price sensitivity remains a key purchase driver. Standard lagers, therefore, continue to anchor volume stability within the global beer market, despite increasing segmentation.
In contrast, the premium beer segment is exhibiting accelerated value growth and is forecast to expand at a CAGR of 5.45%, outpacing standard beer by nearly one percentage point. This performance reflects ongoing consumer “trade-up” behavior, as drinkers seek improved quality, brand credibility, and differentiated drinking experiences. Premium segment expansion is further supported by brand storytelling centered on heritage, craftsmanship, and authenticity, as well as limited-edition packaging and alignment with gastronomy and food-pairing occasions.
By Packaging Type: Sustainability Drives Can Growth
Glass bottles continue to represent the dominant beer packaging format, accounting for 55.26% of global volume in 2025. Their sustained appeal is closely linked to strong visual cues of quality and authenticity, particularly in European markets and parts of Asia where bottles remain integral to both premium branding and on-trade presentation. For instance, Thai Beverage has expanded its returnable-glass-bottle program to lower carbon intensity and comply with evolving sustainability targets. Alongside these initiatives, brewers continue to diversify packaging solutions through kegs for draft service and paperboard-based alternatives that replace plastic rings, aligning with tightening regulatory requirements and environmental standards.
However, aluminum cans are emerging as the fastest-growing packaging format and are projected to expand at a CAGR of 5.60% through 2031. Growth is driven by cans’ circular-economy advantages, including high recyclability rates, reduced transportation weight, and enhanced portability. Cans also offer functional performance benefits, as their ability to block light and limit oxygen ingress improves shelf life for hop-forward and flavor-sensitive beers. As a result, the beer market for canned premium lagers is expected to increase significantly, with major brands such as Budweiser adopting secondary packaging and labeling that highlight recycled-content benchmarks to appeal to sustainability-conscious consumers.
By Distribution Channel: Off-Trade Growth Accelerates
On-trade venues continue to command a leading position in the global beer market, capturing 57.45% of total market value in 2025. This dominance is reinforced by experiential pricing strategies in bars, festivals, and entertainment venues, where consumers demonstrate a higher willingness to pay for premium beers, limited editions, and immersive social experiences. On-trade establishments increasingly differentiate through curated beer menus and premium brand placements, sustaining value growth even as overall consumption volumes stabilize.
Conversely, the off-trade channel is positioned to outpace the on-trade in terms of growth rate and is forecast to expand at a CAGR of 5.71% through 2031. This momentum is driven by deeper penetration of e-grocery platforms, convenience-led retail formats, and brewer-operated B2B digital platforms that improve wholesale ordering efficiency and inventory replenishment. Within off-trade distribution, specialty liquor stores are expanding their share as retailers allocate additional shelf space to multi-pack formats, premium imports, and non-alcoholic beer options. Digital enablement across the distribution network, including direct-to-retailer platforms and data-driven assortment optimization, continues to reshape channel dynamics and supports long-term growth across both on-trade and off-trade segments of the global beer market.
Geography Analysis
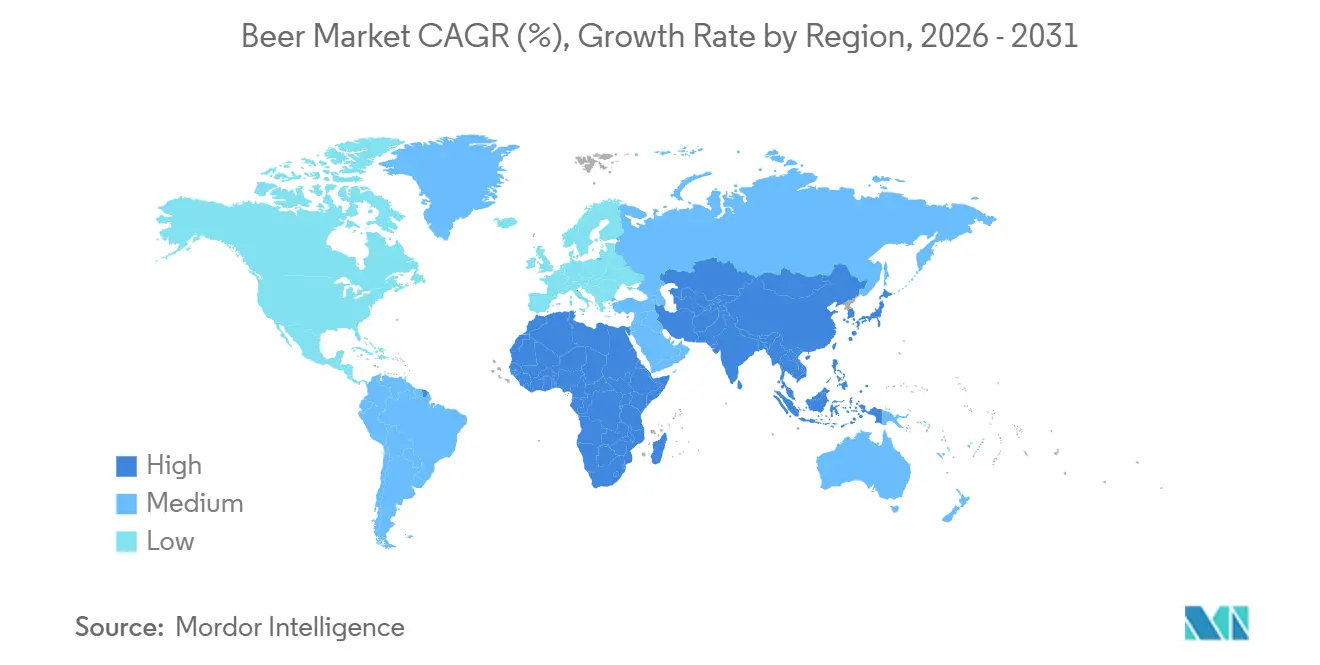
Asia-Pacific strengthened its position as the largest and fastest-growing regional beer market, generating 30.12% of global revenue in 2025 and projected to advance at a 5.40% CAGR through 2031. Growth is underpinned by rapid urbanization, rising disposable incomes, and the continued expansion of the urban middle class across emerging economies. India remains a key growth engine, with beer volumes increasing in 2024, supported by favorable demographics, improved retail access, and ongoing modernization of domestic brewery infrastructure. Southeast Asian markets such as Vietnam and Indonesia continue to post mid-single-digit growth, aided by government investments in tourism infrastructure and expanding on-trade consumption in urban and resort destinations.
Europe and North America remain mature beer markets facing structural volume declines, yet both regions sustain revenue growth through premiumization, innovation, and portfolio diversification into non-alcoholic offerings. In Europe, demographic aging and public health initiatives have weighed on traditional consumption patterns. Germany’s per-capita beer consumption declined to 84.3 liters in 2023, reflecting these long-term trends[5]Source: German Brewers Association, “Beer Statistics Germany 2023,” Brauer-Bund.de. Premium, craft, and alcohol-free extensions continue to refine consumer choice and stabilize value growth across the region.
Developing regions, including South America, the Middle East, and Africa, present diverse growth trajectories shaped by economic conditions, regulation, and demographics. In the Middle East, strict regulatory environments constrain market potential in countries such as Saudi Arabia, while the United Arab Emirates benefits from a tourism-led rebound that supports on-premise sales of imported premium lagers. Sub-Saharan Africa offers long-term growth potential driven by a young population and rising disposable incomes; however, market expansion remains contingent on improvements in logistics infrastructure, local sourcing capabilities, and predictable excise taxation frameworks.

Regulatory Landscape
Beer operates under multi-layered alcohol, food-safety, and trade rules that shape pricing, labeling, and route-to-market decisions across regions. In the United States, production and trade compliance sits across the Alcohol and Tobacco Tax and Trade Bureau (TTB) for excise and operational requirements under 27 CFR Part 25, while the FDA oversees nutritional and ingredient labeling, creating a split-regulator compliance model for breweries and importers. As of mid-2026, federal excise tax benchmarks remain in place (for example, USD 3.50 per barrel for the first 60,000 barrels for eligible small domestic brewers), reinforcing the structural advantage of scale and administrative capability in highly regulated markets.
Outside the US, governments continue to tighten standards for product definition and labeling. Regulatory change is increasingly concentrated in compliance details rather than outright market access. Nigeria’s NAFDAC Beer Regulations (2025) define beer as malt-derived and link labeling requirements to the country’s Pre-packaged Food (Labelling) Regulations 2022, including caution statements on alcohol consumption, which increases execution complexity for multi-SKU portfolios. Trade rules also influence landed cost and sourcing choices, including the use of WTO World Tariff Profiles (June 2026) by exporters and importers to navigate applied tariff structures and tariff-related planning for cross-border beer shipments.
Value Chain Analysis
The global beer value chain runs from agricultural inputs (barley, hops, adjuncts, water) through malting, brewing, and packaging, then on to distribution via wholesalers, on-trade accounts, and off-trade retail (including e-grocery and direct-to-retailer ordering ecosystems used by large brewers). Packaging and utilities have become decisive cost and service-level levers, with aluminum can availability and pricing, glass bottle supply (including returnables), and access to low-carbon heat and power increasingly determining which SKUs and pack formats can be produced and placed reliably across channels.
Recent operational moves show a shift toward resilience through strategic partnerships and localized infrastructure. In South Africa, Soufflet Malt and Heineken Beverages partnered in March 2025 on a new EUR 100 million malting facility near Heineken’s Sedibeng Brewery (targeted operational timeline: mid-2027), tightening upstream integration and supply security for malt. In India, new BIS certification requirements for aluminum cans (April 2025) contributed to supply bottlenecks, and United Breweries disclosed in July 2025 that shortages cost 1-2 percentage points of growth over a six-month period, underscoring packaging as a constraint rather than a commodity input. Parallel decarbonization and logistics upgrades, including Carlsberg Sweden expanding electric-truck operations with Einride and Heineken’s heat-battery agreement for its Portugal brewery, point to a value chain where emissions, energy, and transport performance are increasingly embedded into production economics and customer commitments.
Competitive Landscape
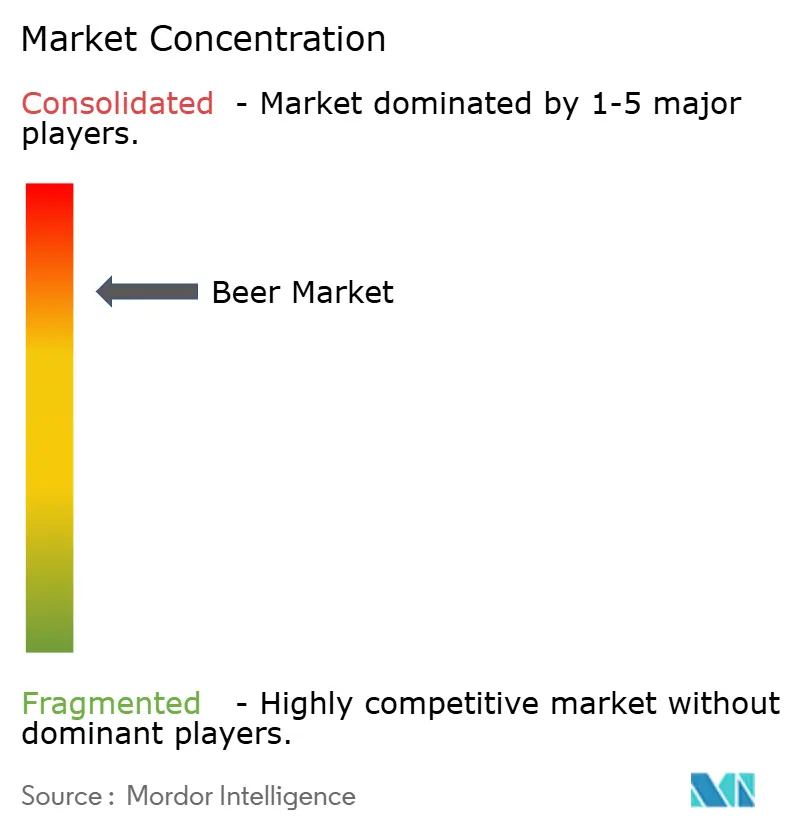
The beer market exhibits a highly concentrated competitive structure, with a dominance of established players, primarily AB InBev, Heineken, and Carlsberg, that exercise significant influence through expansive global distribution networks, multi-tiered brand portfolios ranging from value to super-premium, and increasingly integrated digital ecosystems that embed retailers and wholesalers into proprietary ordering and data platforms. These structural advantages allow leading players to manage pricing, optimize assortment mix, and defend market share amid slowing volume growth.
Despite their scale, market leaders continue to face competitive pressures from craft brewers and private-label offerings. AB InBev reported revenues of USD 59.8 billion in 2024, although consolidated volumes declined by 1.4%, reflecting heightened competition in North America from craft producers and in Europe from retailer-led private labels. Leading brewers are also leveraging innovation in packaging and draft systems to differentiate their offerings and reinforce sustainability credentials. Examples include Ball Corporation’s aluminum cup pilot with Molson Coors for closed-loop recycling at sports venues and Heineken’s deployment of smart kegs equipped with freshness sensors across European pubs.
Mid-tier and regional brewers are responding to competitive intensity through targeted strategies focused on geographic concentration, collaborations, and operational flexibility. Asian brewers such as Kirin and Asahi are mitigating stagnation in mature domestic markets through cross-shareholdings and joint ventures across Southeast Asia. Meanwhile, environmental, social, and governance (ESG) performance increasingly shapes investor capital allocation, favoring brewers with science-based emissions targets and renewable-energy investments. This trend reinforces structural advantages for large-capitalization players capable of financing sustainability transitions, further consolidating competitive leadership within the global beer market.
Beer Industry Leaders
Heineken N.V.
Anheuser-busch Inbev SA/NV
Carlsberg Group
Molson Coors Beverage Company
Asahi Group Holdings Ltd
- *Disclaimer: Major Players sorted in no particular order

Market Opportunities and Future Outlook
Portfolio whitespace continues to expand around moderation and product differentiation, with leading brewers using no- and low-alcohol platforms and adjacent propositions to defend share in mature markets while opening new consumption occasions. Brand activity supports this direction, including Carlsberg Hong Kong’s December 2025 expansion of its No and Low-Alcohol Range (including Carlsberg 0.0 and other non-alcoholic options) timed around the festive season and Dry January behavior.
Investment in operational capacity and technology adoption also creates near-term opportunity around packaging capability and route-to-market efficiency, particularly where supply chain constraints or sustainability requirements limit execution. In April 2026, Anheuser-Busch announced an expanded USD 600 million investment across 2025 and 2026 for US manufacturing, and in June 2026 it added a USD 20 million+ upgrade focused on brewery and packaging equipment in its St. Louis and Arnold, Missouri facilities tied to Michelob ULTRA production. In Australia, Asahi Beverages started construction in June 2026 on a USD 150 million distribution center in Redbank, Queensland with robotics and high-speed systems, indicating a push toward automated, data-driven distribution that supports off-trade growth formats. Digital operations tooling is also moving from pilots into deployment, with Heineken confirming AI-driven digital twins (February 2026) to optimize brewery operations and logistics, reinforcing a pathway where energy, water, and transport optimization becomes part of the competitive baseline alongside brand and pack innovation.
Recent Industry Developments
- July 2026: Carlsberg Group announced a capital and business tie-up with Sapporo Breweries to form a joint venture in Singapore, with Sapporo taking a 25% stake. The announcement strengthens access to Southeast Asia distribution and provides a platform for coordinated brand building across markets such as Hong Kong, Vietnam, Cambodia, and Laos.
- June 2026: Heineken made official a branded collaboration with Heinz, selling a co-pack that combined Heineken beers with Heinz Tomato Ketchup. The activation shows how large brewers are using cross-category partnerships to generate retail visibility and incremental demand in saturated channels without changing core brewing assets.
- January 2026: United Breweries (Heineken) launched Kingfisher Smooth in India, adding a new strong-beer proposition positioned around a smoother taste profile. The launch supports portfolio segmentation in a high-volume market where brand families are extending into differentiated variants to capture younger legal-age consumers.


Research Methodology Framework and Report Scope
Market Definition and Coverage
For this study, the beer market is defined as the sales value of commercially produced beer that is brewed, packaged, and sold through retail and on-premise channels. The sizing is built in USD terms and follows standard beer revenue flows from producers into the market.
Scope exclusions: Home-brewing kits, cider, hard seltzer, and pure contract-brewing service fees are excluded from the market totals.
Segmentation Overview
- By Product Type
- Ale
- Lager
- Non/Low-Alcohol Beer
- Other Beer Types
- By Category
- Standard
- Premium
- By Packaging Type
- Bottles
- Cans
- Others
- By Distribution Channel
- On-Trade
- Off-Trade
- Specialty/Liquor Stores
- Others Off Trade Channels
- By Geography
- North America
- United States
- Canada
- Mexico
- Rest of North America
- Europe
- Germany
- France
- United Kingdom
- Spain
- Netherlands
- Italy
- Rest of Europe
- Asia-Pacific
- China
- India
- Japan
- Australia
- South Korea
- Rest of Asia-Pacific
- South America
- Brazil
- Argentina
- Rest of South America
- Middle East and Africa
- United Arab Emirates
- South Africa
- Saudi Arabia
- Rest of Middle East and Africa
- North America
Data Sources, Market Sizing, and Validation
Desk Research
Desk work starts by mapping the global beer footprint using public production and trade signals, then aligning them with demand-side indicators. We typically rely on sources such as FAOSTAT for agriculture inputs, UN Comtrade for cross-border beer trade, the US TTB for regulatory and industry statistics, and Eurostat for country-level food and beverage data.
To keep assumptions grounded, we also review brewer annual reports, investor presentations, and earnings commentary, since these often spell out pricing actions, premiumization direction, and channel shifts. Patent databases are used selectively to flag packaging and brewing process changes that can affect cost structure and product mix. For market context and event checks, we use a paid subscription focused on company financials and another focused on news and financial markets. The sources named here are illustrative, and additional public materials were also used for collection, validation, and clarification.
Primary Interviews and Surveys
Primary inputs are used to pressure-test what desk sources cannot fully explain, especially around pricing ladders, channel margins, and how non-alcoholic beer is counted in practice. We spoke with a mix of brewers, distributors, packaging partners, and category managers, followed by discussions with regional experts to confirm consumption patterns and to assess trading down or trading up across major geographies.
Distribution of primary research fieldwork respondents
| Company type | Respondent position | Region |
|---|---|---|
| Top tier: 29% | CXOs: 17% | APAC: 43% |
| Mid tier: 51% | Functional/Unit leaders: 29% | EMEA: 34% |
| Smaller Players: 20% | Managers: 54% | Americas: 23% |
Market-Sizing & Forecasting
The sizing model starts from a top-down demand pool view, where country consumption, the legal drinking population, and channel mix are used to reconstruct value in each market, then totals are built up to regional and global numbers. To keep the output grounded, we corroborate it with selective bottom-up approximations, such as sampled producer revenue splits, distributor throughput checks, and an ASP-by-packaging estimate (bottles versus cans versus draft) to adjust totals where gaps appear.
Inputs that materially move the beer value pool include per-capita consumption trends, on-trade versus off-trade share shifts, premium versus mainstream mix, tax and duty impacts that change shelf prices, and the penetration of non-alcoholic beer in regulated markets. When historical series is uneven, missing points are filled using nearby proxy indicators such as production and trade movements, and then re-checked with interview feedback before finalizing.
For forecasting, we rely mainly on scenario analysis supported by trend smoothing, since beer demand is shaped by income pressure, channel normalization, and price-led mix changes that do not track as a single straight line. The scenario ranges are tightened after validating key assumptions with primary respondents, and then the final forecast path is selected to stay consistent with observed consumption and pricing signals.
Data Validation & Update Cycle
Validation is done through multiple rounds of cross-checks so the final totals are not driven by one data series. We compare modeled values against independent signals like production and trade direction, category revenue commentary, and channel trend indicators. If any large variance shows up, we re-open it and trace it back to the assumption causing it.
Before sign-off, the model is reviewed by another analyst to spot anomalies in growth rates, country shares, and currency conversion timing. Reports are refreshed annually, and interim updates are triggered when a material event changes pricing, taxes, or channel structure. Right before delivery, a fresh pass is completed so clients receive the most current view available at that time.
Mordor Intelligence's Beer Market Estimate Compared With Other Published Estimates
Published beer market values often do not match perfectly because firms can count different product edges, use different price points in the value chain, and anchor their base year to a different calendar. Currency conversion timing and how quickly assumptions are refreshed can also shift the final USD figure, even when the growth story sounds similar.
Hard seltzer is a common inclusion in some alcohol studies, but it sits outside Mordor Intelligence's scope for the beer market, which is one reason the table shows a spread. Other gaps come from whether value is counted at retail shelf prices versus producer-level revenue, and from how non-alcoholic beer is treated when it is blended into broader beverage categories. In our checks, the pricing ladder by channel and pack type is kept consistent with country realities, which helps avoid inflating totals in markets with high on-trade markups.
Benchmark comparison
| Source | Market Size | Gaps in Research Methodology |
|---|---|---|
| Mordor Intelligence | USD 0.85 T (2026) | |
| Global Consultancy A | USD 898.14 B (2025) | Uses a different base year and may reflect a broader alcoholic beverage framing in some countries, with value closer to retail pricing rather than ex-factory revenue, which can lift totals where on-trade share is high. |
| Industry Research Group B | USD 882.80 B (2025) | Blends beer value with a wider pricing stack and applies a longer forecast horizon, and the treatment of non-alcoholic beer and adjacent fermented categories is not clearly separated in the published summary. |
Overall, the differences mainly come down to what is counted as beer, which year is used as the anchor, and which price level is treated as the market value. By keeping the scope clean and tying pricing to channel and packaging realities, the final number becomes easier to replicate and explain in a planning discussion.


Key Questions Answered in the Report
What is the current beer market size and how fast is it growing?
The beer market is valued at USD 0.85 trillion in 2026 and is forecast to reach USD 1.09 trillion by 2031, advancing at a 5.16% CAGR.
Which region leads the beer market in revenue?
Asia-Pacific accounts for 30.12% of global revenue in 2025 and is also the fastest-growing region at a 5.40% CAGR.
Why are cans gaining share in beer packaging?
Cans post a 5.60% CAGR because they support higher recycling rates, reduce logistics emissions, and meet consumer convenience needs.
How is premiumization influencing the beer industry?
Premium lines are expanding at a 5.45% CAGR as consumers trade up for quality, distinctive ingredients, and brand storytelling, offsetting volume declines in standard categories.
Page last updated on:




