
Europe Casino Gambling Market Size and Share
Market Overview
| Study Period | 2020 - 2031 |
|---|---|
| Forecast Data Period | 2026 - 2031 |
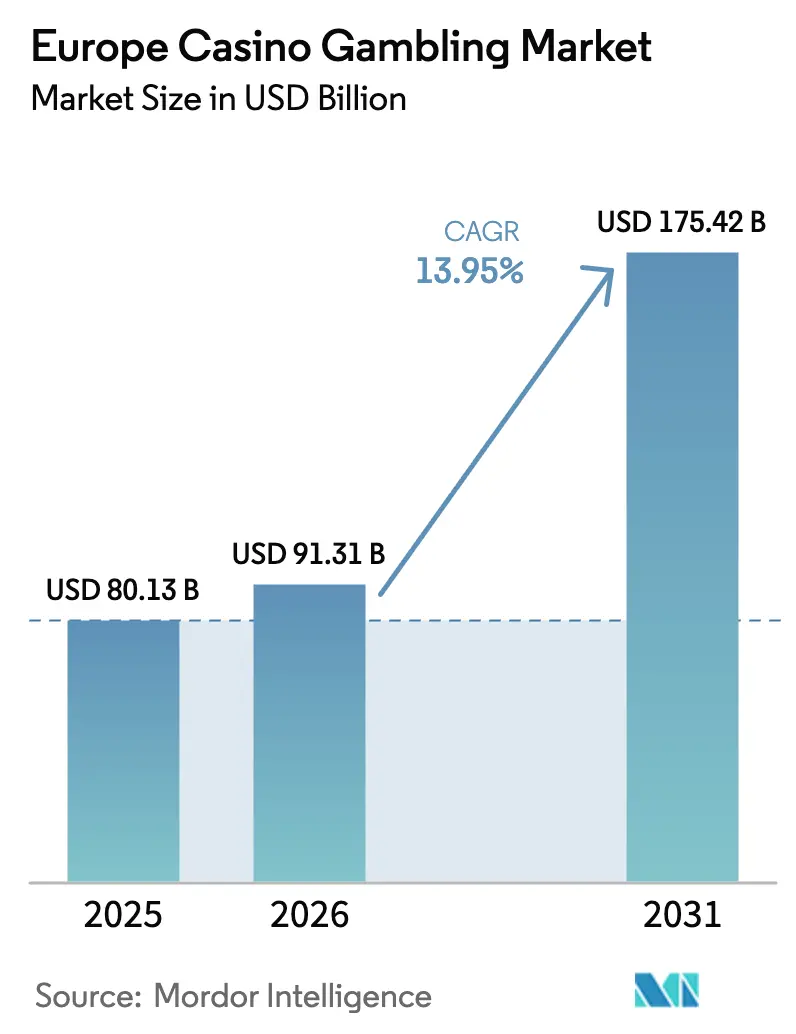
| Base Year Market Size (2025) | USD 80.13 Billion |
| Market Size (2026) | USD 91.31 Billion |
| Market Size (2031) | USD 175.42 Billion |
| Growth Rate (2026 - 2031) | 13.95% CAGR |
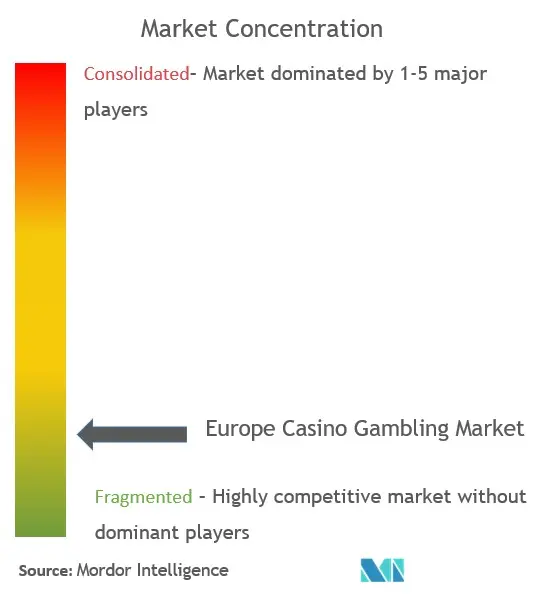
| Market Concentration | Low |
Major Players *Disclaimer: Major Players sorted in no particular order Image © Mordor Intelligence. Reuse requires attribution under CC BY 4.0. | |
Europe Casino Gambling Market Analysis by Mordor Intelligence
Europe casino gambling market size in 2026 is estimated at USD 91.31 billion, growing from 2025 value of USD 80.13 billion with 2031 projections showing USD 175.42 billion, growing at 13.95% CAGR over 2026-2031. Consumer spending momentum is recovering as international tourist arrivals surpass pre-pandemic levels, while operators re-engineer floors toward integrated resort layouts that deepen revenue per visit. Technology upgrades—including cashless wallets, cloud-based casino management systems, and personalized slot content—are translating into higher drop and hold rates as frictionless payment encourages longer dwell times. Regulatory modernization in Spain and selective harmonization efforts in Italy and Germany encourage new capital deployment, even as tighter AML rules and rising gambling taxes in France and the UK temper margins. Consolidation is reshaping the competitive field as national champions pursue cross-border acquisitions to gain scale and compliance expertise in a region that remains legally fragmented.
Key Report Takeaways
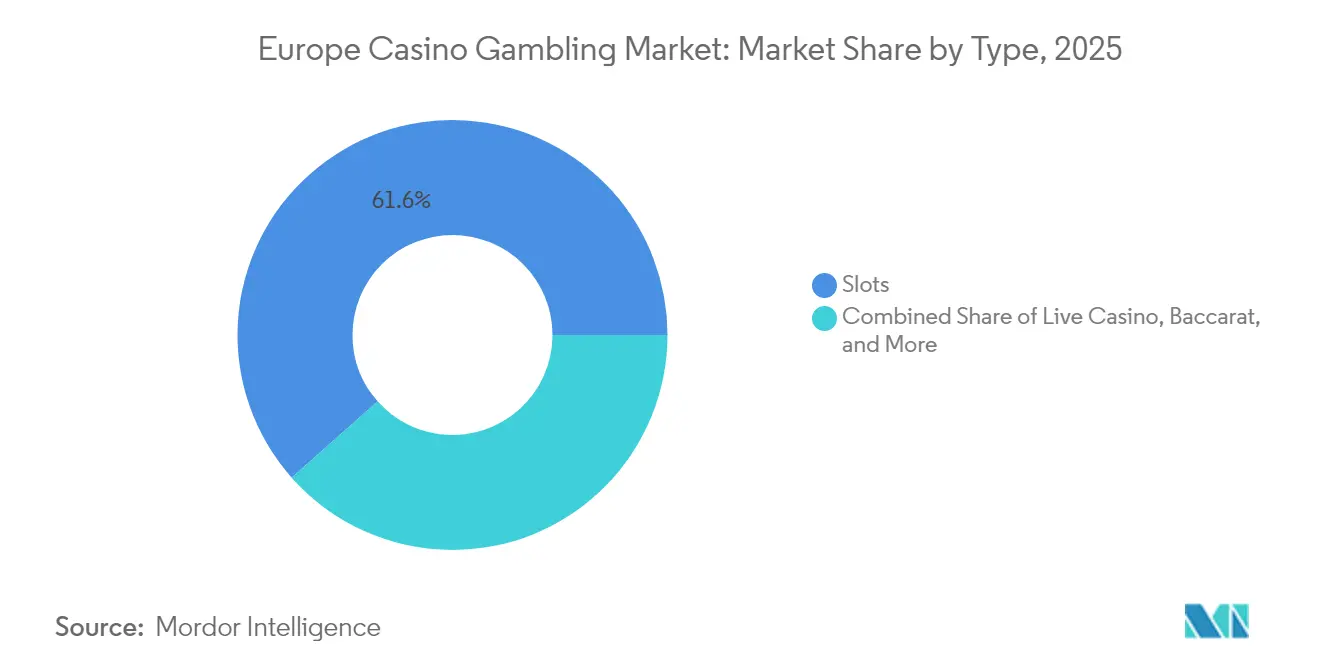
- By type, slots accounted for 61.55% of the Europe casino gambling market share in 2025, while skill-based cabinets are projected to expand at a 9.12% CAGR to 2031.
- By facility format, stand-alone casinos held 51.05% of the Europe casino gambling market share in 2025; integrated resorts are forecast to grow at an 7.72% CAGR through 2031.
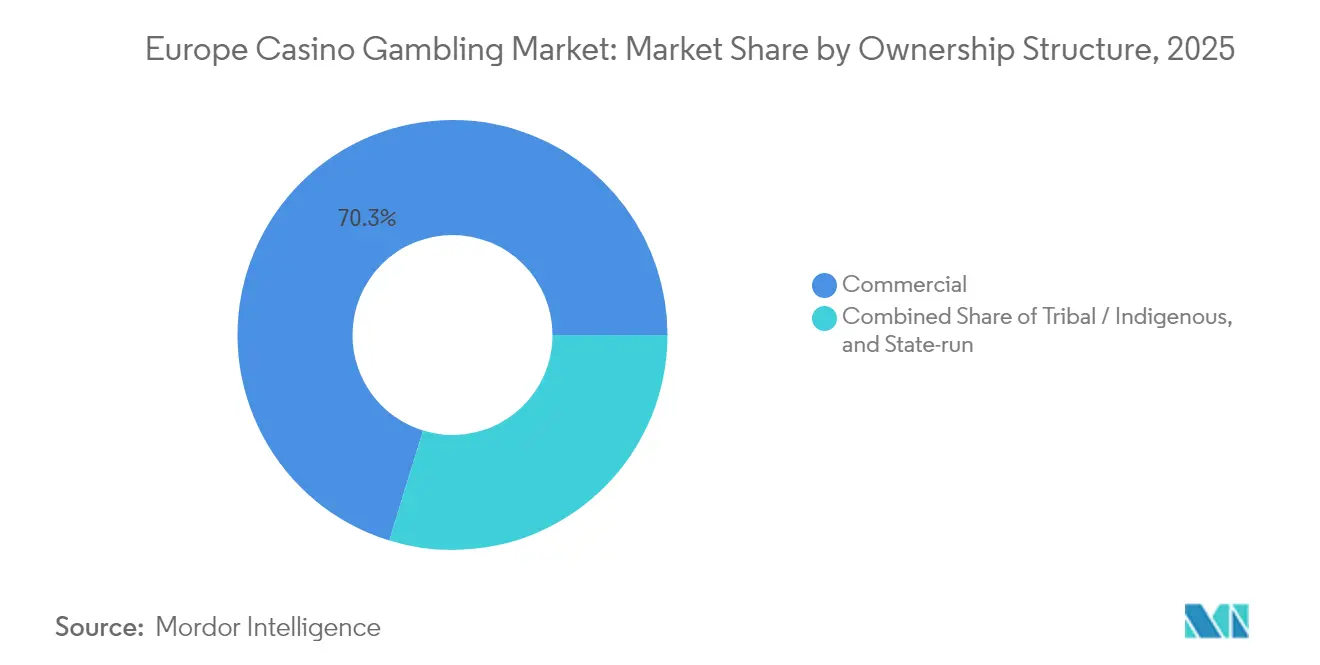
- By ownership structure, commercial operators commanded 70.25% share of the Europe casino gambling market size in 2025, and tribal/indigenous properties remain the fastest-growing cohort with a 7.05% CAGR through 2031.
- By geography, Italy led with 42.20% of the Europe casino gambling market share in 2025, whereas Spain is advancing at a 12.10% CAGR between 2026 and 2031.
Note: Market size and forecast figures in this report are generated using Mordor Intelligence’s proprietary estimation framework, updated with the latest available data and insights as of 2026.
Europe contributes to a system defined not by any single geography but by the interaction of many. The global casino gambling market data by Mordor Intelligence represents that combined structure.
Europe Casino Gambling Market Trends and Insights
Drivers Impact Analysis*
| Driver | ( ) % Impact on CAGR Forecast | Geographic Relevance | Impact Timeline |
|---|---|---|---|
| Post-COVID tourist rebound revives high-value table play | +3.2% | Mediterranean corridor | Short term (≤ 2 years) |
| Experiential entertainment demand lifts integrated resort visitation | +2.8% | Western & Northern Europe | Medium term (2-4 years) |
| Slot-machine tech upgrades and cashless payments raise drop/hold | +2.1% | UK, Germany, Netherlands | Medium term (2-4 years) |
| Cross-border bus-tour bundles attract value-seeking seniors | +1.4% | Alpine border regions | Short term (≤ 2 years) |
| Skill-based cabinets lure Gen-Z day-trippers | +1.8% | Urban UK and Nordics | Long term (≥ 4 years) |
| Danube riverboat-casino licensing corridor emerges | +0.9% | Central Europe | Long term (≥ 4 years) |
| Source: Mordor Intelligence | |||
Post-COVID Tourist Rebound Revives High-Value Table Play
European overnight stays reached 2.92 billion in 2023, 1.6% above 2019, and early 2025 data show a continued surge in Mediterranean destinations.[1]Eurostat, “Tourism statistics,” ec.europa.eu. Table-game revenue benefits disproportionately because international visitors gravitate toward premium live play that commands higher hold percentages than electronic gaming. Coastal resorts in Spain and Italy report baccarat drop margins exceeding pre-pandemic benchmarks as Northern European tourists extend average trip length. French border properties near Switzerland and Belgium are seeing weekday occupancy rates approach 2019 levels as cross-border day-trippers resume roulette sessions. Operators bundle dining credits with table minimum waivers to capture pent-up experiential demand, and VIP programs leverage digital ID verification to speed onboarding. These dynamics raise average revenue per available gaming seat and support capex payback on live-dealer pit refurbishments.
Experiential Entertainment Demand Lifts Integrated Resort Visitation
Consumers increasingly prefer multi-attraction destinations that combine gaming, retail, and live entertainment, mirroring broader lifestyle spending trends. Hard Rock’s USD 1.61 billion (EUR 1.5 billion) Athens integrated resort, slated for 2027, dedicates only 30% of floor area to casino operations, reflecting a shift toward diversified revenue streams.[2]Hard Rock International, “Our Locations – Athens,” hardrock.com. Operators in Germany and the Netherlands replicate this model with mixed-use expansions that secure favorable zoning approvals by promising tourism development and job creation. Integrated resorts extend visitor dwell time and widen demographic reach by appealing to non-gamers traveling with gaming companions. Revenues from F&B and ticketed events hedge against periodic gaming volatility, enhancing cash-flow resilience. Municipal authorities support such schemes to spur post-COVID urban regeneration, granting tax concessions or expedited permits that accelerate build-out timelines.
Slot-Machine Tech Upgrades and Cashless Payments Raise Drop/Hold
European venues are rolling out IGT’s Resort Wallet and comparable systems that allow funds to move seamlessly among slots, kiosks, and F&B outlets.[3]International Game Technology, “Resort Wallet,” igt.com. Cashless ecosystems meet stringent AML requirements by generating transparent audit trails, while also reducing soft costs linked to armored-car cash handling. Everi’s contactless modules, paired with Crane Payment’s hardware, cut transaction time by 20%, encouraging incremental session length. AI-driven recommendation engines deliver game suggestions based on historical play, lifting time-on-device indicators and rejuvenating appeal among digital-native audiences. Data integration across slot banks allows operators to fine-tune denom and volatility mixes in real time, optimizing yield per square meter. Early adopters in the UK and Germany report slot win per unit per day improvements ranging from 8-11% versus legacy floors.
Cross-Border Bus-Tour Bundles Attract Value-Seeking Seniors
Low-margin weekday periods pose occupancy challenges that regional operators offset through organized group tours from adjacent countries. German casinos near the Austrian and Swiss borders derive 40% of mid-week revenue from packages that include transport, buffet vouchers, and limited free play. These visitors, predominantly aged 55+, prefer mechanical reels and low-denomination blackjack, maintaining high seat utilization over six-hour average stays. Currency-exchange discrepancies and promotional price points create perceived bargain value, making tours resistant to inflation headwinds. Operators calibrate marketing by partnering with travel agencies and leveraging social clubs’ digital newsletters to drive bookings. Though deposit sizes are modest, predictability supports workforce scheduling and kitchen inventory management, improving overall cost control.
Restraints Impact Analysis*
| Restraint | ( ) % Impact on CAGR Forecast | Geographic Relevance | Impact Timeline |
|---|---|---|---|
| Rising gambling taxes and stricter advertising caps | -2.4% | France, UK, Germany | Short term (≤ 2 years) |
| Tough AML and affordability checks slow high-roller volumes | -1.8% | UK, Netherlands, Nordics | Medium term (2-4 years) |
| Multilingual-croupier labor shortages inflate OPEX | -1.1% | Tourist-dependent regions | Short term (≤ 2 years) |
| Urban zoning curbs new casino floor expansion | -0.7% | Major metropolitan areas | Long term (≥ 4 years) |
| Source: Mordor Intelligence | |||
Rising Gambling Taxes and Stricter Advertising Caps
France proposes a 55.6% effective tax for potential online casinos, while Spain levied USD 69.98 million (EUR 65.4 million) in 2024 fines for advertising infractions. The UK’s February 2024 consultation on online slot stake limits exemplifies a pan-European pivot toward consumer-protection policies that dampen promotional agility. Fiscal authorities treat gambling duties as politically palatable revenue sources, squeezing operator margins and complicating ROI calculations on refurbishments. Compliance budgets balloon as marketing teams localize campaigns to meet diverging national standards on inducements and broadcast timing. Operators respond by reallocating spend toward loyalty programs and AI-driven CRM that fall outside broadcast caps yet preserve engagement momentum.
Multilingual-Croupier Labor Shortages Inflate OPEX
The European Labour Authority reported a 19% cross-border worker share in hospitality versus 8.7% across the broader economy, illustrating sectoral dependency on mobile talent.[4]European Labour Authority, “Report on Intra-EU Labour Mobility,” ela.europa.eu. Visa processing bottlenecks and rising living costs deter seasonal croupiers, forcing operators to raise wages or shorten operating hours. Language versatility is critical for table-game retention, especially in border markets where patrons expect service in multiple languages. Casinos Austria’s HR certification highlights employer-branding moves to attract scarce talent, yet housing subsidies and accelerated training pipeline investments inflate cost bases. Automation through electronic tables offsets some pressure but cannot fully replicate the live experience demanded by the premium clientele.
*Our forecasts treat driver/restraint impacts as directional, not additive. The impact forecasts reflect baseline growth, mix effects, and variable interactions.
Segment Analysis
By Type: Slots Maintain Dominance While Skill-Based Growth Accelerates
Slots maintain a commanding 61.55% market share in 2025, reflecting their operational efficiency and broad appeal across diverse player demographics. However, skill-based slots represent the fastest-growing segment at 9.12% CAGR (2026-2031), as operators seek to attract Gen-Z players who prefer interactive gaming experiences over traditional chance-based mechanics. Electronic roulette follows at 7.35% growth, benefiting from reduced labor costs and consistent game availability compared to live dealer alternatives. Traditional table games, including baccarat (6.42% share), blackjack (8.03% share), and poker (3.92% share), maintain stable positions but face margin pressure from staffing shortages and regulatory compliance costs.
The emergence of hybrid arcade-style gaming cabinets addresses generational preferences while maintaining regulatory approval under existing slot machine frameworks. These products combine skill elements with underlying random number generation, creating familiar gameplay mechanics for players accustomed to mobile gaming interfaces. Cashless table games achieve 6.74% projected growth as operators integrate digital payment systems across gaming floors, reducing cash handling expenses and improving transaction security. Live-dealt poker experiences 6.12% expansion, driven by tournament-style events that generate ancillary revenue through entry fees and spectator engagement.



By Facility Format: Integrated Resorts Challenge Stand-Alone Supremacy
Stand-alone land-based properties held 51.05% of the Europe casino gambling market share in 2025 due to established urban footprints, yet integrated resorts will outpace them with an 7.72% CAGR through 2031. The Europe casino gambling market size derived from riverboat casinos is expected to grow 6.68% as Danube licensing widens addressable inventory. Cruise-ship gaming, while only 2.85% of value, anticipates 4.45% growth, hinging on pent-up cruise demand and onboard captive audiences. Racinos grow 5.31% by leveraging synergy between racing events and slot floors, capitalizing on existing infrastructure. Integrated developments allocate up to half of gross area to non-gaming attractions, smoothing cyclicality and supporting premium room-rate strategies that lift blended RevPAR.
Municipalities favor integrated resort proposals that bundle convention space, cultural venues, and green public zones, aligning with urban regeneration agendas. Operators negotiate tax abatements in exchange for job-creation guarantees and ESG commitments such as LEED-certified construction and renewable energy sourcing. Riverboat formats present lower capex barriers and flexible deployment along high-tourist waterways; regulatory frameworks mandate onboard surveillance interoperability with port authority systems, creating specialized vendor niches. Cruiseline operators upgrade cage systems to accept multi-currency digital wallets, enhancing spend capture from international passengers.
By Ownership Structure: Commercial Groups Drive Scale While Tribal Properties Accelerate
Commercial operators dominate with 70.25% market share in 2025, leveraging access to capital markets and operational expertise to drive efficiency gains across multi-property portfolios. Tribal/indigenous operations, despite holding only a 6.00% share, achieve the highest growth rate at 7.05% CAGR (2026-2031), reflecting regulatory advantages and cultural tourism appeal in Nordic countries. State-run operations maintain a 23.75% share with 4.62% growth, constrained by bureaucratic decision-making processes but benefiting from regulatory certainty and public sector backing.
The commercial segment's growth acceleration stems from strategic acquisitions and technology investments that enhance operational leverage. FDJ's transformation into FDJ United following the Kindred Group acquisition exemplifies how traditional lottery operators expand into broader gaming markets through M&A activity. State-run operators face political pressure to maximize tax contributions while maintaining responsible gaming standards, creating tension between revenue optimization and public policy objectives. Tribal operations benefit from sovereign immunity protections and cultural authenticity that appeals to experience-seeking tourists, particularly in Scandinavian markets where indigenous heritage attracts international visitors.
Geography Analysis
Italy captured 42.20% of 2025 revenue, anchored by heritage venues in Venice, San Remo, and Campione that meld architectural distinction with modern gaming portfolios. The government’s 2024 gambling framework, featuring USD 7.49 million (EUR 7 million) online license fees and nine-year concessions, provides regulatory predictability. Operators reinvest in restoration projects that elevate premium positioning and command higher table minimums among foreign tourists. Italy’s robust domestic propensity to gamble supports mid-week utilization, balancing seasonal tourist swings. Cashless slot deployments accelerate in the Lombardy cluster, reducing cash-in-transit costs and aligning with new AML directives.
Spain is projected to post the region’s fastest 12.10% CAGR, leveraging tourism resurgence along Mediterranean and Atlantic coasts. Supreme Court relaxation of advertising curbs in 2024 restored operator marketing flexibility while new digital ID verification strengthens consumer-protection reputation. Integrated resort proposals in Catalonia and Andalusia receive municipal backing because they promise job creation and off-season tourist traffic. Domestic operators Cirsa and Codere upgrade aging slot inventories with AI-enabled personalization to satisfy Gen-Z tastes. Cross-border patronage from Portugal and France supplements domestic spend, diversifying revenue sources.
Germany, France, and the UK comprise mature markets that face headwinds from heightened tax burdens and marketing restrictions, limiting expansionary capex. Yet each retains high per-capita spend, underpinned by affluent customer bases and stable infrastructure. BENELUX jurisdictions leverage compact geography to attract cross-border visitors through multi-day tour bundles. Nordic countries showcase potential through tribal enterprises and eco-integrated resorts emphasizing sustainable design, aligning with the region’s environmental ethos.
The casino gambling market is analyzed by Mordor Intelligence across multiple other geographies, with in-depth regional assessments available for Asia and North America.
Regulatory Landscape
Europe remains a patchwork of national gambling regimes, with the European Commission continuing to frame online gambling largely within member-state competence for licensing, taxation, and enforcement. In 2026, compliance and fiscal tightening intensified in key markets, including the UK Remote Gaming Duty increasing to 40% from 1 April 2026 and the Netherlands raising gambling taxation to 37.8% from 1 January 2026 (plus an additional 1.95% levy). The resulting margin pressure is pushing operators to optimize across formats and channels.
Supervision intensity is rising as regulators broaden website and payment blocking to curb unlicensed activity, alongside closer scrutiny of operator controls and outsourced functions, including payments, KYC, and customer support. At the EU level, the Anti-Money Laundering Authority (AMLA) became operational in Frankfurt in January 2026 and explicitly includes gambling operators within scope, while country regulators continue targeted actions, such as the UK Gambling Commission engagement tied to Rank Group (Grosvenor Casinos) proposing a GBP 5 million settlement on 20 May 2026 for historical compliance failures. Standard-setting is also progressing through industry bodies such as the European Gaming and Betting Association (EGBA), with the May 2026 publication of EN 18144, a European standard defining nine core behavioral indicators (markers of harm) for online gambling. This is shaping responsible-gambling program design and monitoring expectations.
Value Chain Analysis
The value chain runs from game and platform suppliers (slot and table content, casino management systems, and analytics) to gaming-floor and resort operations (gaming, hospitality, F&B, and entertainment). It also includes regulated financial and integrity services such as cash management, payments, KYC/AML, fraud, and cybersecurity, with distribution supported by tourism flows, local marketing channels, and loyalty and CRM. Technology vendors enabling cashless wallets, player tracking, and data-driven optimization are increasingly integrated into daily operations, while operators also depend on specialized compliance vendors for identity verification, transaction monitoring, and responsible-gambling tooling to meet tightening national controls.
Payments and compliance act as gating nodes as banks, EMIs, and PSPs apply stricter risk standards to gambling transactions, making auditable payment flows and robust KYC and fraud processes more operationally central. Regulators are also scrutinizing outsourced functions, which increases due diligence and vendor-management requirements for customer support, payments, and compliance services. Industry coordination and standards adoption sit above these activities, with EGBA reporting members holding more than 400 online gambling licences across 22 European countries and running European Safer Gambling Week (16-22 November 2026), supporting shared safer-gambling practices among operators active in multiple jurisdictions.
Competitive Landscape
The European casino gambling market shows moderate concentration, with a major number of operators dominating the competitive landscape. Groupe Lucien Barrière holds a leadership position, supported by its strong footprint across France and Switzerland. Groupe Partouche remains a key player, capitalizing on its extensive portfolio of city-center casinos in regional markets. Casinos Austria AG maintains its influence through a long-standing monopoly license and a well-established presence in both land-based and online gaming. Meanwhile, FDJ United is expanding beyond its lottery roots via the acquisition of Kindred, and Allwyn is leveraging Novibet’s platform to strengthen its reach across Southern Europe.
Technology modernization has become a central strategic priority for many operators. Evolution Gaming plays a pivotal role, supplying live-casino content to a wide range of brands and maintaining a dominant 70% share in the European streaming studio segment. The acquisition of VizExplorer by Quick Custom Intelligence in 2025 highlights the growing demand for advanced analytics tools that enhance player segmentation and optimize table performance. Many casinos are integrating customer relationship management (CRM) systems with responsible gaming platforms to ensure regulatory compliance and maintain license credibility. These initiatives reflect a broader shift toward data-driven decision-making and operational efficiency.
Environmental, social, and governance (ESG) standards are increasingly shaping investment and operational decisions across the industry. Operators that prioritize renewable energy use and community outreach initiatives are rewarded with better financing conditions. Transitioning hospitality and gaming systems to the cloud is also reducing capital expenditures while enhancing cybersecurity and agility. Cloud-based systems enable faster feature deployment, ensuring casinos stay competitive in a rapidly evolving digital environment. Additionally, industry alliances are pushing for unified advertising and technology standards across Europe to simplify regulatory compliance and balance consumer protection with commercial viability.
Europe Casino Gambling Industry Leaders
Groupe Lucien Barrière
Groupe Partouche
Casinos Austria AG
Holland Casino
Rank Group (Grosvenor Casinos)
- *Disclaimer: Major Players sorted in no particular order

Market Opportunities and Future Outlook
Regulatory change is creating a clear opportunity for licensed operators and suppliers that can scale compliance across fragmented regimes. Finland opened licensing applications on 1 March 2026 for a competitive market scheduled to launch on 1 July 2027, giving new entrants a defined pathway and enabling land-based brands to extend omnichannel offerings. In parallel, Austria is debating reform through a draft amendment to the Gambling Act, which proposes ending the online monopoly in favor of an unlimited multi-licensing system. If implemented, that shift would expand the addressable base for technology vendors, payments, KYC/AML providers, and operators that can meet local licensing and responsible-gambling requirements.
Standardization and safer-gambling execution are becoming investable operating capabilities across Europe. The May 2026 publication of EN 18144 sets nine core behavioral indicators (markers of harm) that can be operationalized through analytics, customer interaction policies, and player-protection tooling. Demand is also concentrating around regulated online ecosystems, with EGBA members reporting combined online GGR of EUR 18 billion in 2025 (up 34% from 2024), and ongoing industry engagement through EGBA membership expansion, including Tipico joining in January 2026. For land-based venues, the near-term opportunity is increasingly tied to integrating cashless and data systems with AML-ready audit trails, alongside integrated-resort style diversification (F&B, entertainment, and hospitality) to improve yield per visit while keeping compliance and affordability controls embedded across the customer journey.
Recent Industry Developments
- May 2026: Opening of Fouquet's Mykonos hotel in Greece, first Barrière location in the country. The launch expands Groupe Lucien Barrière's footprint into the Greek hospitality and casino segment. The move diversifies revenue streams and creates opportunities for cross-sell between luxury hospitality and gaming.
- May 2026: Issuance of 37 M EUR EuroPP bond to refinance debt maturing October 2026. The financing supports ongoing expansion and operational needs. The liquidity improvement strengthens balance-sheet resilience for European expansion.
- April 2026: Acquisition of Póvoa de Varzim Casino in Portugal. The acquisition expands Groupe Lucien Barrière's direct market presence in Portugal. The move increases regional footprint and scale in Iberia, enabling synergies with existing properties.


Research Methodology Framework and Report Scope
Market Definition and Coverage
This market covers the revenue generated from casino gambling activity across Europe, counted across online and offline play for commonly offered casino games, and reported in USD for the defined study timeline.
Scope exclusions: It excludes lotteries and most non-casino betting formats (such as pure sports betting) unless they are packaged inside a casino-style product offering.
Segmentation Overview
- By Type
- Live Casino
- Baccarat
- Blackjack
- Poker
- Slots
- Other Casino Games
- By Facility Format
- Integrated Resort Casinos
- Stand-alone Land-based Casinos
- Riverboat Casinos
- Cruise-Ship Casinos
- Racinos
- By Ownership Structure
- Commercial
- Tribal / Indigenous
- State-run
- By Geography
- United Kingdom
- Germany
- France
- Spain
- Italy
- BENELUX (Belgium, Netherlands, Luxembourg)
- NORDICS (Denmark, Finland, Iceland, Norway, Sweden)
- Rest of Europe
Data Sources, Market Sizing, and Validation
Desk Research
Desk research was used to set the starting structure of the market and define practical boundaries around what is and is not casino gambling. Public sources helped us understand how gambling revenue is tracked, how Europe-level rollups are assembled, and how online versus land-based splits are typically presented in reporting.
We reviewed non-paywalled sources such as European gambling trade bodies and public dashboards, national regulators and licensing updates, official statistics offices, central bank currency series, and tax or treasury publications where gaming duties and receipts are disclosed. To cross-check operator exposure and geographic mix, we also used annual reports, investor presentations, and reputable press coverage, and we supplemented this with paid subscriptions that provide company financials, intelligence, news and financials, and patent databases for tracking platform and game feature activity. The desk sources listed here are illustrative, and we referred to additional sources for data collection, validation, and research clarification.
Primary Interviews and Surveys
Primary work focused on validating what the revenue numbers represent in practice, especially the split between online and offline play and how game formats are recorded in reporting. We interviewed a mix of operators, technology and service providers, channel partners, and independent experts across key European markets, and then we used their inputs to tighten assumptions on payout behavior, promotional intensity, and the timing of regulatory changes that can shift reported revenue.
Distribution of primary research fieldwork respondents
| Company type | Respondent position | Region |
|---|---|---|
| Top tier: 36% | CXOs: 14% | |
| Mid tier: 46% | Functional/Unit leaders: 35% | |
| Smaller Players: 18% | Managers: 51% |
Market-Sizing & Forecasting
Sizing starts with a top-down reconstruction that links Europe-level gambling revenue pools to the casino gambling share, and then narrows it using reported online versus land-based splits and country coverage rules. Once that first view is built, the totals are corroborated with selective bottom-up checks, such as sampling leading operators and aggregating reported revenue by geography, and using reasoned ASP type logic only where volume proxies are available.
In the model, a few inputs matter more than others, so they receive extra attention during validation. These include reported gross gaming revenue conventions, online casino penetration versus land-based play, regulatory licensing expansion or tightening, promotional intensity that changes net gaming revenue conversion, and country-level macro indicators that influence discretionary spend. For forecasting, scenario analysis is used because policy changes and channel shifts can move the market faster than normal trend lines, and the variable paths are reviewed with primary respondents before finalizing the outlook. When bottom-up signals are missing for smaller markets, gaps are handled through country clustering and conservative share allocation that is rechecked against regional totals.
Data Validation & Update Cycle
Outputs are checked using triangulation across independent signals, and the largest variances are isolated early so assumptions can be corrected before final review. Anomaly checks include year-over-year jumps that do not match regulation timelines, currency conversion timing checks, and online share movements that conflict with reported channel trends.
Before sign-off, the work goes through multi-step analyst reviews, and re-contacts are triggered when a key assumption changes or a major country revision appears in public reporting. Reports are refreshed annually, with interim updates for material events, and a final pre-delivery pass is completed so clients receive the latest updated view.
Mordor Intelligence's Europe Casino Gambling Market Sizing Compared With Other Published Estimates
Published market sizes for Europe casino gambling often differ because sources do not always count the same revenue concept, and the boundaries between casino games and broader gambling products can be applied differently. Differences also come from the year used for currency conversion, the handling of online versus land-based coverage, and whether figures are reported as operator revenue or as a wider consumer spend proxy.
Evidence like Europe-level gross gaming revenue rollups, published online and land-based splits, and country regulator disclosures are used as consistency checks, and then Mordor Intelligence ties its estimate to casino-only definitions and to a repeatable country aggregation so adjacent categories do not inflate the total.
Benchmark comparison
| Source | Market Size | Gaps in Research Methodology |
|---|---|---|
| Mordor Intelligence | USD 80.13 B (2025) | |
| Industry Association A | USD 32.40 B (2024) | This figure aligns to casino games within a broader European gambling GGR dataset, and it is anchored to 2024 provisional reporting with online and land-based casino split logic, which makes it narrower than a full casino gambling market build that includes more country and game coverage detail. |
| Trade Journal B | USD 133.40 B (2024) | This estimate uses total Europe gambling GGR and therefore bundles lottery, sports betting, and gaming machines together with casino games, which pushes the headline value far above a casino-only scope even when the same year is used. |
Across the three figures, most of the spread is explained by scope boundaries, not by math, since total gambling revenue and casino-only revenue are not interchangeable. By keeping the definition fixed to casino gambling and rechecking totals against channel splits and regulator signals, the final number stays traceable to clear inputs and can be replicated when new yearly data comes in.


Key Questions Answered in the Report
How large is the Europe casino gambling market in 2026?
It stands at USD 91.31 billion and is projected to reach USD 175.42 billion by 2031 at a 13.95% CAGR.
Which product category dominates casino gaming in Europe?
Slots led with 61.55% revenue share in 2025, supported by continual floor availability and high margins.
Which European country generates the most casino revenue?
Italy leads with a 42.20% share thanks to its heritage venues and steady tourist flow.
What format is growing fastest among European casinos?
Integrated resort casinos are forecast to expand at an 7.72% CAGR through 2031 by blending gaming with entertainment and hospitality.
How are regulations affecting operator margins?
Rising taxes and stricter advertising caps, especially in France and the UK, trim profitability, although technology upgrades help mitigate some cost pressure.
Which acquisition reshaped the competitive landscape recently?
FDJ’s USD 2.62 billion (EUR 2.45 billion) purchase of Kindred Group in March 2025 created a pan-European operator with diversified online and land-based assets.
Page last updated on:






