Size and Share of Capital Exchange Ecosystem
Market Overview
| Study Period | 2020 - 2031 |
|---|---|
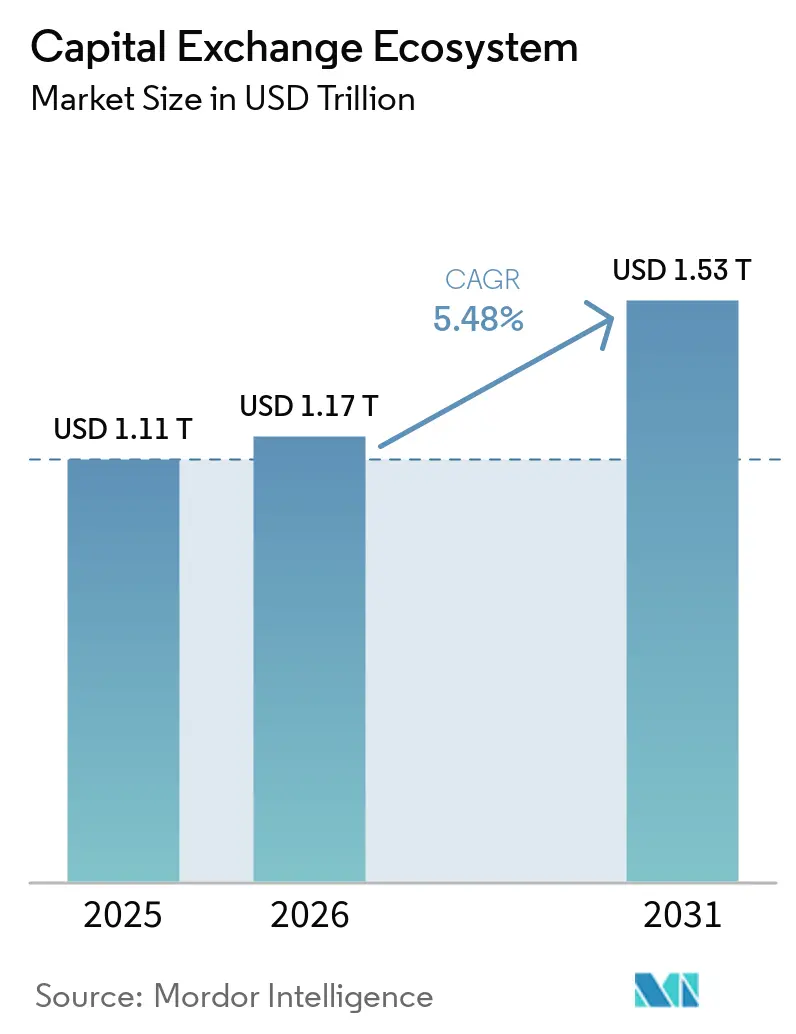
| Market Size (2026) | USD 1.17 Trillion |
| Market Size (2031) | USD 1.53 Trillion |
| Growth Rate (2026 - 2031) | 5.48% CAGR |
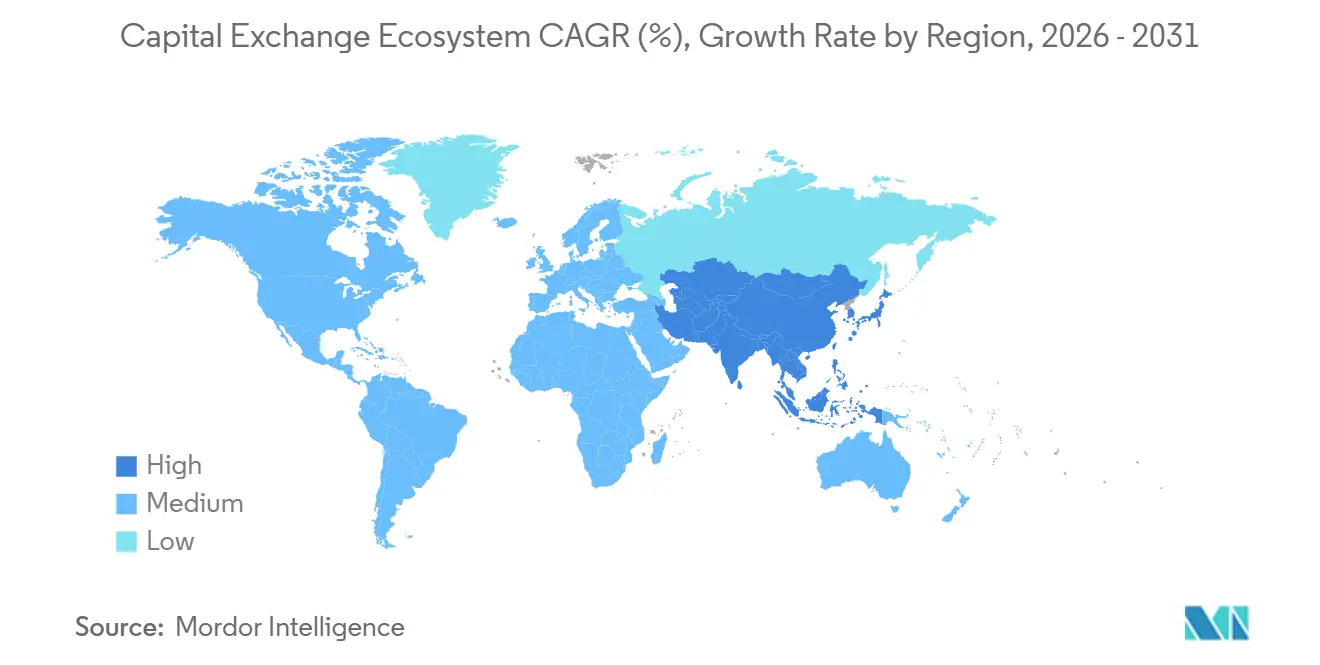
| Fastest Growing Market | Asia Pacific |
| Largest Market | North America |
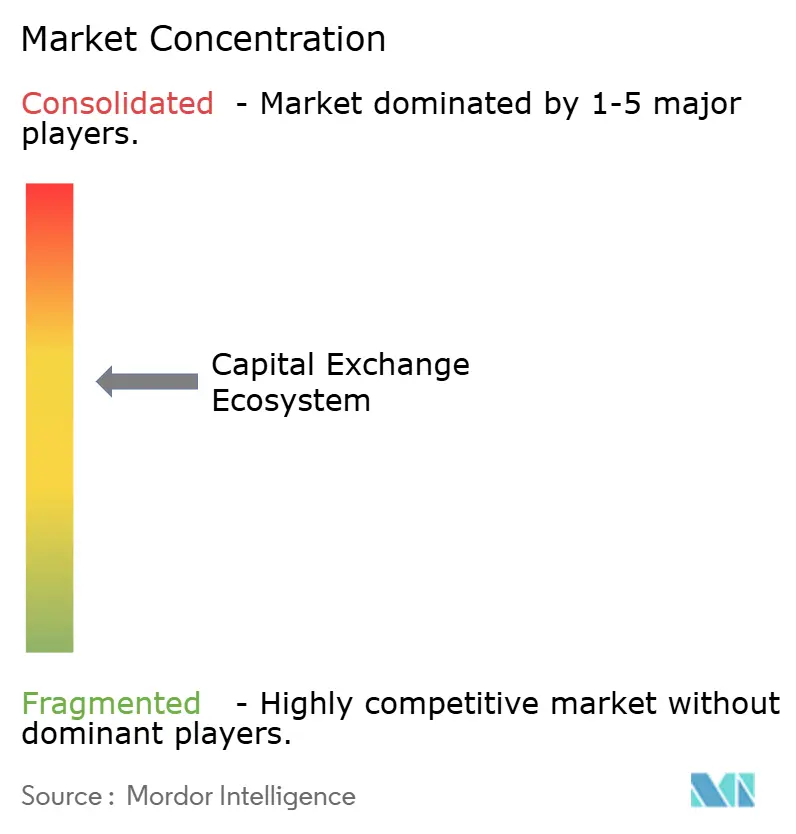
| Market Concentration | Medium |
Major Players *Disclaimer: Major Players sorted in no particular order Image © Mordor Intelligence. Reuse requires attribution under CC BY 4.0. | |
Analysis of Capital Exchange Ecosystem by Mordor Intelligence
The Capital Exchange Ecosystem Market size is expected to grow from USD 1.11 trillion in 2025 to USD 1.17 trillion in 2026 and is forecast to reach USD 1.53 trillion by 2031 at 5.48% CAGR over 2026-2031.
In 2025, global equity trading values surged, with every region hitting record annual turnovers. This trend underscores a shift in focus towards market access over the pursuit of higher fees. Exchanges are responding to pressure from alternative trading systems with lower-friction pricing and extended hours that prioritize liquidity continuity. Record derivatives and options volumes at leading venues highlight how data, clearing, and round-the-clock execution now anchor competitive differentiation. The Capital Market Exchange Ecosystem continues to converge around multi-asset platforms that bundle listings, trading, and post-trade services into subscription-like revenue streams. Global equity issuance also showed renewed momentum as the number of IPOs increased in 2025, which reinforced the case that capital formation is recovering as volatility normalizes and regulation clarifies at key hubs.
Key Report Takeaways
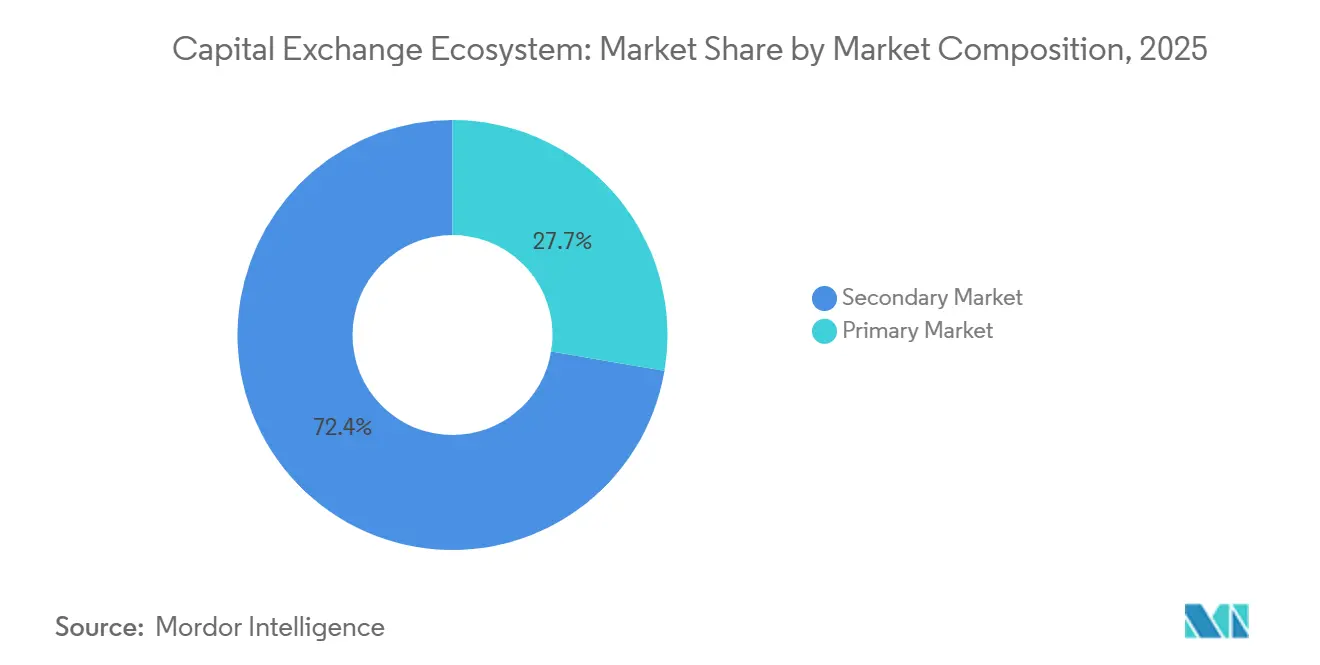
- By market composition, the Secondary Market led with 72.35% share of the Capital Exchange Ecosystem in 2025, while the Primary Market is projected to expand at an 11.68% CAGR through 2031.
- By the capital market, Stocks accounted for a 67.39% share of the Capital Exchange Ecosystem in 2025, while Bonds are expected to grow at an 8.14% CAGR over 2026 to 2031.
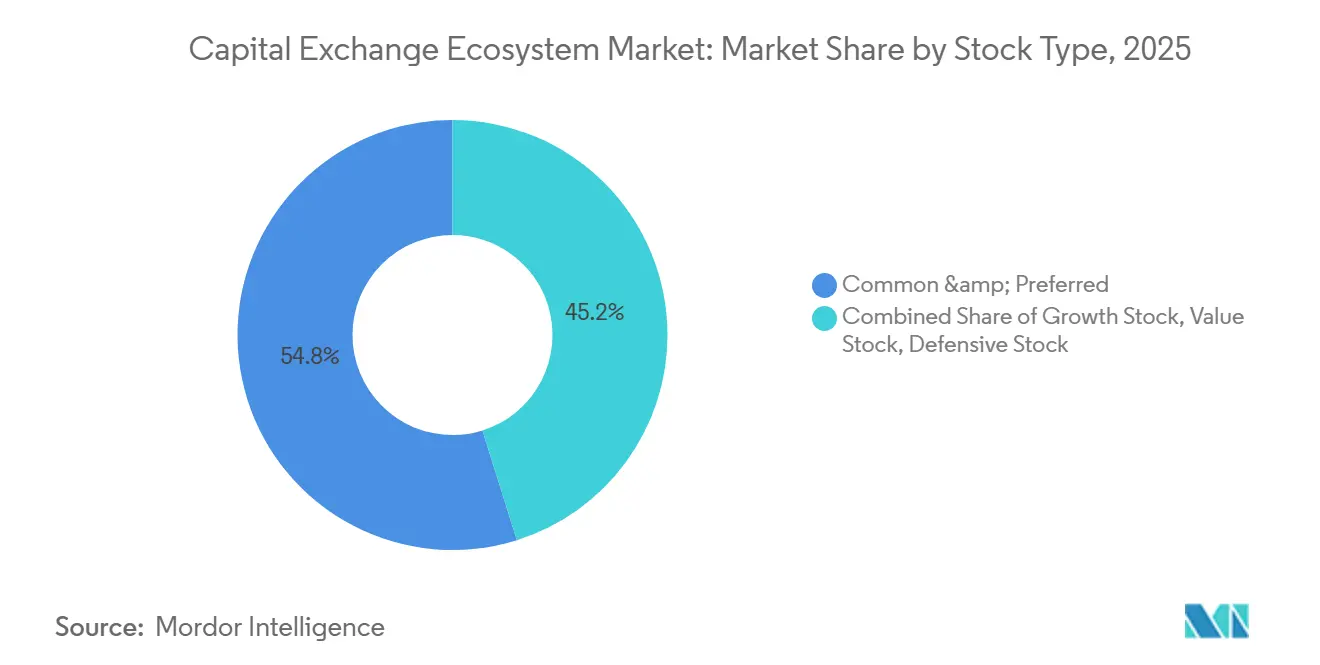
- By stock type, Common & Preferred stock held a 54.84% share of the Capital Exchange Ecosystem in 2025, while Growth Stock is projected to grow at a 9.87% CAGR through 2031.
- By bond type, Government Bonds commanded a 59.36% share of the Capital Exchange Ecosystem in 2025, while Corporate Bonds are forecast to expand at a 10.18% CAGR through 2031.
- By geography, North America held a 37.87% share of the Capital Exchange Ecosystem in 2025, while the Asia-Pacific is projected to grow at a 9.83% CAGR from 2026 to 2031.
Note: Market size and forecast figures in this report are generated using Mordor Intelligence’s proprietary estimation framework, updated with the latest available data and insights as of 2026.
Insights and Trends of Capital Exchange Ecosystem
Drivers Impact Analysis*
| Driver | (~) % Impact on CAGR Forecast | Geographic Relevance | Impact Timeline |
|---|---|---|---|
| Rising retail investor participation through digital platforms | +0.4% | Global, particularly the United States, the United Kingdom, South Korea, India, and China | Short term (≤ 2 years) |
| Growth in index-based passive investment vehicles (ETFs) | +0.3% | North America & Europe core, accelerating in Asia-Pacific | Medium term (2-4 years) |
| Increasing cross-border listings and capital flows | +0.2% | APAC core, spillover to the Middle East, and selective North America inflows | Medium term (2-4 years) |
| Expansion of electronic & algorithmic trading infrastructure | +0.3% | Global, led by the United States and Europe, adoption is rising in APAC | Long term (≥ 4 years) |
| Tokenization of real-world assets enabling fractional trading | +0.2% | United States and Europe early movers, regulatory clarity driving adoption | Long term (≥ 4 years) |
| Integration of ESG data analytics enhances product differentiation | +0.1% | Europe and North America, emerging interest in the Asia-Pacific | Medium term (2-4 years) |
| Source: Mordor Intelligence | |||
Rising Retail Investor Participation Through Digital Brokerage Platforms
Commission-free pricing, fractional share access, and mobile-first experiences helped retail accounts reach 16% of single-stock trading volume by mid-October 2025, reinforcing a structural retail presence in day-to-day liquidity. Regulatory obligations such as the SEC’s strengthened Regulation S-P, which mandates customer notification within 30 days and third-party service provider alerts within 72 hours following a breach, are altering cost structures and platform design choices for brokers that serve retail investors. Competitive moves reflect a race to pair user-friendly front ends with institutional-grade execution, highlighted by Robinhood’s November 2025 joint venture with Susquehanna to build a CFTC-licensed exchange and clearinghouse. Exchanges that streamline onboarding flows and simplify order routing for retail intermediaries can capture an incremental share of order flow as newer cohorts shift from passive saving to active allocation. The Capital Exchange Ecosystem is already absorbing these shifts through higher off-peak volumes and more granular retail data products that brokers and market makers purchase to optimize pricing models[1]Citi Global Perspectives & Solutions, “Retail Trading Volume Analysis,” Citi, citivelocity.com .
Growth in Index-Based Passive Investment Vehicles (ETFs)
Global ETF assets reached USD 13.90 trillion in January 2026, a 30% year-over-year increase, while United States ETF net inflows totaled a record USD 1.48 trillion in 2025, confirming passive vehicles as core building blocks for both retail and institutions. December 2025 became the first month with more than USD 200 billion in ETF inflows, closing at USD 230 billion and reinforcing the momentum into 2026. Active strategies captured a meaningful share of 2025 ETF flows, and product development accelerated as new ETFs launched during the year, with a majority structured as active. Exchanges that list index derivatives or support ETF market-making capture spillover revenue as price discovery concentrates at the index level. European ETF trading expanded strongly, with Deutsche Börse noting growth in 2025 on STOXX indices, which helped Xetra lead European ETF trading. The Capital Exchange Ecosystem benefits when exchanges broaden ETF listings, tighten spreads through designated market maker programs, and roll out related futures and options that hedge ETF exposures [2]Investment Company Institute, “Total ETF Assets and Net Issuance,” ICI, ici.org .
Increasing Cross-Border Listings and Capital Flows
The number of global IPOs rose to 1,293 in 2025 as capital raised increased at a double-digit rate compared to 2024, signalling that issuers are engaging across multiple venues to tap deeper liquidity. Hong Kong rebounded as a primary listing hub in 2025 by admitting 119 IPOs and accelerating specialist frameworks for technology and biotech listings under a streamlined channel. Net cross-border equity flows from the index, and ETF investors provided consistent bid support for large-cap listings as portfolio allocators rebalanced across geographies. Aggregate world market capitalization increased in 2025, with all regions posting double-digit gains, and trading value climbed year over year, showing synchronized participation across time zones. Exchanges that build regulatory bridges and issuer-friendly disclosure templates will capture more dual listings and cross-tradable instruments as pension funds and sovereign investors diversify away from home bias. The Capital Exchange Ecosystem is shifting toward platforms that can reconcile multiple rule sets and currency regimes while preserving straight-through processing for global custodians.
Expansion of Electronic & Algorithmic Trading Infrastructure
Top derivatives and equities venues reported higher average daily volumes into late 2025 as non-United States participation increased and off-session liquidity improved with the rollout of extended hours. United States regulators approved materially longer trading windows at NYSE Arca, and exchanges are preparing 24/7 or near-24/7 capabilities in 2026 for selected products, which will consolidate liquidity around platforms with robust risk controls and resilient systems. CME Group plans to launch 24/7 cryptocurrency trading in May 2026, pending regulatory review, and is pairing round-the-clock execution with a cloud-native data distribution model through its Google Cloud partnership. Nasdaq expanded its listings lead in the United States in 2025 while advancing 23/5 trading pilots and growing Software-as-a-Service revenue tied to surveillance, risk, and market infrastructure. The Capital Exchange Ecosystem rewards exchanges that reduce latency, improve co-location, and add point-in-time datasets that support backtesting and algorithmic model recalibration. Longer sessions are intensifying the arms race in security operations as venues add multi-region redundancy and expand cyber incident playbooks to meet regulator expectations.
Restraints Impact Analysis*
| Restraint | (~) % Impact on CAGR Forecast | Geographic Relevance | Impact Timeline |
|---|---|---|---|
| Regulatory fragmentation across jurisdictions | -0.3% | Global, acute in Europe with many CSDs across countries and time zones | Long term (≥ 4 years) |
| Market volatility and systemic risk concerns | -0.2% | Global, concentrated exposures in AI-linked securities and sovereign debt | Short term (≤ 2 years) |
| Cybersecurity threats escalating exchange operational costs | -0.2% | Global, higher impact in North America and Europe due to regulatory mandates | Medium term (2-4 years) |
| Delayed settlement modernization limiting intraday liquidity | -0.1% | Europe targets T+1 in 2027, Asia-Pacific selective progress, North America completed | Medium term (2-4 years) |
| Source: Mordor Intelligence | |||
Regulatory Fragmentation Across Jurisdictions
An IOSCO review in March 2025 highlighted persistent surveillance and data handling gaps, with many venues noting challenges related to high-frequency trading oversight and the identification of algorithmic execution. Europe’s planned move to T+1 settlement by October 11, 2027, faces exceptional operational complexity due to the region’s many central securities depositories across numerous jurisdictions and time zones. ESMA guidance signaled the need for coordinated technology investments and cross-market testing to prevent settlement fails and to minimize operational risk during the transition. Divergent privacy and cyber obligations across jurisdictions, including the SEC’s breach reporting timeline and the EU’s GDPR and NIS2 requirements, force multinational venues and intermediaries to maintain parallel, costly compliance frameworks. Policy competition also discourages rapid harmonization as markets relax or tighten listing rules to attract issuers, which can create friction for cross-border offerings. The Capital Exchange Ecosystem will continue to see compliance spending trend upward as trading and clearing groups adapt to a patchwork of standards before new convergence paths are established.
Cybersecurity Threats Escalating Exchange Operational Costs
The average cost of a data breach was USD 4.88 million in 2024, highlighting that even a single compromise can materially affect annual budgets for market operators and critical vendors. Enforcement activity in 2025 included multi-million-dollar penalties that reinforced regulators’ expectations for rapid notification, systematic risk assessments, and continuous improvement in cyber controls. Exchanges have increased spending on security operations centers, threat intelligence, and cloud security posture tooling as they expand trading windows and add new digital asset services. Incident tabletop exercises and failover testing are now recurring compliance requirements that demand staffing and tooling at a scale that smaller regional venues can struggle to achieve. These expenses can compress margins for execution while speeding the consolidation of data, clearing, and post-trade functions where scale economics are strongest. The Capital Exchange Ecosystem is likely to see continued mergers or partnerships among mid-sized platforms that face rising cyber and compliance fixed costs [3]IBM Security, “Cost of a Data Breach Report 2024,” IBM, ibm.com .
*Our forecasts treat driver/restraint impacts as directional, not additive. The impact forecasts reflect baseline growth, mix effects, and variable interactions.
Segment Analysis
By Market Composition: Primary Issuance Outpaces Secondary Liquidity
The Secondary Market accounted for 72.35% in 2025, while the Primary Market is projected to grow at 11.68% CAGR between 2026 and 2031, signaling that capital formation is accelerating relative to trading revenue growth. Global issuers returned to public markets as the number of IPOs rose in 2025 and selected hubs simplified listing paths for technology and biotech, lifting the outlook for new issuance. Hong Kong admitted 119 IPOs in 2025 and expanded a specialist channel that improved access for high-growth sectors, which supported a rebound in follow-on activity. The Capital Exchange Ecosystem market is gradually re-weighting toward issuer services such as ESG disclosures, investor relations tooling, and post-listing liquidity support. North American venues also benefited as new listings climbed in 2025, with Nasdaq maintaining its proceeds leadership for the seventh consecutive year. The Capital Exchange Ecosystem market continues to attract follow-on deals as valuations recover and as institutional demand broadens beyond mega-cap leaders.
Secondary trading set new highs in 2025 as aggregate trading value rose year over year and every region recorded its strongest annual level on record. Hong Kong’s average daily turnover reached HKD 249.8 billion (USD 32.0 billion), reflecting a restoration of liquidity depth across sectors. United States derivatives and cash equities volumes rose as CME Group posted a record 2025 average daily volume at 28.1 million contracts and as cash trading widened participation across time zones. Europe’s leading multi-market platform saw cash equity turnover rise in the third quarter of 2025, with market share above 60%, supported by resilient demand for exchange-traded products. The Capital Exchange Ecosystem market is investing in cross-venue liquidity tools and analytics that can convert raw activity into subscription revenue and issuer services. Exchanges recognize that fee compression on execution can be balanced by deeper relationships in listings and post-trade infrastructure over the forecast period [4]CME Group, “CME Group Reports Fourth Quarter and Full Year 2025 Results,” CME Group Investor Relations, investor.cmegroup.com .


By Capital Market: Bond Growth Accelerates Amid Fiscal Expansion
Stocks represented 67.39% of the ecosystem in 2025, while Bonds are projected to grow at an 8.14% CAGR over 2026 to 2031, indicating a shift toward fixed income infrastructure investment. Equity market capitalization expanded in 2025 with every region posting double-digit gains as execution and data services benefited from higher volumes and new product launches. United States equity issuance climbed in 2025, excluding SPACs, with IPO and secondary offering values both rising year over year, which supported issuer services and market data demand. Trading volumes remained robust into early 2026, indicating deep secondary liquidity despite seasonality in issuance windows. The Capital Exchange Ecosystem is adding new index derivatives and ETF-linked products to align with investor preference for building equity exposure at the index level. Liquidity concentration around top venues continues to support investment in co-location and cloud delivery for real-time data.
Fixed income outstanding expanded across major markets during 2024 and 2025, and issuance patterns support the growth outlook for corporate and sovereign listings. United States long-term issuance rose in 2024 across Treasuries, corporate bonds, municipal bonds, and securitized products, while early 2026 issuance volume showed select moderation as issuers timed deals around policy expectations. Daily trading volumes in United States. fixed income increased in early 2026, signaling strong secondary activity even when net supply slowed. The Capital Exchange Ecosystem is channeling resources toward electronic bond platforms, index-linked futures and options, and standardized data services that improve price transparency. The shift in debt mix toward larger sovereign footprints also implies sustained demand for auctions, repos, and clearing for government securities. The Capital Exchange Ecosystem will reflect these allocations as exchanges lean into fixed income platforms that deliver scale and regulatory-grade resilience.
By Stock Type: Growth Equities Dominate Amid Valuation Debates
Common & Preferred Stock commanded 54.84% of the stock segment in 2025, while Growth Stock is projected to grow at a 9.87% CAGR through 2031, extending the momentum of innovation-led sectors. Institutional and retail allocations to higher-growth themes have supported index-level valuations and driven a steady pipeline of new index products and related exchange-traded instruments. Large venues have benefited by launching new indices and expanding data licensing that supports exchange-traded products tied to global growth exposures. The Capital Exchange Ecosystem is adapting product design to align with demand for liquidity, hedging, and targeted sector tilts. Equity valuations reflect a premium for growth assets relative to equal-weighted benchmarks, which shapes where new indices and derivatives are introduced. The Capital Exchange Ecosystem will likely see additional index options and futures linked to technology and innovation clusters as risk management needs evolve.
Value and defensive segments continue to trade at discounts to growth exposures, with small-cap pricing below large-cap multiples according to selected sell-side analyses. Portfolio allocations remain sensitive to rate expectations, inflation dynamics, and productivity gains from artificial intelligence, which supports the durability of growth-focused listings and related derivatives. Exchanges have responded to these patterns with new index launches that capture both regional and thematic exposures. Net inflows to exchange-traded products tracking growth indices were strong into late 2025, which lifted associated data and licensing revenue at listing venues. The Capital Market Exchange Ecosystem industry will continue to add liquidity programs and market-making incentives around these products to sustain tight spreads and promote turnover. The Capital Exchange Ecosystem is positioned to monetize this arc through product breadth and better cross-margining across index options and futures.

By Bond Type: Corporate Issuance Accelerates Post-Pandemic
Government Bonds held a 59.36% share in 2025, while Corporate Bonds are forecast to expand at a 10.18% CAGR through 2031, reflecting an oncoming refinancing cycle and capital expenditure needs. United States Treasury securities outstanding reached USD 30.2 trillion in January 2026, and trading volumes in Treasuries remained high even as net new supply moderated early in the year. United States corporate bonds outstanding grew through the third quarter of 2025, and new issuance in January 2026 rose modestly year over year as secondary trading volumes climbed. The Capital Exchange Ecosystem is channeling investment into corporate bond trading, pre-trade transparency, and standardized reporting that support greater electronic penetration. Municipal securities remained active into early 2026 following a record 2025 as state and local issuers funded infrastructure and climate-linked projects. Exchange operators and fixed income electronic platforms reported higher notional trading in corporate and securitized products in 2025, which raised data, analytics, and clearing revenues.
Mortgage-backed securities and other securitized segments round out bond market composition and contribute to the breadth of instruments that exchanges support through data and clearing. Issuance windows are expected to follow policy cycles and duration positioning among institutions, which implies concentrated periods of heavy listing and trading that benefit venues with elastic capacity. The Capital Exchange Ecosystem size for fixed income-linked data and indices will rise as bond managers seek higher-frequency benchmarks and stress testing datasets. Upcoming corporate refinancing walls through 2030 point to predictable calendars that venues can monetize via price discovery tools and pre-issuance services. Exchanges that scale cross-asset margining and provide flexible connectivity for buy-side desks will be better placed to capture share of wallet. The Capital Exchange Ecosystem continues to tilt toward platforms with robust post-trade and collateral management that can service both government and corporate volumes.
Geography Analysis
North America held a 37.87% share in 2025, while Asia-Pacific is projected to grow at a 9.83% CAGR from 2026 to 2031, which points to a gradual eastward shift in capital formation and liquidity depth. United States derivatives liquidity also set records as CME Group achieved USD 6.5 billion in 2025 revenue and an all-time high of 28.1 million average daily contracts, reflecting both hedging demand and round-the-clock liquidity needs. The United States completed its move to T+1 settlement in May 2024, which improved post-trade efficiency for domestic and cross-border investors. Extended trading proposals and pilot programs moved forward in 2025 and 2026 at NYSE Arca, Nasdaq, and other United States venues, supporting an evolving 24-hour trading framework for selected products. The Capital Exchange Ecosystem in North America is using regulatory credibility and investor protection standards to attract international issuers seeking a predictable rule of law. Canada transitioned to T+1 settlement in May 2024 and continues to focus on derivative and equity listings at TMX, while Mexico’s equity market posted a strong 2025 and prepared for renewed sovereign issuance in 2026, according to regional investor commentary.
In 2025, Euronext reinforced its position as Europe's leading listing venue, reporting 76 admissions and achieving a total market capitalization of EUR 6.7 trillion (USD 7.9 trillion) by December. During the same period, Euronext advanced its cross-border strategy by acquiring a controlling 74.25% stake in the Athens Stock Exchange (ATHEX), effectively integrating the Greek market into its European network. Simultaneously, Deutsche Börse delivered record financial results for 2025, generating net revenue (ex-treasury) of EUR 6,026 million (USD 7,088.4 million) and an EBITDA of EUR 3,512 million (USD 4,131.2 million), reflecting strong performance across its business segments. For 2026, Deutsche Börse projected net revenue (ex-treasury) of EUR 5.7 billion (USD 6.7 billion) and an EBITDA of EUR 3.1 billion (USD 3.6 billion), as outlined in its investor materials. In October 2025, LSEG enhanced its post-trade strategy by securing an investment of GBP 170 million from 11 global banks for a 20% stake in its Post Trade Solutions business, aligning long-term revenue-sharing mechanisms, particularly through updated SwapClear surplus-share terms. Additionally, Europe's transition to a shorter settlement cycle gained traction, with the EU, EEA, UK, and Switzerland collectively targeting 11 October 2027 for mandatory T+1 settlement, supported by coordinated regulatory and industry frameworks.
Asia-Pacific is projected to expand at a 9.83% CAGR over 2026 to 2031 as multiple hubs scale product suites and embrace cloud-native infrastructure that reduces technical debt. China’s primary exchanges recorded higher capitalization and trading value in December 2024, year over year, and the region’s ETF market grew quickly into 2025. Hong Kong reclaimed a top global IPO position in 2025 with 119 listings and also doubled ETF average daily turnover by the end of November 2025, while derivatives and stock options volumes rose. Cash market average daily turnover from January through November 2025 reached HKD 255.8 billion (USD 32.8 billion), which supported liquidity across the cycle. Japan’s outlook for 2026 included continued improvement in return on equity and policy support for AI investment, which may sustain elevated trading and issuance conditions. Singapore Exchange deepened cross-border connectivity through Brazilian Real futures launched with B3 in June 2025. The broader Capital Exchange Ecosystem is benefitting from APAC’s faster adoption of instant or near-instant settlement across selected segments and broader retail participation that lifts off-peak liquidity.
Mordor Intelligence provides coverage of the capital exchange ecosystem across other key regional markets, including Europe, each with their regulatory frameworks and demand patterns. Detailed country-level analysis extends to United Kingdom, India, China, and Hong Kong incorporating local coverage and market participation, as required.

Competitive Landscape
The global capital market exchange ecosystem is moderately concentrated worldwide but shows consolidation within regions as technology and post-trade economics override geographic monopolies. A core group of multi-asset incumbents, including CME Group, Intercontinental Exchange, Nasdaq, LSEG, HKEX, Deutsche Börse, Euronext, Japan Exchange Group, and major Chinese exchanges, maintains leadership through data, clearing, and network effects. Competitive strategies are converging on 24/7 execution for selected asset classes, tokenization pilots, cross-border partnerships, and vertically integrated data and software services that lock in clients. Nasdaq’s 2025 results showed 13% revenue growth, with Software-as-a-Service contributing 38% of annual recurring revenue, and 129 new Financial Technology clients added in the fourth quarter, demonstrating traction in software-led margins. LSEG’s October 2025 post-trade transaction, which brought 11 global banks into its clearing business for a GBP 170 million (USD 210.8 million) investment, illustrated how post-trade franchises command premium valuations. CME Group’s record 2025 volumes and a planned 24/7 crypto trading launch in May 2026, pending regulatory approval, highlight how round-the-clock capabilities define the next battleground for liquidity.
Specialized challengers are targeting underserved niches and geographies, with MIAX Global acquiring The International Stock Exchange in June 2025 and expanding options capacity with MIAX Sapphire. Intercontinental Exchange scaled fixed income electronic trading, reporting record 2025 corporate bond notional, and strong growth in municipal and credit derivatives options activity. Singapore Exchange and B3 established an FX futures corridor for Brazilian Real in June 2025, connecting liquidity pools across time zones and creating a template for future cross-border derivatives corridors. The Capital Exchange Ecosystem also reflects the integration of cloud delivery for live and historical data, with CME Group’s decade-long cloud strategy and European partnerships demonstrating how data access becomes as important as co-location. Exchanges that combine execution with compliance, surveillance, and risk software create sticky client relationships that resist fee compression on pure execution. Post-trade businesses continue to attract capital from strategic clients and banks due to their recurring revenue and regulatory tailwinds.
Digital asset market structure is converging with traditional infrastructure, as exemplified by DTCC’s December 2025 no-action relief to tokenize selected large-cap equities, ETFs, and Treasuries with a launch targeted for the second half of 2026. This institutional-grade bridge positions clearing and settlement utilities at the center of tokenized workflows, while incumbent exchanges test revenue opportunities in round-the-clock crypto derivatives and tokenization-related data services. Robinhood’s November 2025 move to build a CFTC-licensed exchange and clearinghouse with Susquehanna signaled that fintechs aim to vertically integrate and compete on both distribution and infrastructure. Euronext initiated a share buyback in November 2025 after reporting higher turnover and margins, underscoring confidence in its multi-market model. The Capital Exchange Ecosystem is likely to see continued convergence of on-exchange and off-exchange liquidity, with real-time risk and collateral mobility as differentiators. Exchange groups that pair innovative product design with robust governance and cyber resilience will be positioned to capture greater share as global capital pools reallocate in 2026 and beyond.
Leaders of Capital Exchange Ecosystem
CME Group Inc.
Intercontinental Exchange Inc.
Nasdaq Inc.
London Stock Exchange Group plc
Hong Kong Exchanges & Clearing Ltd.
- *Disclaimer: Major Players sorted in no particular order

Recent Industry Developments
- February 2026: Intercontinental Exchange launched institutional-grade Polymarket Signals data products and CoinDesk cryptocurrency futures contracts, expanding its digital assets ecosystem to compete with CME Group’s planned 24/7 crypto trading launch scheduled for May 29, 2026. This move reflects exchanges’ strategic pivot toward round-the-clock volatility products as retail and institutional demand for digital asset derivatives surges globally.
- January 2026: B3 completed PicPay’s USD 434 million IPO, Brazil’s first new listing since 2021, signaling renewed capital markets activity in Latin America following two years of drought. The offering’s success indicates that policy stability can restore issuer confidence in emerging economies.
- November 2024: Nasdaq completed acquisition of Adenza's risk management technology for USD 10.5 billion, expanding regulatory technology capabilities and creating integrated compliance solutions for global financial institutions seeking comprehensive risk oversight.
- November 2025: Robinhood Markets announced a joint venture with Susquehanna on November 25, 2025, to create a CFTC-licensed derivatives exchange and clearinghouse, challenging incumbents by integrating retail-facing mobile distribution with institutional-grade market infrastructure.
- June 2025: Singapore Exchange and B3 launched Brazilian Real futures on June 9, 2025, establishing the first FX futures corridor between Singapore and Brazil, with SGX reporting USD 4.5 trillion in FX futures volumes over the trailing twelve months through May 2025.


Scope of Report on Capital Exchange Ecosystem
The capital market consists of traded stocks, which further consists of traded securities, the mutual fund industry, and exchange-traded funds. The capital market acts as a place where financial investments can be acquired or disposed of. Stock exchanges act as a medium where these issued shares and bonds are traded.
The capital exchange ecosystem is segmented by market composition, capital market, stock type, and bond type. By market composition, the market is sub-segmented into primary market and secondary market. By capital market, the market is sub-segmented into the stock market and bond market. By stock type, the market is sub-segmented into common and preferred stock, growth stock, value stock, defensive stock, and others. By bond type, the market is sub-segmented into government, corporate, municipal, mortgage, etc. The report offers market size and forecasts for the capital exchange ecosystem in terms of revenue (USD) for all the above segments.
| Primary Market |
| Secondary Market |
| Stocks |
| Bonds |
| Common & Preferred Stock |
| Growth Stock |
| Value Stock |
| Defensive Stock |
| Government Bonds |
| Corporate Bonds |
| Municipal Bonds |
| Mortgage-backed Bonds |
| Other Bond Types |
| North America | Canada |
| United States | |
| Mexico | |
| South America | Brazil |
| Peru | |
| Chile | |
| Argentina | |
| Rest of South America | |
| Europe | United Kingdom |
| Germany | |
| France | |
| Spain | |
| Italy | |
| BENELUX (Belgium, Netherlands, Luxembourg) | |
| NORDICS (Denmark, Finland, Iceland, Norway, Sweden) | |
| Rest of Europe | |
| Asia-Pacific | India |
| China | |
| Japan | |
| Australia | |
| South Korea | |
| South-East Asia (SG, MY, TH, ID, VN, PH) | |
| Rest of Asia-Pacific | |
| Middle East & Africa | United Arab Emirates |
| Saudi Arabia | |
| South Africa | |
| Nigeria | |
| Rest of Middle East & Africa |
| By Market Composition | Primary Market | |
| Secondary Market | ||
| By Capital Market | Stocks | |
| Bonds | ||
| By Stock Type | Common & Preferred Stock | |
| Growth Stock | ||
| Value Stock | ||
| Defensive Stock | ||
| By Bond Type | Government Bonds | |
| Corporate Bonds | ||
| Municipal Bonds | ||
| Mortgage-backed Bonds | ||
| Other Bond Types | ||
| By Geography | North America | Canada |
| United States | ||
| Mexico | ||
| South America | Brazil | |
| Peru | ||
| Chile | ||
| Argentina | ||
| Rest of South America | ||
| Europe | United Kingdom | |
| Germany | ||
| France | ||
| Spain | ||
| Italy | ||
| BENELUX (Belgium, Netherlands, Luxembourg) | ||
| NORDICS (Denmark, Finland, Iceland, Norway, Sweden) | ||
| Rest of Europe | ||
| Asia-Pacific | India | |
| China | ||
| Japan | ||
| Australia | ||
| South Korea | ||
| South-East Asia (SG, MY, TH, ID, VN, PH) | ||
| Rest of Asia-Pacific | ||
| Middle East & Africa | United Arab Emirates | |
| Saudi Arabia | ||
| South Africa | ||
| Nigeria | ||
| Rest of Middle East & Africa | ||


Key Questions Answered in the Report
What is the Capital Market Exchange Ecosystem size in 2026 and its growth outlook to 2031?
The Capital Market Exchange Ecosystem size is USD 1.17 trillion in 2026, and it is projected to reach USD 1.53 trillion by 2031 at a 5.48% CAGR.
Which segments lead and which are growing fastest within the Capital Market Exchange Ecosystem?
In 2025, the Secondary Market led with 72.35% share, while the Primary Market is projected to grow at 11.68% CAGR through 2031; Stocks held 67.39% share with Bonds expected to grow at 8.14% CAGR, and Corporate Bonds are forecast to expand at 10.18% CAGR.
Which region currently leads and which region is expanding fastest in the Capital Market Exchange Ecosystem?
North America held 37.87% share in 2025, while Asia-Pacific is projected to be the fastest growing region at 9.83% CAGR from 2026 to 2031.
What are the main drivers of growth for the Capital Market Exchange Ecosystem?
Key drivers include rising retail participation through digital brokers, surging ETF assets and net inflows, more cross-border listings and flows, and expansion of electronic and algorithmic infrastructure including extended trading hours.
What structural trends are shaping competition among exchanges in 2026?
Venues are prioritizing 24/7 trading pilots, tokenization initiatives in post-trade, cross-border partnerships, and vertical integration into data, software, and clearing to offset fee compression on execution.
How is cybersecurity affecting exchange economics and strategy?
Higher breach costs and stricter notification rules are raising fixed costs for security operations, which pressures margins at smaller venues and accelerates consolidation into scaled platforms with stronger post-trade and data franchises.
Page last updated on:


