
Europe Clearing Houses and Settlements Market Size and Share
Market Overview
| Study Period | 2020 - 2031 |
|---|---|
| Forecast Data Period | 2026 - 2031 |
| Base Year Market Size (2025) | USD 2.05 Quadrillion |
| Market Size (2026) | USD 2.08 Quadrillion |
| Market Size (2031) | USD 2.24 Quadrillion |
| Growth Rate (2026 - 2031) | 1.52 % |
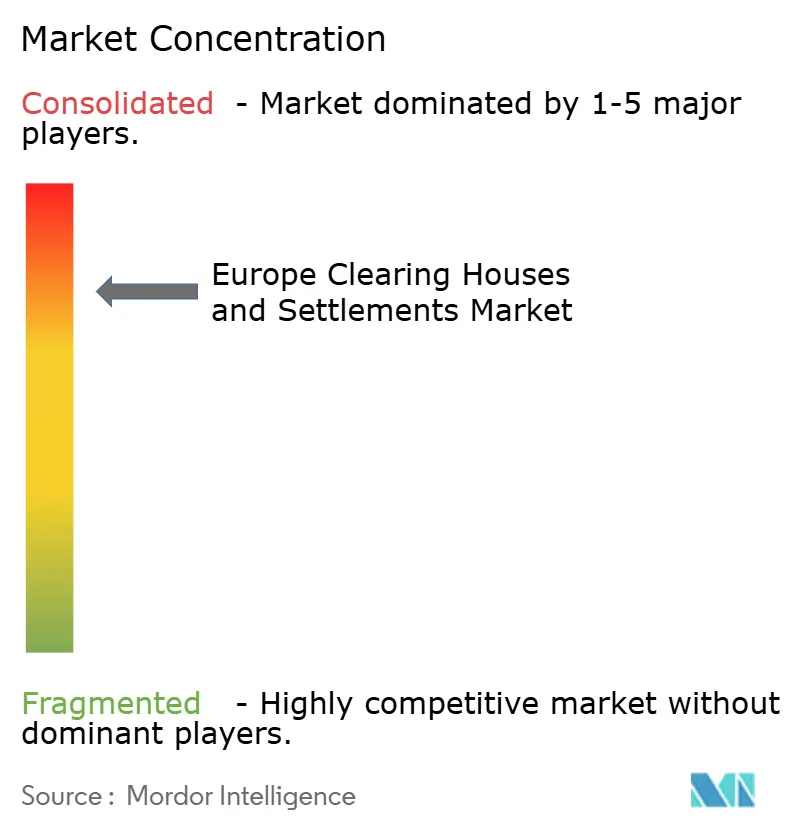
| Market Concentration | High |
Major Players *Disclaimer: Major Players sorted in no particular order Image © Mordor Intelligence. Reuse requires attribution under CC BY 4.0. | |
Europe Clearing Houses and Settlements Market Analysis by Mordor Intelligence
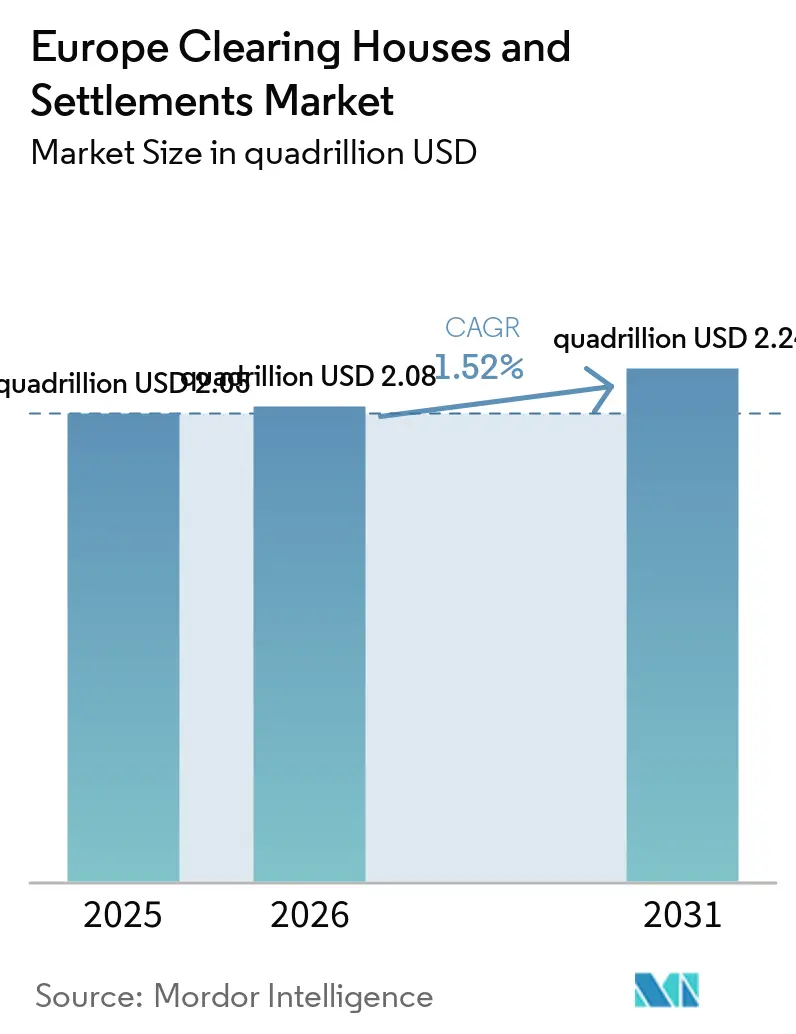
The European clearing houses and settlements market size was valued at USD 2.05 quadrillion in 2025 and estimated to grow from USD 2.08 quadrillion in 2026 to reach USD 2.24 quadrillion by 2031, at a CAGR of 1.52% during the forecast period (2026-2031). Rising investment in regulatory-led automation, rapid migration to T+1 settlement cycles, and the European Central Bank’s consolidation of TARGET Services underpin this expansion[1]. Stress-testing results published by ESMA in 2024 exposed concentration risks at major central counterparties, forcing incumbents to upgrade risk engines and deepen capital buffers, thereby reinforcing high entry barriers. Simultaneously, Basel III end-game collateral rules that took effect in January 2025 are channelling bilateral derivatives flows into central clearing, widening the revenue base for leading platforms. Digital-ledger pilots under the EU DLT-Pilot Regime add another structural tailwind by unlocking smart-contract clearing use cases now being trailed in Germany and the Netherlands.
Key Report Takeaways
- By type, outward clearing houses held 55.74% of the Europe clearing houses and settlements market share in 2025, inward clearing houses are projected to expand at a 7.32% CAGR through 2031, the fastest within the type segmentation.
- By service, TARGET2 captured 41.32% of the Europe clearing houses and settlements market size in 2025, SEPA services are forecast to grow at a 6.49% CAGR to 2031, the highest within the service segmentation.
- By participant type, banks commanded 65.05% of the Europe clearing houses and settlements market size in 2025, payment service providers are set to grow at an 8.23% CAGR through 2031, outpacing all other participant groups.
- By geography, the United Kingdom commanded 18.62% of the European clearing houses and settlements market size in 2025, and the Nordics are set to grow at a 5.87% CAGR through 2031.
Note: Market size and forecast figures in this report are generated using Mordor Intelligence’s proprietary estimation framework, updated with the latest available data and insights as of 2026.
Europe contributes to a system defined not by any single geography but by the interaction of many. The global clearing houses and settlements market data by Mordor Intelligence represents that combined structure.
Europe Clearing Houses and Settlements Market Trends and Insights
Drivers Impact Analysis*
| Driver | (~) % Impact on CAGR Forecast | Geographic Relevance | Impact Timeline |
|---|---|---|---|
| Mandatory migration to T+1 settlement cycles | +2.1% | EU-wide, early adoption in Germany and France | Medium term (2-4 years) |
| ECB consolidation of TARGET Services | +1.8% | Eurozone, extending to DKK and other currencies | Short term (≤ 2 years) |
| Pan-European ETF & derivatives volume surge | +1.4% | Frankfurt and Amsterdam hubs | Long term (≥ 4 years) |
| Basel III collateral rules | +1.2% | EU and UK, spillover to Switzerland | Short term (≤ 2 years) |
| DLT-based smart-contract clearing pilots | +0.9% | Germany, the Netherlands, and France | Long term (≥ 4 years) |
| ESG-linked repo demand | +0.7% | Nordics, Germany, Netherlands | Medium term (2-4 years) |
| Source: Mordor Intelligence | |||
Mandatory Migration to T+1 Settlement Drives Infrastructure Modernization
ESMA confirmed in January 2025 that all EU trading venues must adopt T+1 settlement by October 11, 2027, creating the single largest operational overhaul since TARGET2-Securities went live. Euroclear and Clearstream, two prominent central securities depositories, have allocated substantial financial resources to enhance straight-through-processing capabilities. These upgrades are designed to address the challenges posed by compressed settlement timelines. Industry stakeholders project that these advancements will lead to a measurable reduction in settlement failures, particularly as shorter settlement cycles contribute to improved liquidity management and operational efficiency. Faster post-trade windows also intensify collateral turnover, presenting fresh revenue opportunities for clearing houses that can integrate margin and settlement in near real time. The transition compels buy-side firms to automate trade affirmation within hours, accelerating demand for standardized ISO 20022 messaging across the entire value chain.
ECB TARGET Services Consolidation Enhances Cross-Border Efficiency
The Eurosystem Collateral Management System (ECMS) launched in June 2025, merging national collateral pools into a single platform and extending TARGET services to Danmarks Nationalbank for DKK processing[2]. Real-time collateral mobility replaces a patchwork of bilateral agreements, cutting cross-border processing costs by 15-20% for major banks. Instant-payment rails built on TIPS now settle both EUR and DKK within seconds, spawning new service lines for clearing houses able to orchestrate intraday liquidity. The ECB roadmap foresees onboarding additional non-eurozone currencies by 2027, potentially diverting volumes away from legacy correspondent networks. A unified infrastructure also lays technical foundations for digital euro settlement, intensifying the strategic relevance of pan-European clearing platforms.
Pan-European ETF Growth Accelerates Central Clearing Demand
European ETF assets under management exceeded EUR 2.3 trillion (USD 2.69 trillion) in 2024, with a material share tied to ESG indices, driving up derivatives hedging volumes that must clear centrally[3]. Euronext’s “Innovate for Growth 2027” roadmap commits EUR 300 million (USD 351 million) to extend clearing coverage across its seven exchange venues, underscoring scale imperatives. Spiking cross-border arbitrage activity demands intraday margin recalculations that only high-capacity CCPs can perform efficiently. Concentration among Eurex Clearing and LCH creates meaningful economies of scale, pressuring smaller regional CCPs. Market feedback indicates that efficient ETF margin offsets can shave 8-10 basis points from the total cost of ownership, reinforcing client migration toward platforms offering sophisticated cross-product netting.
Basel III Implementation Reshapes Collateral Management
As of January 2025, the European Union's implementation of Basel III end-game rules has increased initial margin requirements for non-cleared derivatives, driving a pronounced shift toward centrally cleared transactions. The United Kingdom's planned adoption in January 2026 introduces regulatory divergence, creating a temporary arbitrage opportunity that multi-jurisdictional clearing houses are leveraging through passported services. LCH has upgraded its margin-efficiency suite to enable real-time netting of cross-asset positions, significantly reducing gross collateral requirements. The heightened demand for higher credit-quality collateral, particularly government bonds, is fostering profitable securities-lending opportunities for Central Counterparties (CCPs) operating within integrated repo markets. Internal projections indicate that collateral optimization revenues are likely to experience consistent annual growth through 2027, supported by Basel-driven market dynamics.
Restraints Impact Analysis*
| Restraint | (~) % Impact on CAGR Forecast | Geographic Relevance | Impact Timeline |
|---|---|---|---|
| COBOL-based legacy systems slow ISO 20022 roll-out | -1.3% | Germany, Italy, Spain | Medium term (2-4 years) |
| ESMA systemic-risk stress tests raise capital buffers | -0.8% | EU-wide | Short term (≤ 2 years) |
| Divergent UK EMIR 3.0 versus EU EMIR 3.0 rules | -0.9% | UK–EU cross-border | Long term (≥ 4 years) |
| High TIPS integration costs for small CSDs | -0.6% | Eastern Europe | Medium term (2-4 years) |
| Source: Mordor Intelligence | |||
Legacy System Dependencies Constrain Modernization Pace
Many European banks still rely on mainframe COBOL cores dating back decades, complicating ISO 20022 conversion efforts and throttling straight-through processing gains. Deutsche Bank disclosed in Q3 2024 that full migration will extend into 2026 because of deep integration touchpoints with payment engines. According to industry estimates, the cumulative costs associated with migration are exerting a disproportionate financial burden on tier-2 and tier-3 lenders. The declining availability of skilled COBOL programmers is driving up labor expenses and extending project completion timelines, creating additional operational challenges. Furthermore, clearing houses are required to maintain dual-protocol gateways to accommodate the transition, which diminishes the anticipated network efficiency benefits of universal ISO 20022 adoption. This dual-protocol requirement highlights inefficiencies and adds complexity to the migration process, further straining resources within the financial ecosystem.
Post-Brexit Rule Divergence Complicates Cross-Border Clearing
Effective January 2025, UK EMIR 3.0 introduces an Active Account Requirement, obligating UK clearing members to maintain active positions at EU Central Counterparties (CCPs). This regulatory change is expected to result in significant annual compliance costs for major firms, as they adapt their operations to meet the new requirements[4]. Simultaneously, EU EMIR 3.0 has different collateral haircuts and reporting templates, forcing dual compliance teams and systems. This divergence elevates legal and operational complexity, elongating onboarding cycles for new clients. Clearing houses with multi-jurisdictional footprints incur incremental legal costs yet can harvest market share by offering harmonized support tools. Medium-term, policy makers may revisit equivalence to ease frictions, but current misalignment suppresses cross-border efficiency.
*Our forecasts treat driver/restraint impacts as directional, not additive. The impact forecasts reflect baseline growth, mix effects, and variable interactions.
Segment Analysis
By Type: Outward Clearing Dominance Reflects Cross-Border Integration
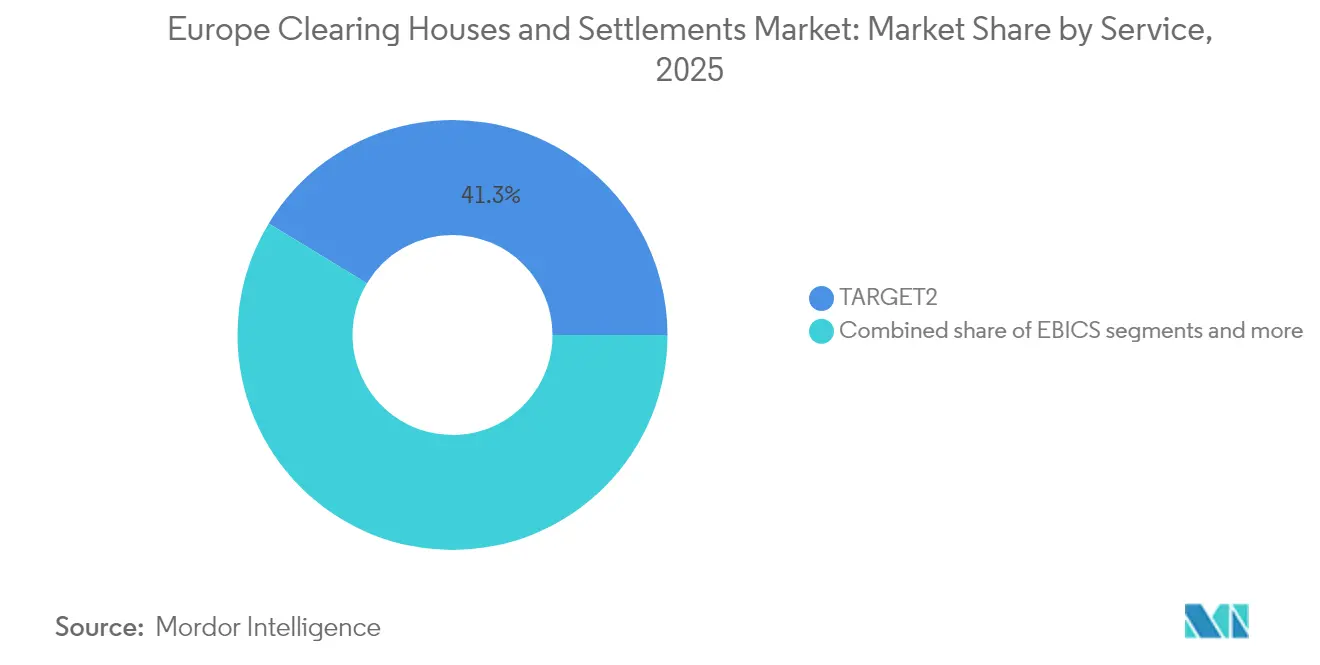
Outward clearing houses captured 55.74% of the European clearing houses and settlements market share in 2025, reflecting their scale advantages in processing high-volume cross-border trades. The European clearing houses and settlements market size contribution from inward clearing is projected to climb at a 7.32% CAGR as domestic settlement complexities mount under T+1 rules. Outward providers benefit from standardized workflows and multi-currency risk engines that lower marginal processing costs, enabling competitive pricing for pan-European trading firms. Inward operators, by contrast, capitalize on local regulatory familiarity and niche asset-class expertise, justifying premium fees on lower volumes. ECB’s ECMS rollout harmonizes collateral workflows, neutralizing some scale disadvantages for inward houses and enabling hybrid models combining local presence with cross-border reach.
Clients increasingly demand consolidated risk dashboards that aggregate outward and inward exposures seamlessly, prompting leading platforms to offer “clearing-as-a-service” modules. Technology budgets now allocate to artificial-intelligence-driven predictive analytics that spot intraday liquidity pinch points. Brexit has further amplified outward volume as UK firms route euro-denominated derivatives via EU hubs, boosting Frankfurt and Paris traffic. Meanwhile, Nordic inward houses leverage strong domestic digitization to attract regional equities and green bond clearing. The competitive frontier is shifting toward value-added collateral optimization and integrated reporting, areas where outward and inward houses that converge capabilities stand to gain a disproportionate share.

By Service: TARGET2 Leadership Faces SEPA Innovation Challenge
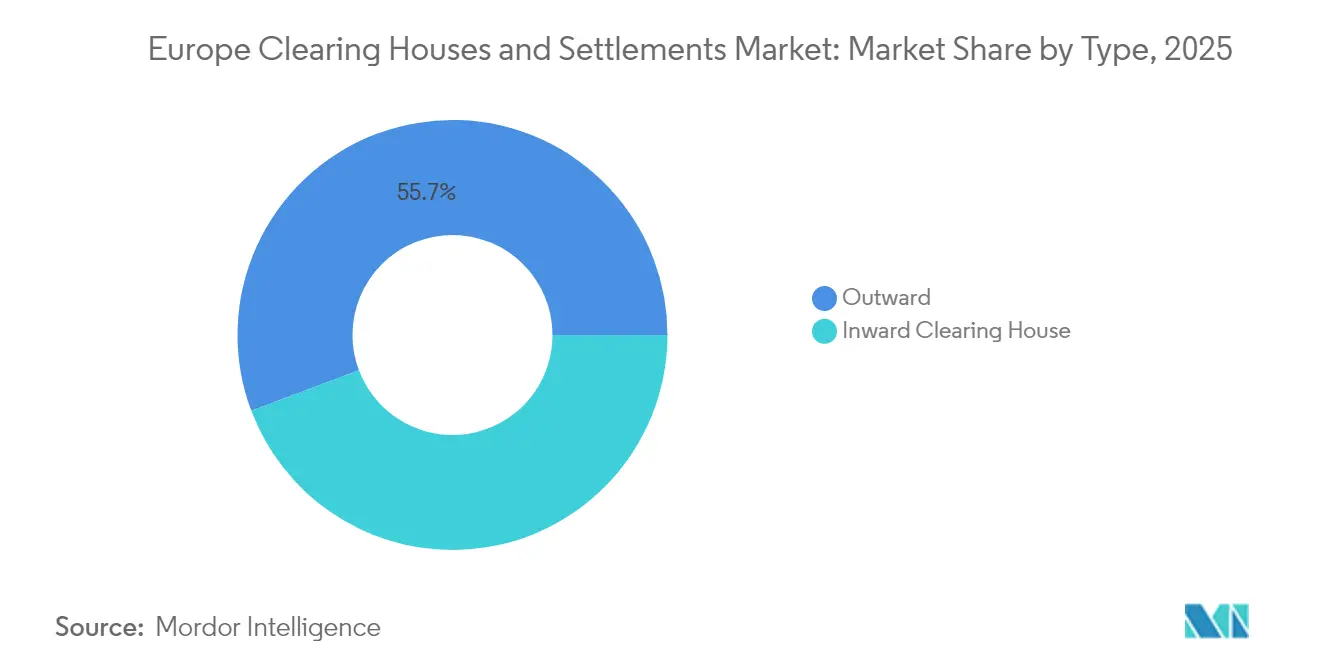
In 2025, TARGET2 emerged as a critical infrastructure for processing high-value payments across Europe, contributing to 41.32% of the total market size for clearing houses and settlements. This dominance underscores its pivotal role in facilitating financial transactions within the region. Concurrently, SEPA instant-payment volumes are anticipated to experience robust CAGR through 2031. This growth trajectory is primarily attributed to the enforcement of new EU regulations, which require the widespread adoption of instant euro transfers, thereby driving innovation and efficiency in the payments ecosystem. Clearing houses that embed TIPS gateways and fraud analytics can monetize rising volume by levying micro-fees on each transaction. EBICS retains a defensive niche among large corporates reliant on high-capacity batch files, while DLT-based services remain emergent.
The European clearing houses and settlements market continues to pivot toward real-time retail flows, requiring CCP-grade resilience in low-value transactions. TARGET2 modernization includes cloud-native modules to maintain relevance even as central-bank digital-currency pilots advance. SEPA’s momentum is centered on user experience, favoring API-first clearing platforms capable of embedding settlement in merchant checkouts. Regulatory capital charges are lighter for payment rails versus derivatives clearing, encouraging non-bank PSPs to enter, thereby broadening the competitive field. Integration of DKK and prospective non-euro currencies into TIPS will further dilute TARGET2’s share but expand the aggregate market pie.
By Participant Type: Banks Maintain Control While PSPs Drive Growth
Banks accounted for 65.05% of the Europe clearing houses and settlements market share in 2025 because prudential rules require robust capital backing for clearing membership. Payment service providers, unburdened by legacy branch networks, are set to grow at an 8.23% CAGR, leveraging PSD2-driven open-banking rails. Brokers remain indispensable in complex derivatives, but margin pressures spur them to outsource operational clearing to platform providers. Other participants, including pension funds, now seek direct CCP access to reduce intermediation costs, a trend facilitated by sponsored-access models.
The Europe clearing houses and settlements market rewards balance-sheet strength, yet technology agility dictates growth. PSPs harness cloud-native cores for rapid product iteration, enticing e-commerce and fintech clients. Banks respond by white-labelling clearing APIs to defend wallet share. Regulatory capital formulas still favor banks for large-ticket exposures, but forthcoming CRR III revisions may level the field for well-capitalized PSPs. Hybrid participation models that aggregate smaller PSP flows under bank sponsorship emerge as a compromise, broadening access while preserving systemic safeguards.
Geography Analysis
The United Kingdom retained 18.62% of the European clearing houses and settlements market in 2025, leveraging London’s entrenched liquidity pools even after Brexit. Germany and France jointly anchor Eurozone clearing, benefitting from proximity to the ECB and deep sovereign-bond markets that feed collateral flows. Nordic countries post the fastest 5.87% CAGR through 2031, propelled by advanced digital infrastructure and the June 2025 integration of DKK into TARGET Service.
BENELUX jurisdictions, especially the Netherlands, act as regulatory sandboxes for DLT pilots, attracting fintech-focused clearing volumes. Spain and Italy lag on ISO 20022 migration owing to legacy cores, yet EU structural funds earmarked for fintech upgrades could narrow the gap post-2026. Eastern European states in the “Rest of Europe” bloc show emergent demand as EU accession prospects and capital-market reforms expand settlement needs, although TIPS integration costs remain a barrier.
Cross-border rule divergence shapes geographic dispersion. EU location policies coax euro-denominated swaps away from London, yet global multi-currency trades continue to clear at UK CCPs. Nordic houses exploit ESG leadership, providing sustainable-finance clearing services that command premium spreads. Regional specialization therefore acts as both a moat and a catalyst, reinforcing the necessity for scalable but modular clearing architectures.
The clearing houses and settlements market is analyzed by Mordor Intelligence across multiple other geographies. This is complemented by country-specific insights for United States, reflecting various localized market behavior and policy environments' coverage.
Regulatory Landscape
The European clearing houses and settlements market runs under a multi-layer framework led by ESMA for CCP supervision and the Eurosystem for settlement in central bank money through TARGET Services. A key anchor is Regulation (EU) 2024/2987 (EMIR 3.0), which seeks stronger EU CCP resilience and reduced reliance on third-country Tier 2 CCPs, tightening governance, risk-management, and reporting obligations for major infrastructures.
Implementation is now in monitored execution: the Active Account Requirement (AAR) RTS became effective on 26 February 2026, introducing demonstrable EU CCP clearing activity thresholds for in-scope entities. ESMA has also expanded oversight through a Joint Monitoring Mechanism, with a first annual report published in 2026 and an interim AAR effectiveness report in June 2026. Alongside these clearing-focused measures, the EU-wide move to T+1 by October 11, 2027 (confirmed by ESMA in January 2025) and the ongoing TARGET Services consolidation by the ECB, including the ECMS go-live in June 2025, increases compliance pressure around straight-through processing, collateral mobility, and operational resilience across CCPs, CSDs, and participant firms.
Value Chain Analysis
The value chain runs from trading venues and participants (banks, brokers, buy-side, and PSPs) through pre-settlement affirmation and messaging, then into central clearing at CCPs (margining, default management, and risk mutualization), followed by settlement in CSDs with cash legs in central bank money via TARGET2 and related TARGET Services. In Europe, fragmentation across national infrastructures and account structures adds cost and complexity, so interoperability layers (messaging standards, gateways, and harmonized corporate actions processing) shape end-to-end throughput and settlement-fail outcomes.
Most re-engineering is tied to T+1 readiness ahead of the October 2027 deadline, driving investment into automation of allocations, confirmations, and standing settlement instructions, along with tighter coupling between clearing and settlement to support intraday margin and collateral cycles. The competitive structure also reflects integrated operator models, such as Euronext operating five CSDs (Denmark, Italy, Norway, Portugal, and Greece). Meanwhile, pan-European providers such as Euroclear and Clearstream support cross-border settlement and collateral services that feed directly into CCP margin workflows and, increasingly, ECB-led collateral mobility through ECMS.
Competitive Landscape
Five leading platforms—Euroclear, Clearstream, Eurex Clearing, LCH, and SIX x-clear—jointly hold a significant share of the European clearing houses and settlements market, establishing formidable economies of scale. Capital-intensive regulatory compliance further insulates incumbents, with ESMA’s 2024 stress tests compelling sizable capital top-ups. Vertical integration proliferates as clearing houses acquire data analytics firms to embed value-added services, exemplified by Eurex’s investment in HQLAX for blockchain-enabled collateral management.
Technology-led partnerships dominate strategic agendas. Euroclear collaborates with cloud providers to run settlement nodes on distributed infrastructure, promising sub-millisecond latency for high-frequency trading clients. Clearstream advances AI-based anomaly detection to pre-empt settlement-fail risks, a feature increasingly demanded by asset managers wary of T+1 penalties. Medium-sized CCPs explore merger options to attain scale or niche down into specialized asset classes such as freight or carbon credits.
Regulatory focus on resilience channels 10-15% of operating budgets into cybersecurity and disaster recovery. While this diverts capital from fee-reducing initiatives, it differentiates platforms able to demonstrate Tier-4 data-center redundancy. Competitive pricing remains fierce, yet incumbents leverage integrated collateral, data, and reporting suites to offset list-price declines. White-space opportunities persist in digital-asset clearing, ESG-linked derivatives, and real-time cross-currency settlements, segments where regulatory frameworks are still crystallizing and first-mover advantage could re-order rankings.
Europe Clearing Houses and Settlements Industry Leaders
-
Euroclear
-
Clearstream
-
LCH Group
-
SIX x-clear & Euronext Securities (combined)
-
DTCC EuroCCP
- *Disclaimer: Major Players sorted in no particular order
Market Opportunities and Future Outlook
A near-term opportunity is emerging in settlement-model choice and cross-border CSD competition, anchored by Euronexts confirmed go-live date of 21 September 2026 for its alternative CSD settlement model for equities and ETPs in Amsterdam, Brussels, and Paris. The program operationalizes client choice between Euronext Securities and incumbent domestic or international CSD options (including Euroclear entities and Clearstream), creating room for providers that can bundle onboarding, interoperability, and corporate-actions standardization into a lower-friction switching experience.
T+1 implementation workstreams through the October 2027 EU deadline expand demand for industrialized post-trade automation across the chain, particularly in SSI data quality, intraday exception management, and near-real-time collateral workflows that connect CCP margin calls to CSD settlement and central bank money. At the same time, EMIR 3.0 execution and monitoring, including the AAR RTS effective 26 February 2026 and ESMA monitoring outputs in 2026, increases the value of EU-authorized clearing access, data and reporting toolkits, and multi-jurisdiction operational support, which can help infrastructures and service providers manage the cost of dual compliance across EU and UK post-Brexit rule sets.
Recent Industry Developments
- June 2026: Clearstream enabled securities issued on its D7 DLT-based issuance platform to become eligible as collateral in the Eurosystem Collateral Management System (ECMS). The linkage between tokenized issuance and central bank collateral workflows strengthens the business case for DLT-enabled post-trade services within core Eurosystem plumbing and can accelerate adoption by participants that need central bank liquidity optionality.
- April 2026: DTCC announced a collaboration with SSImple to automate Standing Settlement Instructions (SSIs) for custodians supporting Europes transition to T+1. Automating SSI creation and maintenance targets a major operational failure point in compressed settlement cycles, improving readiness for the October 2027 EU deadline and reinforcing DTCCs role in European post-trade risk reduction.
- March 2026: LCH RepoClear and Clearstream expanded their collaboration to enable settlement of cleared Dutch government debt through Clearstreams pan-European CSD solution, live as of 16 March 2026. The enhancement deepens cleared repo settlement connectivity for a core European collateral asset class and supports higher-throughput clearing and settlement workflows as collateral mobility and intraday liquidity management become more central.
Research Methodology Framework and Report Scope
Market Definition and Coverage
For this report, the market covers the value of clearing and settlement activity handled by financial market infrastructure in Europe, where transactions are confirmed, risk is managed, and transfers are finalized through recognized clearing and settlement workflows.
Scope exclusions: The sizing excludes trading venue revenues, broker commissions, and banking lending income that sit outside post-trade clearing and settlement processing.
Segmentation Overview
- By Type
- Outward Clearing House
- Inward Clearing House
- By Service
- TARGET2
- SEPA
- EBICS
- Other Services
- By Participant Type
- Banks
- Investment & Clearing Brokers
- Payment Service Providers (PSPs)
- Others
- By Geography
- United Kingdom
- Germany
- France
- Spain
- Italy
- BENELUX (Belgium, Netherlands, Luxembourg)
- NORDICS (Denmark, Finland, Iceland, Norway, Sweden)
- Rest of Europe
Data Sources, Market Sizing, and Validation
Desk Research
Desk work starts with aligning what is counted as clearing and what is counted as settlement across Europe, so the same rules are applied in every country. We referred to public sources such as ESMA publications, ECB TARGET Services and payment statistics, BIS CPMI market infrastructure material, and Eurostat financial sector series to anchor definitions and activity measures.
Next, we built the input sheet using annual reports, regulatory disclosures, and official statistics that point to transaction volumes, settlement activity trends, and service adoption timelines. Supporting context was added using reputable press and association websites. We also used selective paid subscriptions for company financials and intelligence, patent search, and import and export shipment-level checks where relevant. The examples of desk sources listed here are not exhaustive, and other public documents were used to collect, validate, and clarify data points.
Primary Interviews and Surveys
Primary inputs were used to test desk assumptions and to understand how value is captured across CCP clearing, CSD settlement, and payment settlement rails used in Europe. We spoke with infrastructure operators, direct participants, technology and operations specialists, and regulatory or risk experts across main European financial centers so pricing logic, volume drivers, and policy impacts could be confirmed. We then carried the agreed assumptions into the model consistently.
Distribution of primary research fieldwork respondents
| Company type | Respondent position |
|---|---|
| Top tier: 33% | CXOs: 13% |
| Mid tier: 45% | Functional/Unit leaders: 30% |
| Smaller Players: 22% | Managers: 57% |
Market-Sizing & Forecasting
Sizing is primarily built using a top-down and bottom-up approach, where system-level settlement and clearing activity is first reconstructed from published European infrastructure statistics. We then convert those activity totals into market value using consistent value-per-activity assumptions. Totals are corroborated with selective bottom-up checks, such as sampled fee ranges by service rail, channel checks on price resets, and cross-checks against disclosed post-trade income lines where they are comparable.
Inputs that mattered in this market include settlement volume direction by rail, throughput and average value patterns, readiness signals tied to faster settlement cycles, shifts linked to TARGET Services consolidation, and rule changes that can redirect more flows into central clearing. For forecasting, scenario analysis is used so policy timing and migration pace can be flexed, and then the final path is matched to the rollout sequence described by primary respondents. Where a data series is not consistently available by country or service, we use conservative proxies based on nearby markets, then re-test through follow-up expert checks before locking in the series.
Data Validation & Update Cycle
Validation is done through repeated checks where model outputs are compared against independent activity signals, and reviewed for spikes that do not align with known events, policy dates, or published volume changes. If a variance is material, assumptions are revisited, and respondents are re-contacted so the driver is explained clearly rather than treated as a modeling artifact.
Before sign-off, the work goes through multi-step analyst review that checks scope alignment, math, and year-to-year logic, followed by a final pass to reflect the latest public releases. Reports are refreshed annually, with interim updates made when a material regulatory, infrastructure, or market-structure change is observed.
Mordor Intelligence's Europe Clearing Houses and Settlements Market Estimate Compared With Other Published Estimates
Published market sizes for clearing houses and settlements in Europe often diverge because firms do not always size the same thing, even when the title looks similar. The gaps usually come from the unit being measured, the base year and currency timing, and how strongly policy and infrastructure migrations are assumed to change activity during the forecast window.
Some published figures appear to be built mainly from service-provider revenue and fee lines, which can compress the total if activity-linked value is not reconstructed rail by rail. Mordor Intelligence counts clearing and settlement activity value using system statistics and service-rail mapping, while trading venue revenues and broker commissions are kept outside scope.
Benchmark comparison
| Source | Market Size | Gaps in Research Methodology |
|---|---|---|
| Mordor Intelligence | USD 2.05 T (2025) | |
| Regional Consultancy A | USD 2.01 T (2024) | Uses an earlier base year and applies a different rollout timing for infrastructure modernization, which shifts how much later-year activity is captured in the conversion to value. |
| Trade Journal B | USD 2.22 T (2030) | Publishes a forward-year point estimate with limited visibility on service-mix weighting and currency timing, so the same activity signals can translate into a different value level. |
Across the three figures, most of the spread is explained by whether the calculation is anchored to activity measures or to fee and revenue reporting, and by how migration timing is handled in the forecast years. By keeping conversion steps tied to observable clearing and settlement signals and then checking assumptions through expert feedback, the final number stays traceable and repeatable.
Key Questions Answered in the Report
What is the projected value of the European clearing houses and settlements market in 2031?
The market is forecast to reach USD 2.24 quadrillion by 2031, growing at a 1.52% CAGR during 2026-2031.
How will T+1 settlement affect post-trade operations?
T+1 implementation is expected to reduce settlement fails significantly and increase demand for straight-through processing and real-time collateral management.
Which service segment is expanding fastest?
SEPA instant-payment services lead growth, advancing at a 6.49% CAGR through 2031 on the back of EU instant-payment mandates.
Why are payment service providers gaining share?
PSPs leverage open-banking regulations and cloud-native technology to offer agile, cost-efficient clearing access, supporting an 8.23% CAGR through 2031.
What role does Basel III play in shaping collateral flows?
Basel III end-game rules elevate initial margin on non-cleared derivatives, pushing more transactions into central clearing and boosting collateral-optimization revenues for CCPs.
Which region is growing fastest within Europe?
Nordic countries post the highest regional CAGR at 5.87% owing to advanced digital infrastructure and harmonized regulatory frameworks.