
Hospitality and Tourism
13th MayUnlocking Saudi Arabia’s Regional Tourism Growth Potential
5 Min Read
The Asia-Pacific Casino Gambling Market Report is Segmented by Type (Live Casino, Baccarat, Blackjack, Poker, Slots, Other Casino Games), Facility Format (integrated Resort Casinos, Stand-Alone Land-Based Casinos, Riverboat Casinos, Cruise-Ship Casinos, Racinos), Ownership Structure (Commercial, Tribal/Indigenous, State-Run), and Geography (India, China, and More). The Market Forecasts are Provided in Terms of Value (USD).
Market Overview
| Study Period | 2019 - 2030 |
|---|---|
| Base Year For Estimation | 2024 |
| Forecast Data Period | 2025 - 2030 |
| Market Size (2025) | USD 59.14 Billion |
| Market Size (2030) | USD 117.07 Billion |
| Growth Rate (2025 - 2030) | 7.24 % CAGR |
| Market Concentration | Medium |
Major Players *Disclaimer: Major Players sorted in no particular order. Image © Mordor Intelligence. Reuse requires attribution under CC BY 4.0. |
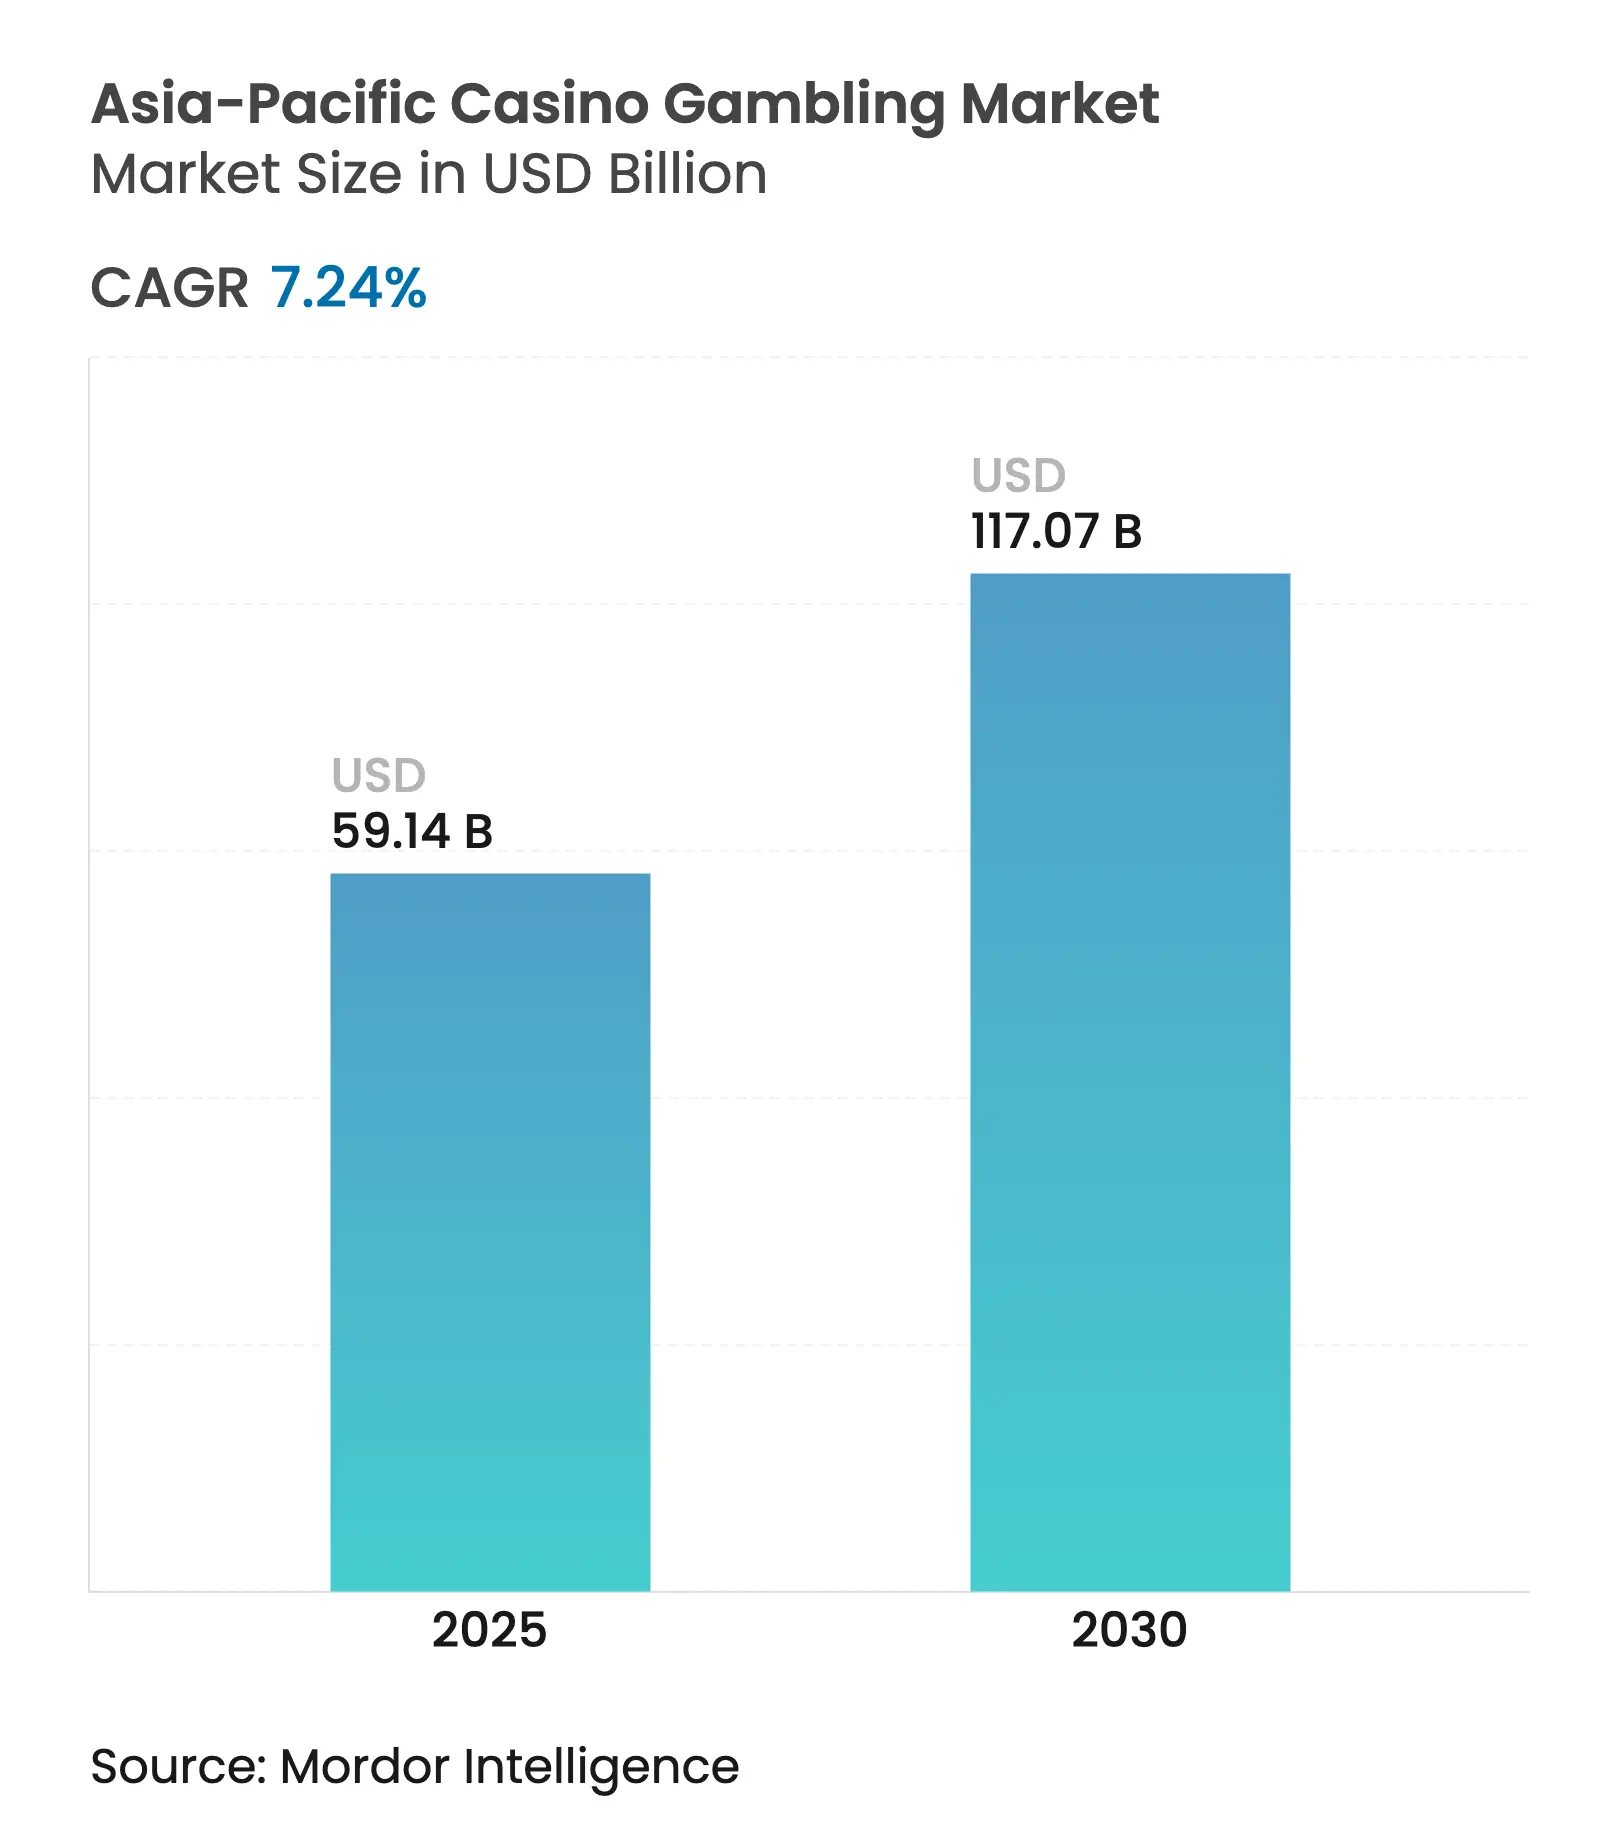
The Asia-Pacific casino gambling market size reached a market size of USD 59.14 billion in 2025 and is projected to double to USD 117.07 billion by 2030, reflecting a forecast CAGR of 14.63% over the period. Growth is being propelled by the sharp post-pandemic rebound in international tourism, the roll-out of integrated resort (IR) legislation in new jurisdictions, and steady gains in discretionary incomes across the region. Macau continues to anchor regional revenues, but Japan, Thailand, and South Korea are opening fresh development pipelines that will diversify demand while intensifying competition. Operators are pivoting toward the premium-mass customer segment, a strategic shift that supports margin expansion and reduces dependence on volatile junket business models. At the same time, technology investments, particularly AI-driven pit management and customer analytics, are raising table yields and strengthening compliance reporting. The Asia-Pacific casino gambling market is therefore poised for sustained momentum provided that regulatory clarity keeps pace with capital deployment needs [1]Ben Blaschke, “Fitch forecasts Macau's GDP growth at 6.90% in 2025 on 'slower gaming tourism recovery',” GGRAsia, ggrasia.com.
Key Report Takeaways
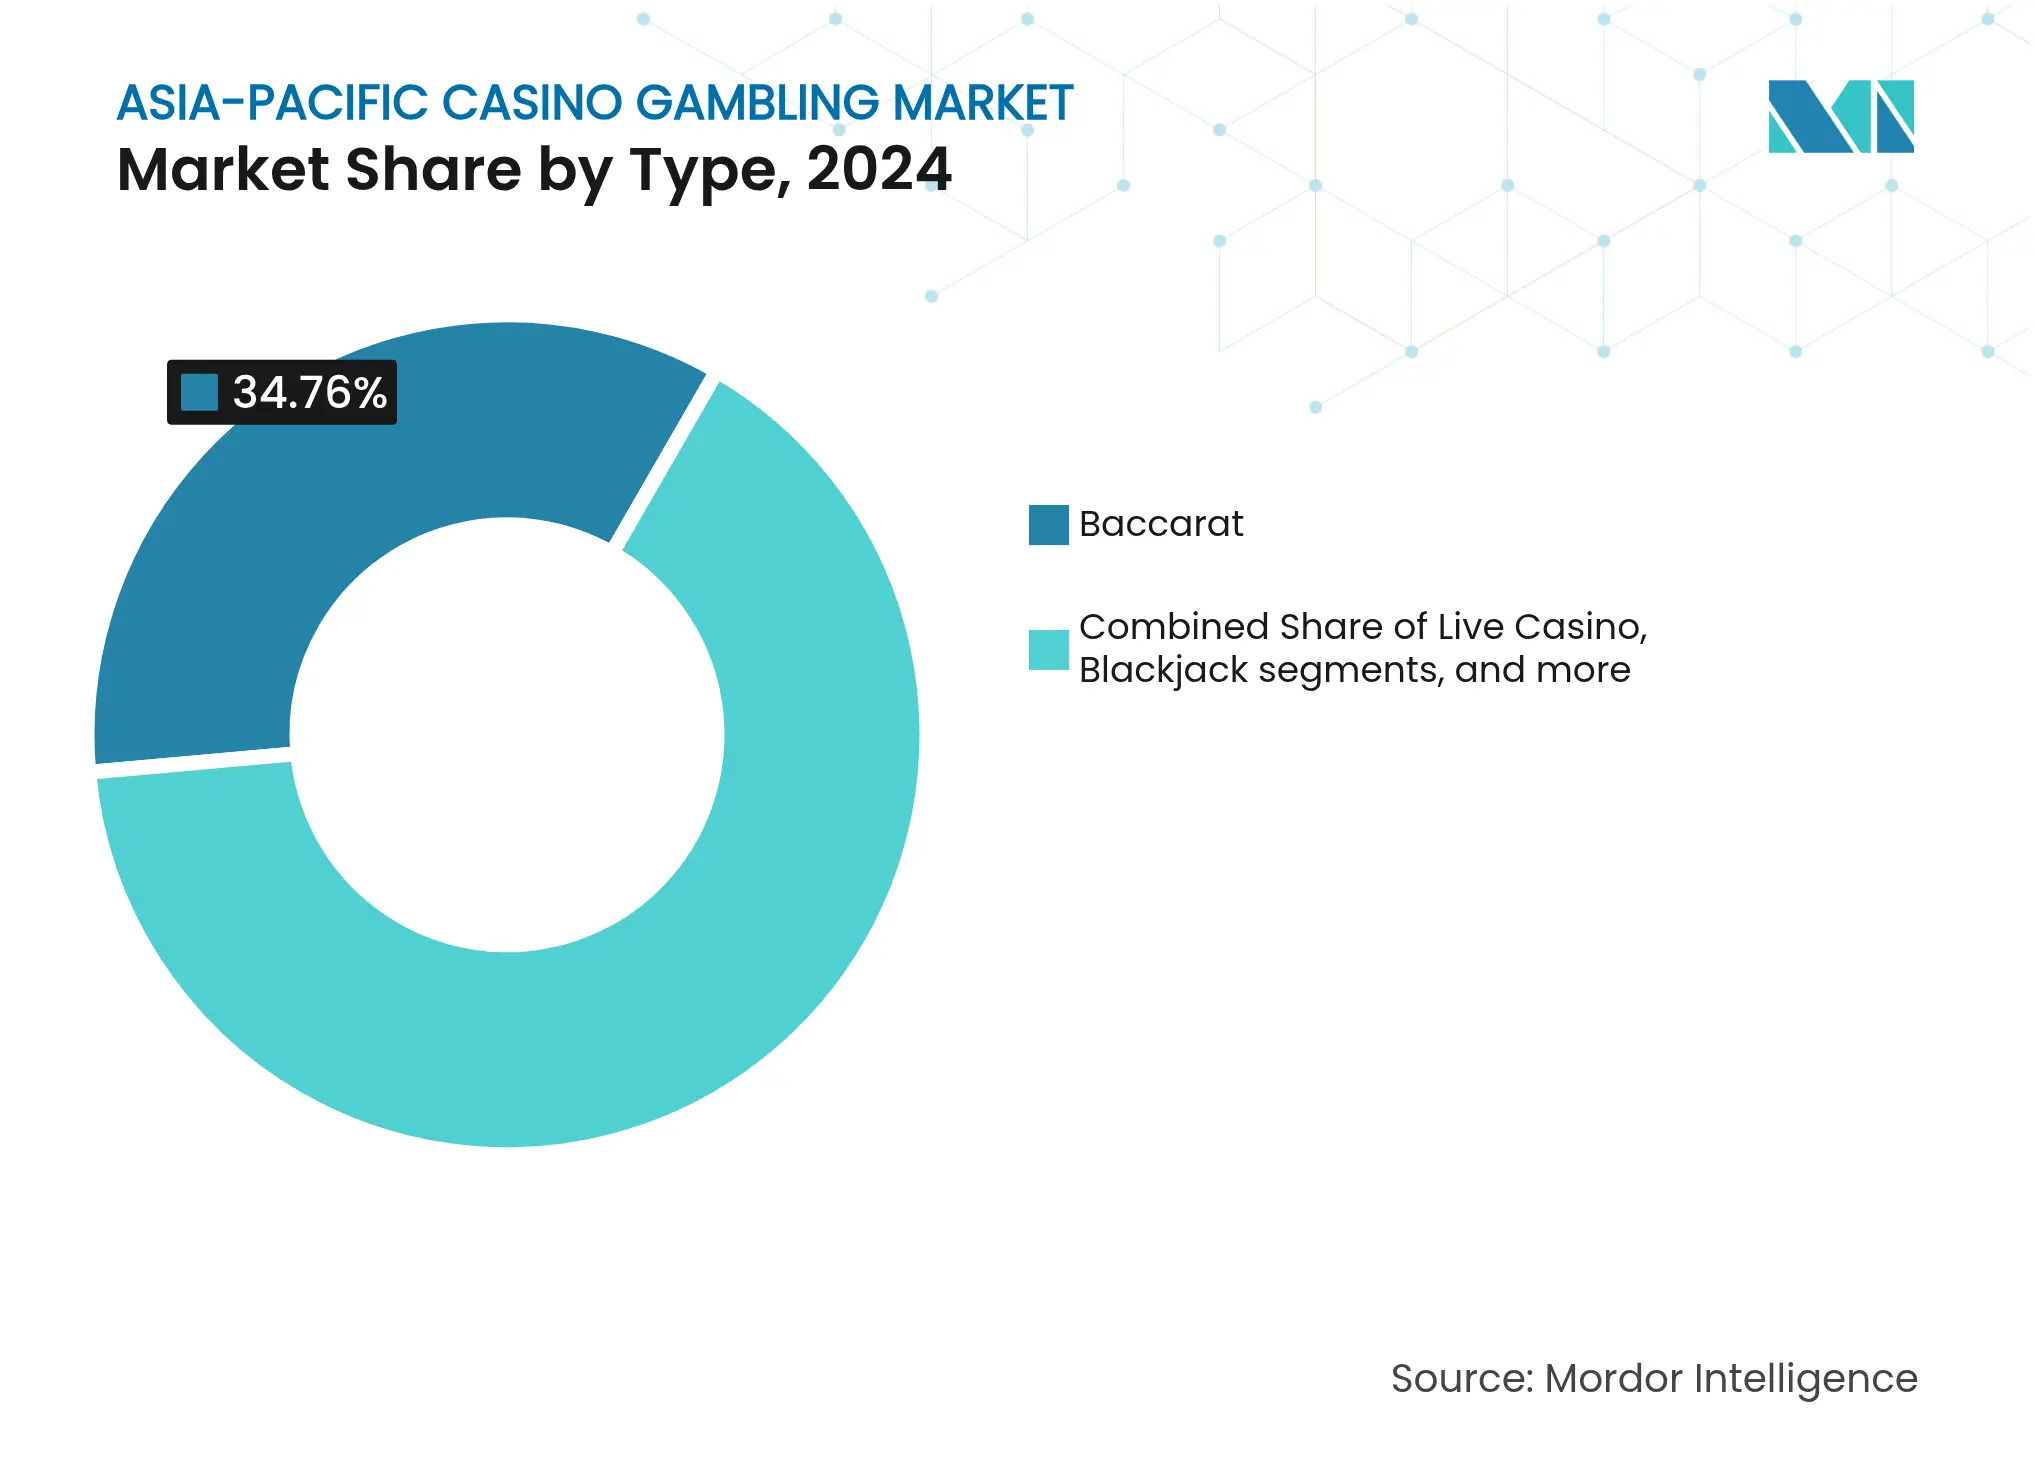
By game type, baccarat led with 34.76% of the Asia-Pacific casino gambling market share in 2024, while live casino games are forecast to expand at an 11.16% CAGR through 2030.
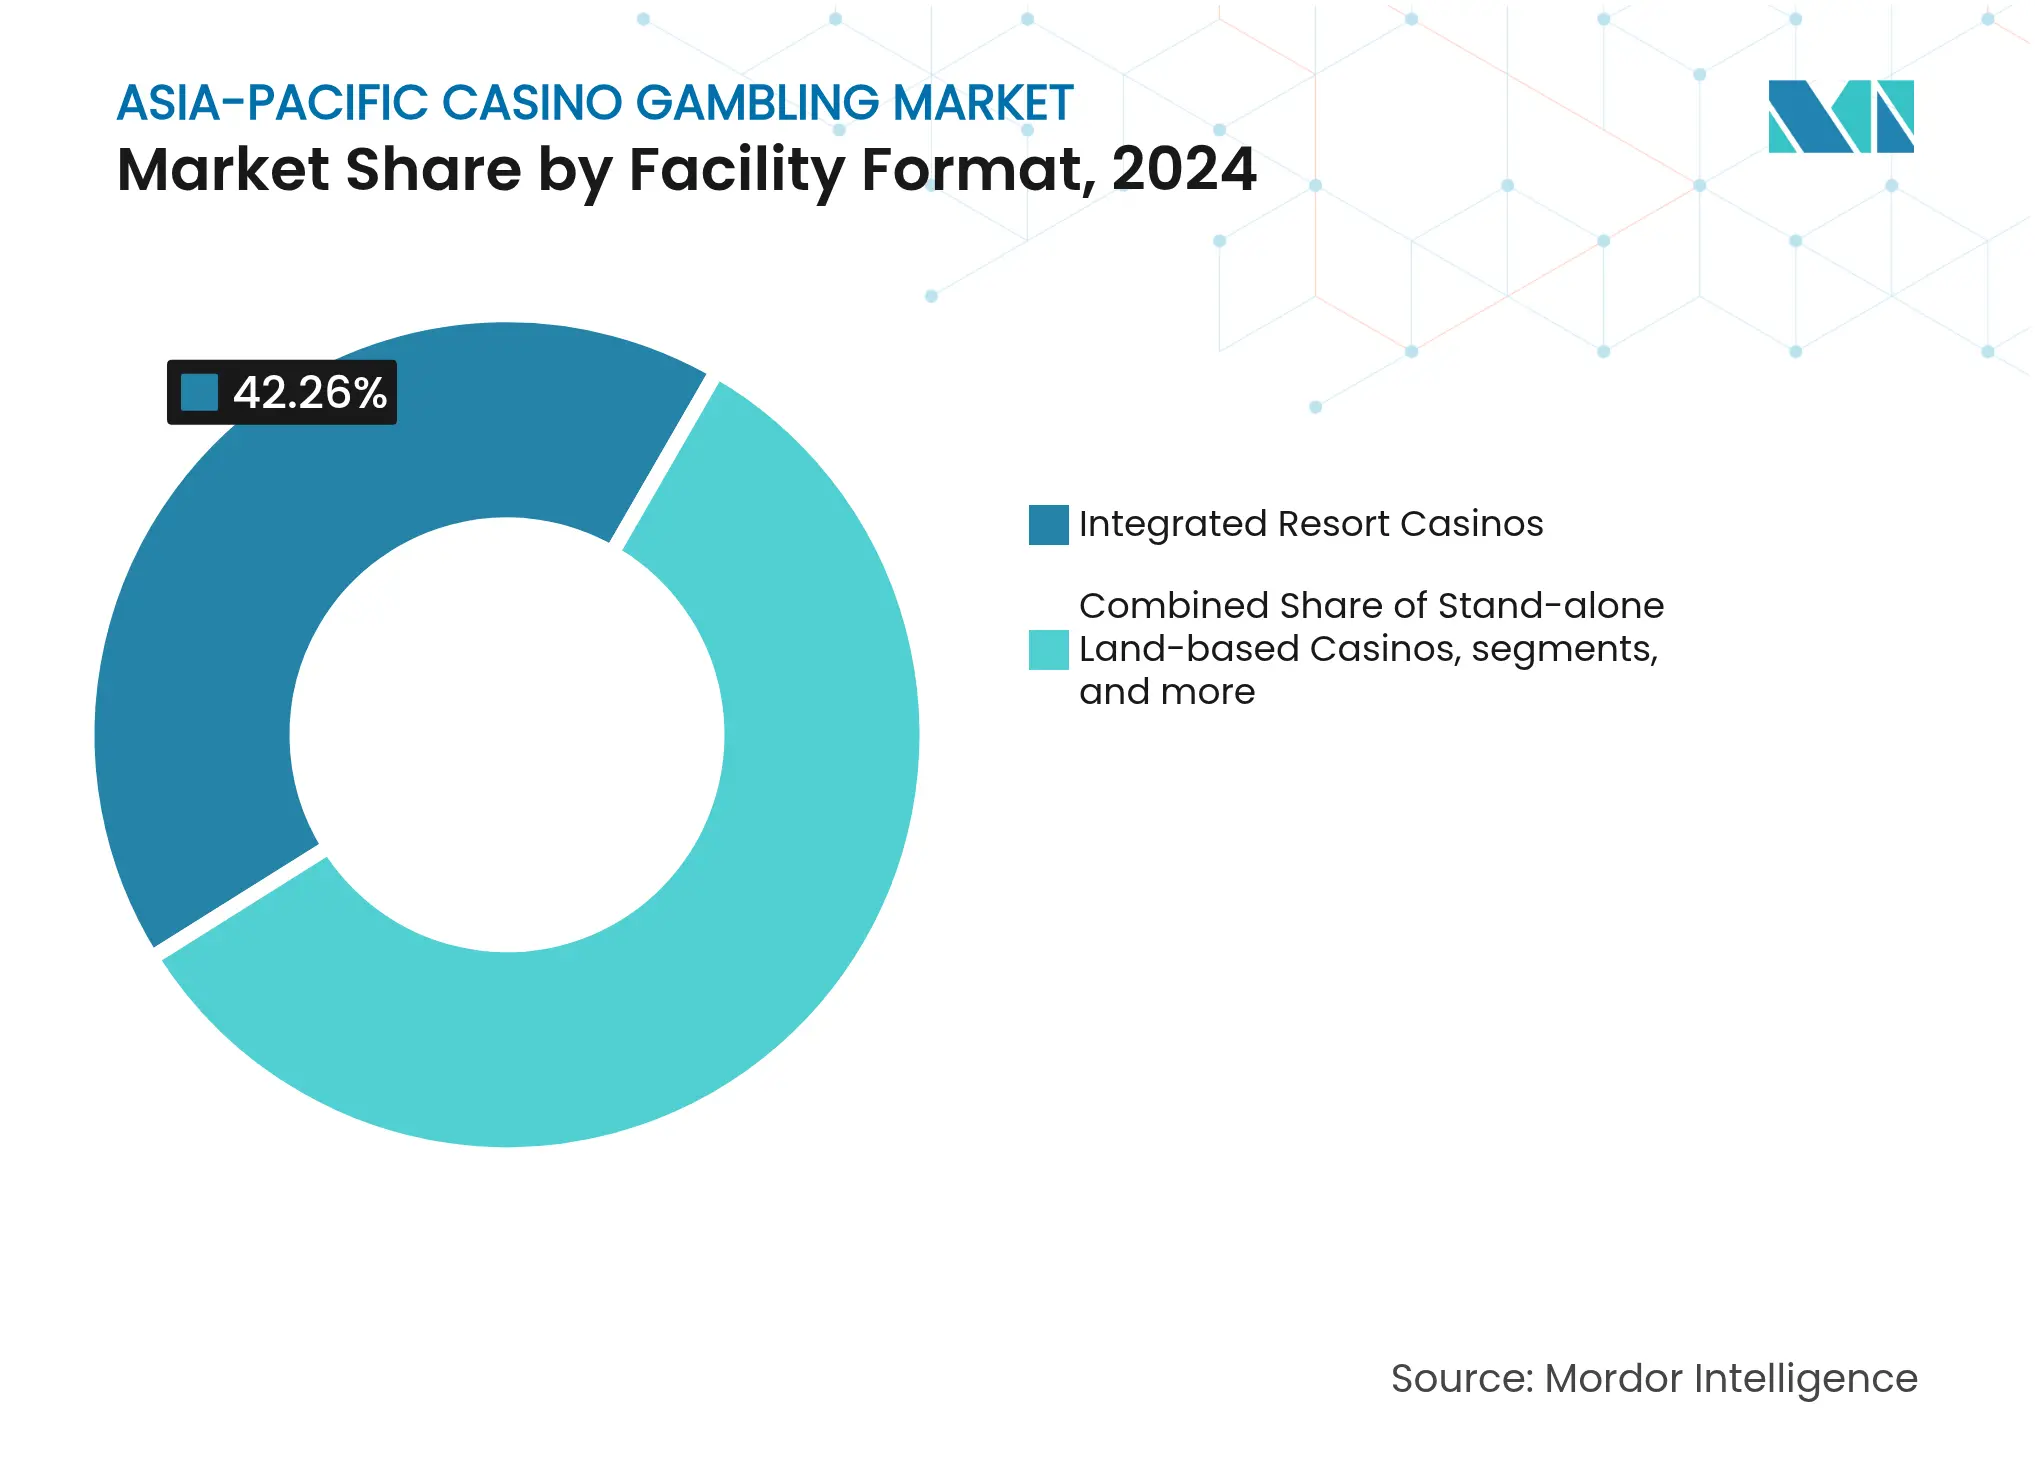
By facility format, integrated resort casinos accounted for 42.26% of the Asia-Pacific casino gambling market size in 2024 and are advancing at a 10.18% CAGR to 2030.
By ownership structure, commercial operators captured 65.27% of the Asia-Pacific casino gambling market share in 2024; state-run properties record the highest projected CAGR at 9.33% through 2030.
By geography, China commanded 56.24% of the Asia-Pacific casino gambling market size in 2024, whereas Japan is projected to post a 14.24% CAGR between 2025 and 2030.
Note: Market size and forecast figures in this report are generated using Mordor Intelligence's proprietary estimation framework, updated with the latest available data and insights as of 2026.
Drivers Impact Analysis
| Driver | (~) % Impact on CAGR Forecast | Geographic Relevance | Impact Timeline | |||
|---|---|---|---|---|---|---|
Post-pandemic rebound in inbound tourism
flows
Post-pandemic rebound in inbound tourism
flows
| +3.2% | APAC core, spill-over to MEA | Short term (≤ 2 years) | (~) % Impact on CAGR Forecast:
+3.2%
|
Geographic Relevance
:
APAC core, spill-over to MEA
|
Impact Timeline
:
Short term (≤ 2 years)
|
Expansion of integrated resort casino
legislation
Expansion of integrated resort casino
legislation
| +2.8% | Japan, Thailand, Korea | Medium term (2-4 years) | |||
Rising disposable incomes &
middle-class growth
Rising disposable incomes &
middle-class growth
| +2.1% | APAC core, emerging markets | Long term (≥ 4 years) | |||
AI-enhanced table-game analytics boosting
yields
AI-enhanced table-game analytics boosting
yields
| +1.4% | Global, APAC leadership | Medium term (2-4 years) | |||
Emergence of "premium-mass"
customer segment
Emergence of "premium-mass"
customer segment
| +1.8% | Macau, Singapore, emerging IRs | Medium term (2-4 years) | |||
Convergence with on-site esports arenas
Convergence with on-site esports arenas
| +0.9% | Global, younger demographics | Long term (≥ 4 years) | |||
| Source: Mordor Intelligence | ||||||
Post-pandemic Rebound in Inbound Tourism
International visitor flows recovered faster than expected, with the World Travel & Tourism Council reporting that total inbound arrivals across Asia-Pacific surpassed 2019 levels by Q4 2024. Casino operators benefited immediately because foreign guests generate multiple times the gaming spend of domestic patrons. Macau, for instance, regained 81% of its 2019 gaming revenue by 2025, and policymakers project that elevated tourism taxes will fund public-health and infrastructure upgrades. Singapore’s Changi Airport recorded 62 million passenger movements in 2025, narrowing the gap with its pre-pandemic high and driving incremental traffic to Marina Bay Sands and Resorts World Sentosa. Japan logged an 11.60% uplift in international arrivals after reopening, setting the stage for Osaka IR to leverage fresh tourism flows when doors open in 2030. Across Australia, inbound tourism’s rebound dovetailed with state-level marketing grants that amplified visitation to Crown Melbourne and The Star Sydney. Sustained tourism momentum is therefore expected to underpin revenue consistency across the Asia-Pacific casino gambling market.
Expansion of Integrated-Resort Legislation
Governments across the region are liberalizing casino laws to catalyse tourism receipts and create employment multipliers. Japan’s IR Basic Policy approved a USD 8.6 billion investment for Osaka’s project, stipulating comprehensive responsible-gaming safeguards and a minimum non-gaming revenue threshold. Thailand’s parliament advanced draft legislation that earmarks five economic-zone licences, each requiring a minimum capital of THB 100 billion (USD 2.8 billion) with at least 30% derived from non-gaming facilities. South Korea increased foreigner-only licences outside Jeju to diversify regional tourism and ease casino reliance on Chinese VIP demand. Legislated IR frameworks deliver predictable 20-year tenures, enabling operators to secure long-dated financing at lower spreads. The capital-intensive nature of IR development also creates high entry barriers that protect incumbents while elevating property quality benchmarks across the Asia-Pacific casino gambling market.
Rising Disposable Incomes
The Asian Development Bank projects that 352 million new middle-class consumers will emerge across the region before 2034, lifting discretionary spend on entertainment and travel. India has already crossed 400 million domestic air passengers in 2025, a 21% rise above 2019 levels, supporting Goa and Sikkim’s offshore-and-land-based venues. China’s median urban household income hit CNY 79,000 in 2024 (USD 12,400), underpinning growth in premium-mass visitation to Macau and Singapore. Rising wages also reshape consumer expectations: guests demand upscale dining, retail, and entertainment, prompting operators to widen non-gaming footprints to 60-plus percent of property revenues. This consumption pivot dovetails with governments’ ambition to shift casino earnings from tax-intensive VIP halls to more stable mass-market revenue. Consequently, sustained income expansion remains a structural driver for the Asia-Pacific casino gambling market.
AI-Enhanced Table-Game Analytics
All six Macau concessionaires implemented radio-frequency identification (RFID) chips and computer-vision cameras by 2024, enabling real-time player tracking and automated odds optimization. Early adopters report 6-8% gains in table hold rates, with incremental EBITDA uplift offsetting rising labor and compliance costs. AI algorithms integrate facial-recognition screening that satisfies updated anti-money-laundering protocols while accelerating customer onboarding. Dynamic dealer scheduling systems cut idle time by 12% at properties like Galaxy Macau, while predictive maintenance elongates equipment lifecycles. In parallel, AI-driven marketing engines generate personalized offers that elevate visit frequency among premium-mass players. As smaller operators follow suit to avoid competitive lag, capex cycles will intensify but yield operational efficiencies that support the Asia-Pacific casino gambling market’s long-term margins[2]AUSTRAC Media Team, “AUSTRAC accepts enforceable undertaking from Crown Melbourne,” AUSTRAC, austrac.gov.au.
Restraints Impact Analysis
| Restraint | (~) % Impact on CAGR Forecast | Geographic Relevance | Impact Timeline | |||
|---|---|---|---|---|---|---|
Stringent anti-money-laundering
compliance
Stringent anti-money-laundering
compliance
| -1.8% | Macau, Australia | Short term (≤ 2 years) |
(~) % Impact on CAGR Forecast
:
-1.8%
|
Geographic Relevance
:
Macau, Australia
|
Impact Timeline
:
Short term (≤ 2 years)
|
Substitution threat from online gambling
Substitution threat from online gambling
| -1.2% | Region-wide | Medium term (2-4 years) | |||
Visa curbs on foreign dealers/croupiers
Visa curbs on foreign dealers/croupiers
| −1.5 % | Macau, Singapore, Philippines, Australia | Short to Medium term (1‑3 years) | |||
ESG‑driven capital allocation pullback
ESG‑driven capital allocation pullback
| −2.0 % | Asia‑Pacific (esp. Australia, Japan, Singapore) | Medium term (2‑4 years) | |||
| Source: Mordor Intelligence | ||||||
Stringent Anti-Money-Laundering Compliance
AUSTRAC levied aggregate penalties exceeding AUD 517 million (USD 343 million) on Crown Resorts and SkyCity between 2024 and 2025 for record-keeping lapses, prompting a regional surge in compliance spending. Macau’s Gaming Inspection and Coordination Bureau now demands daily source-of-funds verification for transactions above MOP 500,000 (USD 62,050), obliging operators to augment KYC staffing and invest in reg-tech platforms. Incremental compliance expenditure adds 200-300 basis points to operating margins at large properties, while smaller venues shoulder disproportionate fixed-cost burdens. Enhanced disclosure regimes also lengthen onboarding times, occasionally discouraging high-value patrons. Although advanced analytics mitigate manual workloads, the near-term cost overhang tempers the Asia-Pacific casino gambling market’s profit trajectory. Over the medium term, however, rigorous compliance could boost investor confidence and support capital inflows into newly liberalizing markets.
Substitution Threat from Online Gambling
Lockdowns accelerated user migration to mobile sportsbooks and i-casino platforms that offer lower minimum stakes and always-on convenience. Post-reopening, many casual players continue to engage digitally, particularly in markets with mature online frameworks such as Australia, the Philippines, and parts of India. Land-based operators responded by launching live-streamed dealer tables and app-based loyalty extensions, yet regulatory prohibitions restrict full-fledged online casino offerings in Macau and Singapore. Younger demographics favor gamified experiences, presenting a demographic challenge to brick-and-mortar operators reliant on traditional table games. While omnichannel strategies create retention opportunities, mobile platforms’ relentless promotional cadence threatens to siphon incremental spend, capping upside for the Asia-Pacific casino gambling market.
By Game Type: Live Casino Accelerates Digital Convergence
Baccarat generated 34.76% of the Asia-Pacific casino gambling market share in 2024, underlining its cultural resonance and attraction for premium-mass patrons. Live casino games, however, are projected to register an 11.16% CAGR through 2030, making them the fastest-growing vertical within the Asia-Pacific casino gambling market. Operators deploy polished studio streams with multi-camera angles and AI-assisted dealer prompts, blurring lines between online and on-site play. Slots retained a 28.71% revenue share and benefited from progressive jackpot networks that raise headline payouts and entice casual visitors. Poker contributed 12.52% of total wagers as televised tournaments and influencer endorsements broadened appeal among younger players. Blackjack and other classic tables remain staples but face share pressure as floor space reallocates toward higher-yielding games. Because live casino technology captures data akin to online platforms, operators can execute more granular marketing campaigns that deepen wallet share across player tiers.
Baccarat’s longstanding dominance stems from low house edges and cultural familiarity, particularly among Chinese, Korean, and Vietnamese patrons. Yet its growth prospects hinge on converting VIP junket play into premium-mass revenue, a transition already visible at properties like Wynn Macau. Live casino’s scalability allows operators to reach offshore players subject to travel restrictions, unlocking incremental revenue without proportional capex. Rising female participation and demand for socially immersive experiences further support segment expansion. As AI tools analyze betting patterns, casinos can dynamically adjust side-bet offerings and minimums to stabilize margins. Consequently, live casino innovation is poised to reshape product portfolios and reinforce the Asia-Pacific casino gambling market size trajectory over the forecast horizon.
Note: Segment shares of all individual segments available upon report purchase
By Facility Format: Integrated Resorts Redefine Destination Appeal
Integrated resorts captured 42.26% of the Asia-Pacific casino gambling market size in 2024 and are expected to expand at a 10.18% CAGR to 2030. Their multi-revenue architecture spanning gaming, hotels, F&B, retail, and MICE generates stronger returns on invested capital and mitigates regulatory risk by diluting dependence on gambling alone. Stand-alone land-based casinos retained a 29.40% share but confront amenity gaps that limit dwell time and secondary spend. Cruise-ship casinos accounted for 11% of regional revenue, buoyed by the restoration of Asia-to-Asia itineraries and the launch of purpose-built gambling decks on new vessels. Riverboats and racinos together represented less than 7% of wagers, operating primarily in regulated niches within India and Australia.
IR development cycles are lengthening property lifespans: Marina Bay Sands derived more than 60% of 2024 revenue from non-gaming streams, validating the model for policymakers seeking economic diversification [3]Las Vegas Sands Corporation, “Annual Report 2024,” sands.com. The Osaka IR’s USD 8.6 billion project features 2,500 hotel rooms, 43,000 sqm of retail, and a 74,000-sqm MICE facility, illustrating the capital scale now typical for flagship projects. Cruise casinos leverage duty-free retail and entertainment packages to deliver blended yields comparable with mid-sized land plots, albeit with higher fuel and logistics costs. In the future, IR expansions in Manila, Incheon, and the Gold Coast will amplify regional supply but also raise quality benchmarks, forcing legacy stand-alone operators to accelerate refurbishments or consider strategic alliances. The resulting consolidation should support balanced occupancy rates and profitability across the Asia-Pacific casino gambling market.
By Ownership Structure: Commercial Operators Sustain Capital Momentum
Commercial ownership models dominated with 65.27% of the Asia-Pacific casino gambling market share in 2024 and are set to grow at a 9.33% CAGR to 2030. Their publicly listed status provides easier access to global debt and equity markets, funding multi-billion-dollar IR pipelines. State-run venues held a 24% share, constrained by political optics and slower decision cycles that impede rapid modernization. Tribal and indigenous operations, mainly in Australia, New Zealand, and Pacific Island jurisdictions, comprised roughly 9% of total revenue, with limited scope to expand beyond traditional geographies. Cooperative or charitable organizations filled the remaining niche, largely in localized bingo halls and small-stakes gaming rooms.
The commercial sector leads technology adoption because shareholder pressure prioritizes operating-margin expansion. MGM Resorts, for example, allocated USD 400 million to AI and digital initiatives across its Asia portfolio in 2025, expecting a two-year payback horizon. Conversely, state entities often earmark earnings for social programs, prioritizing employment over profit, which slows reinvestment cycles. Tribal operators face unique regulatory carve-outs but grapple with smaller catchment populations, although some, like SkyCity Darwin, pursue management contracts in adjacent markets to diversify exposure. Market liberalization in Thailand and Japan favours commercial bidders with international track records, suggesting that commercial dominance within the Asia-Pacific casino gambling market will continue to widen.
China accounted for 56.24% of regional revenue in 2024 thanks to Macau’s status as the world’s single largest casino hub, yet its share is edging downward as other jurisdictions enter the field. Japan is forecast to deliver a 14.24% CAGR to 2030, driven by the Osaka IR’s late-decade opening and a coordinated national tourism push that targets 60 million international visitors by 2030. Australia secured a 14.10% slice of 2024 wagers, benefiting from pent-up travel demand and the gradual reboot of international student inflows, which lifted ancillary hospitality revenues. South Korea contributed 11.30% annualized growth as foreigner-only licences in Incheon and Jeju captured overspill demand from Macau’s tightened junket ecosystem. Collectively, Southeast Asia, including the Philippines, Malaysia, Vietnam, and Cambodia, delivered 11.90% of spending and demonstrates strong upside as airports expand capacity and governments introduce investment-friendly regimes.
India recorded a 13.70% CAGR on a small base, reflecting steady visitor inflows to Goa’s offshore casinos and Sikkim’s land-based properties despite patchy legal clarity. Vietnam suspended its Phu Quoc locals-admittance pilot in January 2025, underscoring regulatory unpredictability and highlighting why some international operators hesitate to commit large-scale investments [4]Yogonet International, “Vietnam ends locals casino trial at Phu Quoc's Corona Resort,” yogonet.com. Thailand’s parliamentary hearings on casino legalization and Malaysia’s Genting Highlands expansion both point to meaningful supply additions that could reshape tourism flows. As a result, geographic diversification is becoming a core hedge against policy or macro shocks for firms pursuing steady growth within the Asia-Pacific casino gambling market.
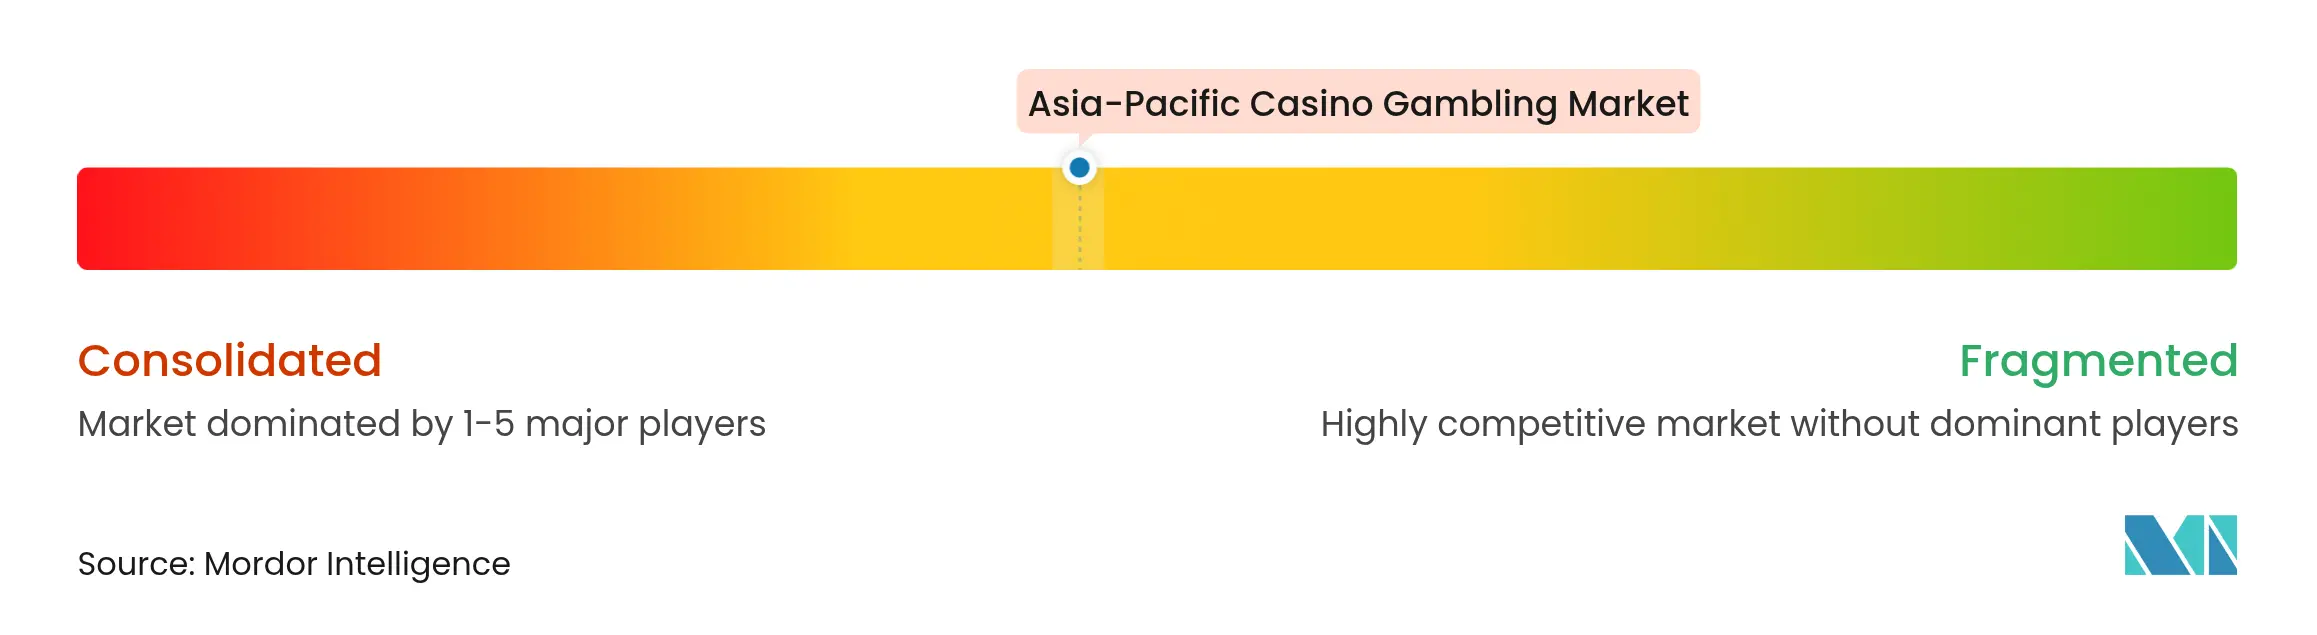
Market Concentration
The Asia-Pacific casino gambling market is characterized by moderate concentration, with a handful of leading operators dominating the landscape. This has resulted in an oligopolistic structure that combines operational scale with manageable competitive intensity. Major players like Galaxy Entertainment Group and Las Vegas Sands maintain a strong presence in Macau and Singapore, reinforcing their market leadership. In contrast, emerging markets remain more fragmented, offering room for regional operators and new entrants. The prevailing strategic focus includes integrated resort development, targeting premium-mass segments, and accelerating technology adoption to streamline operations and improve the customer experience.
White-space opportunities are emerging across secondary cities in India, Southeast Asia, and nascent markets such as Japan and Thailand, where regulatory environments are gradually adapting to accommodate casino development. Operators are actively exploring these regions, seeking first-mover advantages in jurisdictions with untapped demand. Meanwhile, technology has become a crucial differentiator, with Macau-based operators integrating advanced analytics like RFID and AI to optimize table game performance and ensure compliance. The competitive edge increasingly lies with those able to leverage data-driven insights and invest in digital transformation. These innovations not only improve operational efficiency but also meet rising regulatory expectations.
The rise of online gambling during pandemic-era lockdowns introduced a disruptive shift that continues to influence market dynamics. Digital platforms retained large customer bases post-COVID, compelling traditional operators to expand into omnichannel models and live casino formats. Esports is also gaining traction, offering casinos new ways to engage younger audiences through interactive tournaments and entertainment experiences. Compliance remains a critical challenge, particularly around anti-money laundering regulations, where larger operators gain an advantage through robust risk management systems. Penalties imposed on non-compliant firms underscore the growing regulatory pressure and the importance of compliance infrastructure as a competitive asset.

*Disclaimer: Major Players sorted in no particular order
1. Introduction
2. Research Methodology
3. Executive Summary
4. Market Landscape
5. Market Size & Growth Forecasts (Value, USD Bn)
6. Competitive Landscape
7. Market Opportunities & Future Outlook
A casino is a facility for certain types of gambling. Casinos are often built near or combined with hotels, resorts, restaurants, retail shops, cruise ships, and other tourist attractions. This report aims to provide a detailed analysis of the Asia-Pacific casino gambling market. It focuses on market dynamics, emerging trends in the segments and regional markets, and insights into the various product and application types. Also, it analyses the key players and the competitive landscape.
The Asia-Pacific casino gambling market is segmented by type (live casino, Baccarat, blackjack, poker, slots, and other casino games), by application (online or offline), and by geography (China, India, Australia, Japan, South Korea, and the Rest of Asia-Pacific).
The report offers market size and values in USD during the forecast period for the above segments.
Unlocking Saudi Arabia’s Regional Tourism Growth Potential
5 Min Read
MICE Sales Optimization for a Top Hotel Brand
3 Min Read
When decisions matter, industry leaders turn to our analysts. Let’s talk.